XAUUSD/GOLD INVESTING This for long term investment
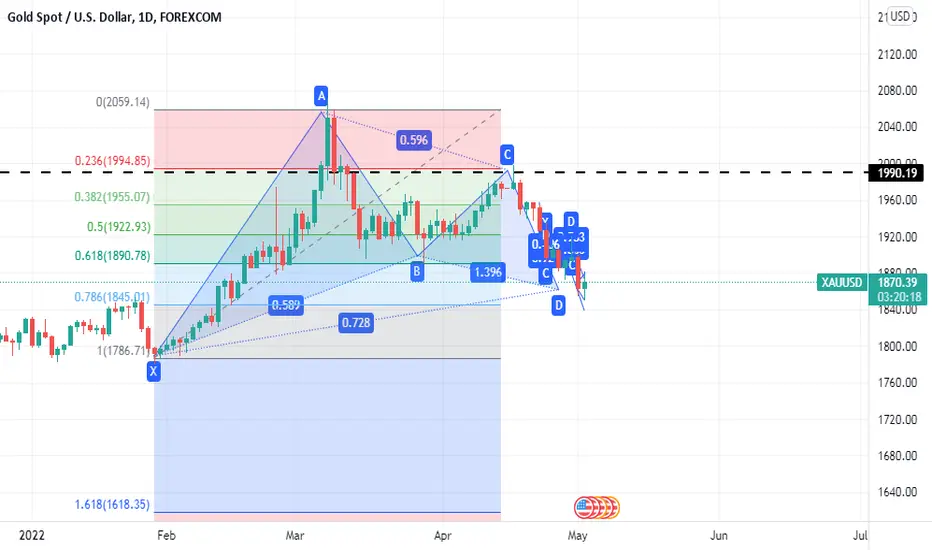
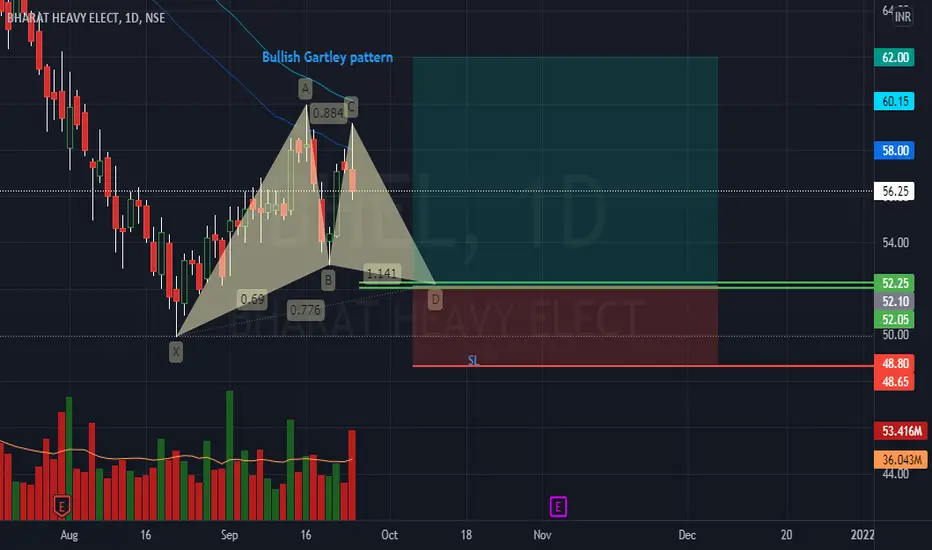
Look at the chart market made a Bullish Gartley pattern
according to bullish Gartley 'D' is buying point
market made d point or will be
it means buying let's check traget
so our target will be 1990
! It is not for short term investment !
! high risk = high reward !
Gartley
NIFTY FOR UPCOMING WEEK 28 MAR TO 31 MAR 2021Hello everyone this chart technically measured and filtered by INFINITYIV..
LAST CHART FAILED TO ACHIEVE ACCURACY…
WE ARE WORKING HARD TO BRING OUT THE LOOPHOLES.
LEVELS FOR THE WEEK.
RESISTANCE.
⬆️ 17184 ⬆️ 17447 ⬆️ 17798
SUPPORT.
⬇️ 17110 ⬇️ 16902 ⬇️ 16659
POSITIVE.
1. Reliance turned positive.
2. GST COLLECTION.
3. PCR.
NEGATIVE.
1. War still on.
2. Last week market not moved as prediction.
3. Buyers lost a lots.
4. Buyers have nothing to pull.
5. Sellers eat each other money. Means m
Nifty - Possible Leading Diagonal / Bearish GartleyThe leading diagonal or rising wedge or type-1 diagonal, is a narrowing price move composed of two converging trendlines.
If bottom or lows of 16836 & 16866 holds then Index can push upside tomorrow on account of Budget 2022
-----------------------------------
Trading Strategy
-----------------------------------
-----------------------------------
Part A - Mixed Outlook
-----------------------------------
Buy Above 17325 - Target 17410 / 17500 - Going into the PRZ (Potential Reversal Z
WaveTalks- Nifty: Bullish Gartley The fall from 18605 looks choppy & messy suggesting that the index could have finished a part of the corrective structure at 17799 lows @ 28th Oct2021 if holds above that level.
Bulls & Bears will be locking their horns between 18605 high & 17799 low – a range of Approx of 800 points.
---------------------------
Short Term Scenario
--------------------------
• Index can bounce upside. Reasons for bounce
• Harmonic Bullish Gartley PRZ (Potential Reversal Zone) 17799-17850
• Triangle B-D lin
HCL TechHCL Tech
Reasons/Traits :
• Bullish Gartley harmonic pattern is forming (gets confirmed if price goes and stays below 1254)
• Price below 13 EMA ready to touch 50 EMA
• Price is below 0.236 retracements levels
• RSI falling
What can happen next :
Scenario 1 : Price sustaining above 1265 levels can take it to 1285/1335/1365/1400 levels
Scenario 2 : Price break down below 1254 levels can take it down to 1227/1182/1135/1070/980 levels
Disclaimer : This analysis is only for educational purpose
NIFTY TO 17830 SCENARIO || BULLISH GARTLEY PATTERN|| DAT TFNifty could fall more if the price manages to close 17968 in day basis.
The breakout below 17968 could trigger a fall up to 17820 and then a sharp reversal can be seen.
The bounce could be up to 18150 from 17820.
Below the 17820 levels, the long unwinding may start. This should be the stoploss for longs.
Keep in mind, the RSI is at 50, if RSI falls below 50, then the fall could be faster till 30.
Best setup: Buy at PRZ ( between 17820 and 17720) when the RSI is near 30 or below.
Happy trad
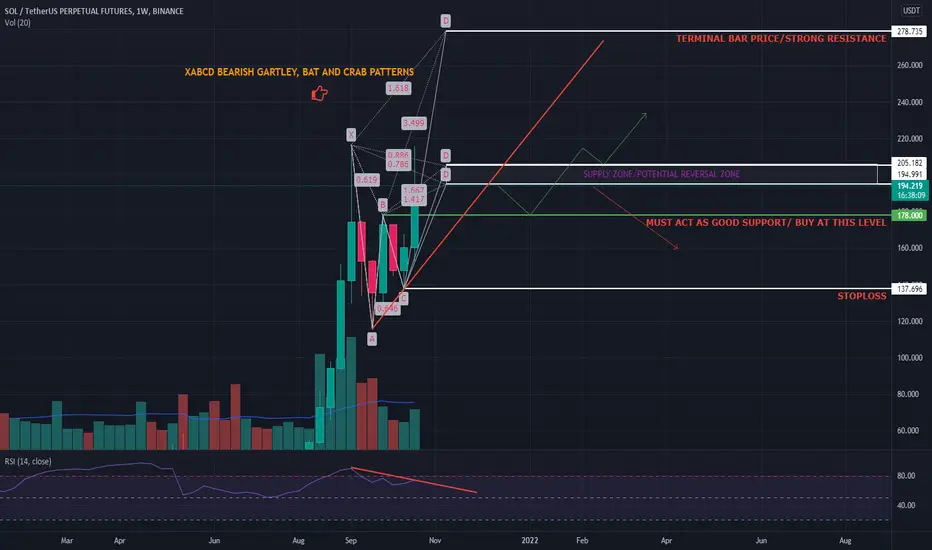
SOLANA (SOL) USDT PERPERTUAL PRICE ACTION ANALYSISSolana has had a spectacular run in the past 2 weeks. However, the price might correct a bit for a pullback as it is near a supply zone.
The XABCD bearish Gartley and Bat patterns had set a supply zone above which the price is struggling to sustain on the weekly chart. As we can see there's a bearish divergence developing on the RSI chart, i.e., the price is making higher highs but RSI is contradicting.
The XABCD bearish Crab pattern sets us a target of 278.
Trade Setup
1)Buy around 178 and p
WaveTalks- Nifty: Bullish Gartley PRZ 17450-17475 (Target-17740)H.M. Gartley's most trusted harmonic pattern - Bullish Gartley could be right there in the zone 17450-17475 which is assumed to be potential reversal zone.
-------------------------
Target
-------------------------
1st Target upside - 50 Period Moving Average = 17675
2nd Target upside- 17740 - where fall started on expiry day @ 30th Sep2021
------------------------------------------------
Stop Loss ( Avoid trading )
------------------------------------------------
As a trader you
TATA POWER Wait And Watch ??
Look for Low risk, High reward, and High Probability setups-
Things to Remember while Trading with the Trend
1. Know what the trend is.
2. The best trades are made in the direction of the trend.
3. Assume that the main trendline or moving average will hold.
4. The longer the moving average is, the better it defines the trend.
5. Wait for the pullback.
6. Don’t chase the market.
7. Don’t fight the market.
8. Even in the strongest trends there should be some retracement.
9. Th
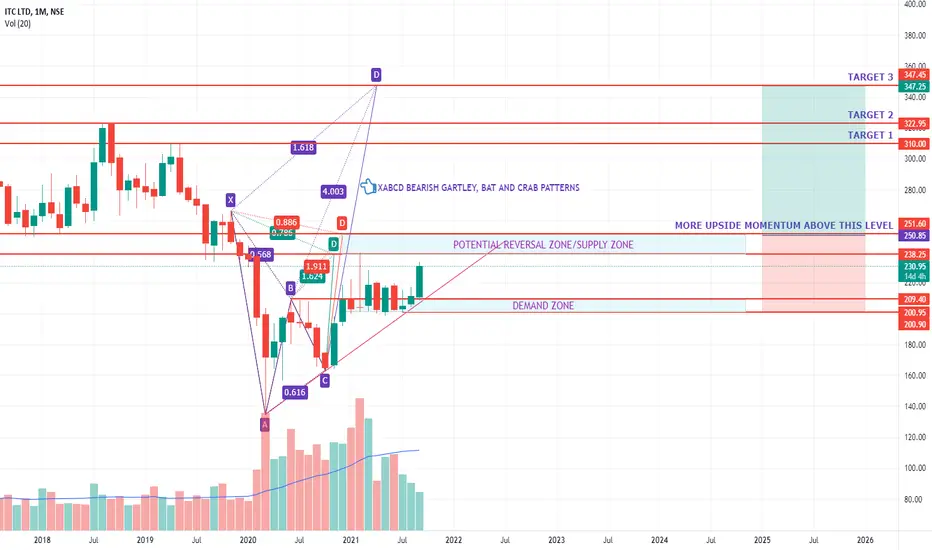
ITC PRICE ACTION ANALYSIS AND TARGETS ITC gave a long-awaited breakout today. But, for more upside, ITC has to cross the supply zone/PRZ mentioned on the chart.
The XABCD bearish Gartley, bat, and crab patterns set the targets for the ITC price in the future.
The stop loss has to be placed below the demand zone. If the stop loss percentage is above your risk, consider as per your appetite.
Happy trading :)
This is just for educational purposes.