Solana Builds Strength Above $72 as Bulls Target $80Solana continues to build a constructive recovery structure after rebounding from the $61–62 area. The latest move above $72 suggests buyers remain active, while recent pullbacks have been relatively shallow.
For crypto traders, the key zone now sits around $74–76. A breakout there could attract fresh momentum buyers and open the path toward higher levels.
Trade Setup:
Buy Zone: $72.00 – $73.00
Stop Loss: $69.50
Take Profit 1: $76.00
Take Profit 2: $80.00
Take Profit 3: $82.00
As long as SOL holds above $71, the recovery structure remains favourable for further upside.
Harmonic Patterns
USDCAD Trend Remains Strong as USD OutperformsUSDCAD continues to trend higher with very little evidence of weakness. Instead of sharp corrections, the pair keeps finding buyers on dips, suggesting that market participants still favour the US Dollar.
The macro backdrop supports this view. Stronger US economic releases, higher US yields, and weaker oil prices have all helped maintain pressure on the Canadian Dollar.
Trade Setup:
Buy Zone: 1.4050 – 1.4100
Stop Loss: 1.4000
Take Profit 1: 1.4200
Take Profit 2: 1.4250
Take Profit 3: 1.4300
As long as price remains above 1.4050, pullbacks are likely to be viewed as buying opportunities rather than trend reversals.
XAUUSD H1: Early Week Rebound, But 4,220 Is the Key DecisionXAUUSD H1: Early Week Rebound, But 4,220 Is the Key Decision Zone
Fundamental Analysis
Gold has ended its three-day losing streak after reaching the lowest area in more than one week. However, the recovery is still not fully convincing because the market remains pressured by a stronger US dollar and the hawkish Fed outlook.
Lower inflation and rate-cut expectations are giving gold some support, but uncertainty around Iran and the Fed’s restrictive stance continue to limit the upside. This means gold may recover in the short term, but the broader trend still needs confirmation before turning bullish again.
Technical Analysis
On the H1 timeframe, gold is trading around 4,177 after scanning the buy-side liquidity near 4,120. Price is now showing a slight rebound, but the main structure still leans bearish after the strong drop from the upper selling zone.
From an SMC view, the 4,140 - 4,165 area is the short-term OB zone. If price holds above this area, gold may continue the rebound at the beginning of the week.
The key resistance above is 4,215 - 4,220. This is the strong liquidity area and also the first major level buyers need to reclaim. If gold breaks and holds above 4,220, the recovery may extend higher.
However, if price falls back below 4,140, sellers may regain control and gold could retest 4,120 or move lower.
Key Price Zones
Current price: 4,177
Short-term OB zone: 4,140 - 4,165
Buy-side liquidity: 4,120
Key resistance: 4,215 - 4,220
Upper selling zone: 4,310 - 4,325
Major OB zone: 4,360 - 4,380
Bearish invalidation: Above 4,220
Bullish invalidation: Below 4,120
Trading Plan
Primary Scenario: Buy Reaction From OB Zone
Entry: 4,140 - 4,165 after bullish confirmation
Stop Loss: Below 4,120
Take Profit 1: 4,200
Take Profit 2: 4,215 - 4,220
Take Profit 3: 4,310 - 4,325
Entry Conditions
Price holds above the 4,140 - 4,165 OB zone.
Buyers show clear bullish rejection.
H1 or lower timeframe forms bullish CHOCH.
Price reclaims 4,177 with strength.
Avoid buying if price breaks and holds below 4,120.
Alternative Scenario: Sell From Resistance
Entry: 4,215 - 4,220 after bearish confirmation
Stop Loss: Above 4,245
Take Profit 1: 4,165
Take Profit 2: 4,140
Take Profit 3: 4,120
Sell Conditions
Price retests the 4,215 - 4,220 liquidity zone and fails to break higher. If bearish rejection appears from this area, gold may continue the broader bearish structure.
Breakdown Scenario
Entry: Below 4,120 after confirmed breakdown and retest
Stop Loss: Above 4,145
Take Profit 1: 4,080
Take Profit 2: 4,050
Take Profit 3: 4,020
Overall View
At the beginning of the week, gold may create a short-term rebound from the 4,140 - 4,165 OB zone. However, the main trend has not turned bullish yet.
The most important level this week is 4,215 - 4,220. If buyers reclaim this zone, gold may recover toward 4,310 - 4,325. If price rejects from 4,220 or breaks below 4,120, bearish pressure may return quickly.
For now, the better plan is to wait for confirmation around 4,140 - 4,165 or 4,215 - 4,220 instead of chasing price in the middle.
Do you think gold will reclaim 4,220 this week, or will sellers push price back below 4,120?
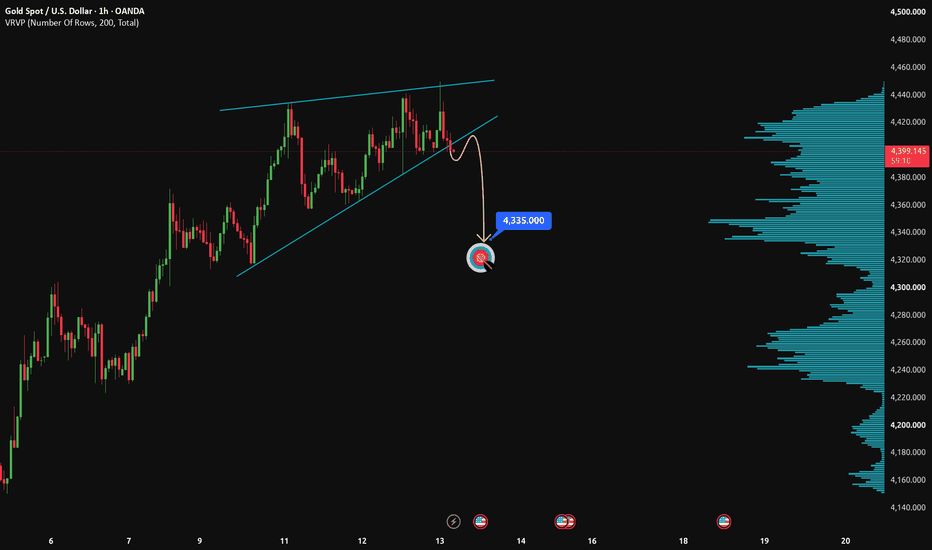
Gold Rally Faces Resistance as Sellers Eye Another Move LowerGold has recovered from the $4,100 region, but the rebound is approaching a major resistance zone near $4,240–4,250. For now, the move still looks corrective rather than the beginning of a new bullish trend.
The macro backdrop remains challenging. Traders are focused on US PMI releases, housing data, and upcoming inflation numbers. Strong economic data could keep the US Dollar supported and reduce the appeal of non-yielding assets like gold.
Trade Setup:
Sell Zone: $4,240 – $4,250
Stop Loss: $4,290
Take Profit 1: $4,150
Take Profit 2: $4,100
Take Profit 3: $4,080
Unless gold breaks and holds above $4,250, rallies may continue to attract selling interest.
Reliance Industries Ltd (RELIANCE) - AnalysisWhile Reliance Industries remains bullish for short-term swing trading, its long-term positional and investment outlook has turned bearish, making recent bounces an opportunity to exit existing positions. Key levels to watch are 1344 to 1385 (bullish above) and 1263 to 1214 (bearish below)
**Consider buffer points in above levels
**Disclaimer -
I am not a SEBI registered analyst or advisor. I does not represent or endorse the accuracy or reliability of any information, conversation, or content. Stock trading is inherently risky and the users agree to assume complete and full responsibility for the outcomes of all trading decisions that they make, including but not limited to loss of capital. None of these communications should be construed as an offer to buy or sell securities, nor advice to do so. The users understands and acknowledges that there is a very high risk involved in trading securities. By using this information, the user agrees that use of this information is entirely at their own risk.
Thank you.
Options TradingIn options trading, institutional traders usually have advantages over retail traders because they have access to better technology, market data, and experienced analysts. Institutions often use options to hedge portfolios, manage market exposure, and improve investment returns. For example, a fund manager may buy put options to protect investments during uncertain market conditions. Their trading strategies are usually more disciplined and data-driven compared to individual investors.
Trading Masterclass #1Institutional trading means trading like hedge funds, banks, prop firms, and professional desks. They do not trade based on emotions, random tips, or gambling. They use systems, probabilities, risk control, position sizing, discipline, and psychology.
Retail traders often lose because they focus only on “entry.” Institutions focus on:
Risk Management
Capital Protection
Position Sizing
Probability
Psychology
Consistency
Repeatable Edge
In options trading, if you think like institutions, your results can improve significantly
Institution Option Trading Part-1PCR means Put Call Ratio
It tells us how many Put options and Call options people are buying or trading.
Why it matters for institution trading
Big players mostly use options. So PCR helps us understand what big money may be thinking.
If PCR is high
More puts than calls.
Means traders are scared or taking protection.
Sometimes big players expect weakness.
If PCR is low
More calls than puts.
Means confidence in upside.
Sometimes market is bullish.
Why learn this
Price only shows movement.
PCR shows mindset behind movement.
Institutions think different
Retail people chase candles.
Institutions manage risk first.
PCR helps you see that risk activity.
Bank nifty may reverse @ 60000Bearish Bat Pattern Rules
XA = Downward move
AB = 38.2%–50% retracement of XA
BC = 38.2%–88.6% retracement of AB
CD = 161.8%–261.8% extension of BC
D = 88.6% retracement of XA
Trading Setup
Entry: Near Point D after confirmation (candlestick reversal, RSI divergence, etc.)
Stop Loss: Below D (Bullish Bat) / Above D (Bearish Bat)
Targets:
Target 1 = 38.2% retracement of AD
Target 2 = 61.8% retracement of AD
Target 3 = Point B
XAUUSD/GOLD WEEKLY SELL PROJECTION 21.06.26XAUUSD / GOLD – 1H SELL PROJECTION (21.06.2026)
This chart suggests a bearish (sell) setup on the 1-hour timeframe.
1. Market Structure
Price is trading inside a Falling Wedge Pattern (red trendlines).
There is also a parallel downtrend channel (blue lines).
Overall trend remains bearish because price continues to make lower highs and lower lows.
2. Entry Zone
The chart expects a pullback upward first.
Price may retest the 0.5 Fibonacci level (4206) and 0.618 Fibonacci level (4164) area.
This area also coincides with:
Resistance zone
Downtrend line resistance
Previous supply area
Expected move: Price rises into resistance → sellers enter → market reverses downward.
3. Stop Loss
Stop loss is placed above the major resistance zone around 4290–4300.
If price breaks and closes above this area, the sell setup becomes invalid.
4. Important Breakdown Area
The chart highlights:
"BREAK BELOW HERE = STRONG SELLING"
Support zone around 4100 is critical.
If price breaks below this support, bearish momentum is expected to increase significantly.
5. Take Profit Targets
TP1: Around 4155
First support/resistance flip area.
Partial profit booking zone.
TP2: Around 4100
Strong support zone.
Major reaction area.
TP3: Around 3885–3900
Major support zone.
Final bearish target shown in the chart.
6. Trading Idea Summary
✅ Wait for price to retrace into resistance.
✅ Look for bearish confirmation:
Bearish engulfing candle
Rejection wick
CHOCH (Change of Character)
Lower High formation
✅ Enter sell after confirmation.
🎯 Targets:
TP1 → 4155
TP2 → 4100
TP3 → 3885
🛑 Stop Loss:
Above 4290–4300
BANKNIFTY- Positional/swing trade levelsif BANKNIFTY sustain above 57921 then bullish then 58448 to 28552 above this more bullish then 59212/298 then 60285 to 60371
If BANKNIFTY sustain below 57142 below this bearish 56932 then then 56832 thnen26732 or 56666 to 56534 below this more bearish then 52250 to 51971 below this more bearish then 54685 to 54607 then 54521 to 54481 below this wait
Consider some buffer points in above levels.
Please do your due diligence before trading or investment.
**Disclaimer -
I am not a SEBI registered analyst or advisor. I does not represent or endorse the accuracy or reliability of any information, conversation, or content. Stock trading is inherently risky and the users agree to assume complete and full responsibility for the outcomes of all trading decisions that they make, including but not limited to loss of capital. None of these communications should be construed as an offer to buy or sell securities, nor advice to do so. The users understands and acknowledges that there is a very high risk involved in trading securities. By using this information, the user agrees that use of this information is entirely at their own risk.
Thank you.
Xauusd gold weekly Updates 22.06.2026..26.06.2026*🟡 XAUUSD(GOLD) – WEEKLY UPDATE 🟡 ⏰*
*Validity: 22-06-26 to 26-06-26*
*🔹 Bullish Scenario (BUY)*
*• Trend Confirmation: Above 4390*
*• Targets: 4470 – 4570*
*🔻 Bearish Scenario (SELL)*
*• Trend Confirmation: Below 4050*
*• Targets: 3970 – 3820*
*🔄 Key Reversal / Entry Level: 4215*
Ind-swift Laboratories Limited - Breakout Setup, Move is ON...#INDSWFTLAB trading above Resistance of 186
Next Resistance is at 309
Support is at 121
Here is previous chart:
Chart is self explanatory. Levels of breakout, possible up-moves (where stock may find resistances) and support (close below which, setup will be invalidated) are clearly defined.
Disclaimer: This is for demonstration and educational purpose only. This is not buying or selling recommendations. I am not SEBI registered. Please consult your financial advisor before taking any trade.
ETERNAL (1D): Double Bottom Signals Potential Bullish ReversalDescription:
Looking at the daily chart for ETERNAL (NSE), we can see a compelling bullish setup taking shape after a prolonged downtrend earlier in the year.
Key Observations:
Base Formation: After a sharp sell-off in Q1, the price has spent the last few months in an accumulation zone, establishing an ironclad support floor around the 234-238 level.
Double Bottom Pattern: The price action has carved out a clear Double Bottom ("W") reversal pattern, indicating a strong shift in momentum from the bears to the bulls.
Neckline Breakout: We are currently seeing a test of the neckline resistance at the 264-265 zone. A strong daily close above this level will confirm the pattern.
Upside Target: Based on the pattern's depth and previous market structure, a successful breakout projects an upside move toward the previous high of 308.55.
Disclaimer: Always manage your risk and utilize stop losses. This analysis is for educational purposes and does not constitute financial advice.
Option Trading
NIFTY 50 Option Trading
Why Traders Prefer NIFTY Options
High liquidity
Tight bid-ask spread
Smooth price movement
Suitable for scalping and intraday trading
Best Strategy for NIFTY
Trend Following Strategy
Buy CE when:
Price above VWAP
Put writing increases
Resistance breakout confirmed
Trading Banknifty and Nifty AnalysisOptions Data
PCR at 0.90, slightly bearish reading
Max call pain sitting near 55,000, acting as a ceiling
What to Do
Short traders hold with stop-loss above 54,609 on daily close
Long trades only if index closes above 54,609
Avoid aggressive buying unless 56,400 is reclaimed with a proper closing
Key Risk
Crude oil above 100 dollars is a pressure point for India
Any global news on geopolitics can cause sudden sharp moves either way
NIFTY- Intraday Levels :- 22nd June 2026 NIFTY sustain above 24038/54/70 above this bullish then around 24085/102/108 then 24130/138 then 24160/168172 above this more bullish then 24187/203/206 above this wait more levels for more level are marked on chart
If NIFTY sustain below 23013 then 23993/89 below this bearish then around 23888 then 23750/34 below this more bearish then 23689/661 below this wait
My view :-
"My viewpoint, offered purely for analytical consideration, The trading thesis is: Nifty (bullish tactical approach: buy on dip) this view will work only if market opens negative otherwise it will be sell on rise.
This analysis is highly speculative and is not guaranteed to be accurate; therefore, the implementation of stringent risk controls is non-negotiable for mitigating trade risk."
Consider some buffer points in above levels.
Please do your due diligence before trading or investment.
**Disclaimer -
I am not a SEBI registered analyst or advisor. I does not represent or endorse the accuracy or reliability of any information, conversation, or content. Stock trading is inherently risky and the users agree to assume complete and full responsibility for the outcomes of all trading decisions that they make, including but not limited to loss of capital. None of these communications should be construed as an offer to buy or sell securities, nor advice to do so. The users understands and acknowledges that there is a very high risk involved in trading securities. By using this information, the user agrees that use of this information is entirely at their own risk.
Thank you.
XAUUSD M30: Weekly Bearish Structure Remains Intact, Rebound XAUUSD M30: Weekly Bearish Structure Remains Intact, Rebound Opportunities Still Considered Corrective
Fundamental Analysis
XAU/USD is approaching the end of the week under sustained selling pressure after failing to maintain momentum near its recent all-time high. Despite ongoing geopolitical tensions in the Middle East and persistent inflation concerns globally, gold has struggled to attract strong safe-haven demand.
The primary driver behind this weakness remains the Federal Reserve's restrictive monetary stance. Recent economic data continues to support the possibility of higher-for-longer interest rates, keeping US Treasury yields elevated and strengthening the US Dollar Index.
From a broader weekly perspective, gold has spent most of the week trading lower after rejecting major supply zones near the highs. This indicates that institutional profit-taking and liquidity rebalancing are currently outweighing bullish macroeconomic factors.
As long as the market continues to price in a hawkish Fed outlook, gold may remain vulnerable to further downside corrections before any sustainable bullish continuation develops.
Technical Analysis
Weekly Perspective
Looking at the overall weekly structure, gold remains in a long-term bullish trend. However, the current week has developed as a corrective bearish candle following the aggressive rally that pushed prices to record highs.
The rejection from the weekly supply zone around 4,360 - 4,380 suggests that smart money has been taking profits while seeking liquidity below recent lows. This week's price action has created a deeper retracement, but it has not yet invalidated the broader bullish trend on higher timeframes.
For now, the weekly outlook favors continued correction unless buyers reclaim key resistance levels and restore bullish momentum.
H4 Structure
On H4, the market has already shifted into a corrective bearish phase after breaking several internal bullish structures. Lower highs and lower lows continue to form, confirming that sellers remain dominant in the medium-term trend.
The bearish order block around 4,310 - 4,330 remains a significant institutional supply zone. Any rally into this area could attract fresh selling pressure.
M30 Structure
On the M30 timeframe, gold remains clearly bearish after breaking the major BOS level around 4,221.
Price continues to trade below the descending trendline that has guided the decline throughout the week. This trendline remains the most important dynamic resistance currently controlling market direction.
The market is now trading around 4,155 inside the buy-side liquidity zone between 4,140 and 4,160. A minor CHOCH has appeared, suggesting that short-term buyers may attempt a recovery move.
However, from a professional market structure perspective, this rebound should currently be viewed as a corrective pullback rather than a trend reversal.
Only a decisive break above 4,221 would invalidate the current bearish structure and signal a stronger bullish recovery.
Market Structure Summary
Weekly Trend: Bullish but correcting
H4 Trend: Bearish correction
M30 Trend: Bearish
Market Bias: Sell rallies until 4,221 is reclaimed
Key Price Zones
Current Price: 4,155
Buy-side Liquidity Zone: 4,140 - 4,160
Short-Term Reaction Level: 4,167
Intraday Resistance: 4,200
Major BOS Resistance: 4,221
Bearish Order Block: 4,310 - 4,330
Weekly Supply Zone: 4,360 - 4,380
Lower Support: 4,120
Extended Support: 4,100
Bearish Invalidation: Above 4,221
Trading Plan
Primary Scenario: Corrective Buy Toward Resistance
Entry: 4,140 - 4,160 after bullish confirmation
Stop Loss: Below 4,120
Take Profit 1: 4,167
Take Profit 2: 4,200
Take Profit 3: 4,221
Entry Conditions
Price must hold above the 4,140 - 4,160 liquidity zone.
A bullish rejection candle, CHOCH, or bullish engulfing pattern should appear on M30 or lower timeframe.
Price should reclaim and hold above 4,167.
Volume and momentum should support the recovery.
This setup remains a counter-trend trade within the broader bearish structure.
Avoid buying if price closes below 4,140.
Alternative Scenario: Sell From Resistance
Entry: 4,200 - 4,221 after bearish confirmation
Stop Loss: Above 4,245
Take Profit 1: 4,167
Take Profit 2: 4,140
Take Profit 3: 4,120
Sell Conditions
Price rebounds into the resistance zone and fails to break above 4,221.
Bearish rejection candles appear near the descending trendline.
A lower timeframe CHOCH confirms renewed selling pressure.
This remains the higher-probability setup while the weekly correction continues.
Breakdown Scenario
Entry: Below 4,140 after confirmed breakdown and retest
Stop Loss: Above 4,167
Take Profit 1: 4,120
Take Profit 2: 4,100
Take Profit 3: 4,080
Breakdown Conditions
Price closes decisively below 4,140.
Retest of broken support fails.
Selling volume increases during the retest.
The weekly bearish correction accelerates toward deeper liquidity zones.
Overall View
From a professional multi-timeframe perspective, gold remains in a long-term bullish market but is currently experiencing a significant weekly correction.
The weekly rejection from the 4,360 - 4,380 supply zone has shifted short-term control to sellers. H4 and M30 structures continue to support bearish momentum, while the descending trendline remains intact.
The 4,140 - 4,160 liquidity zone may generate a temporary rebound, but any recovery below 4,221 should still be viewed as a corrective move rather than a genuine bullish reversal.
The most important level remains 4,221. As long as price trades below this BOS resistance and below the descending trendline, the preferred strategy is to sell rallies rather than chase buys.
Only a confirmed break and hold above 4,221 would suggest that the weekly correction has ended and that buyers are preparing for another attempt toward the 4,310 - 4,330 supply zone and eventually the weekly highs around 4,360 - 4,380.
The key question for next week is whether buyers can defend the 4,140 - 4,160 liquidity zone and trigger a recovery toward 4,221, or whether sellers will extend the weekly correction toward 4,120 and lower liquidity targets.
19th June 2026 - Nifty Report - 24000 conquered yet againNifty Stance: Slightly Bullish
We began this week with a 358-pt gap-up (~1.52%), mostly due to the signing of the peace deal between Iran and the US on 14th Jun. This also meant we broke two resistance levels, i.e., 23793 and 23925, in a single go. Nifty had a really good day on Thursday and tried to take out the 24192 resistance, but we fell short of time. On Friday, we woke up to bad news from Accenture, which had to cut its yearly earnings guidance; this really impacted the Indian IT stocks: Infy (-6.75%), TCS (-3.55%), and HCLTECH (-2.59%). Despite this, the Nifty managed to close above the psychological 24,000 level.
---
The faster EMA remains above the slower EMA, and our stance remains bullish. However, the ADX (Average Directional Index) has fallen below 20 (18.56), indicating range-bound trading yet again. If we see a further drop in momentum, then we could even see an EMA crossover to the bearish side.
Important Things to Watch for the Next Week
Data points to watch from a domestic perspective: Infrastructure Output, HSBC PMIs, Deposit Growth, FX reserves and M3 money supply. 26th June is a holiday due to Muharram.
Data points to watch from a global perspective: S&P Services and Manufacturing PMI, Crude Oil Inventories, and US GDP (Q1)
IPO Listing: Clay Craft, Diksha Polymers, Leapfrog Engineering Services, and Liotech Industries on 24th June.
If Nifty moves up, the resistance levels are 24192, 24335, and 24425. If Nifty falls, the support levels are 23925, 23793, and 23357.
---
DISCLAIMER
Investments in the securities market are subject to market risks, including the potential loss of principal. Past performance does not guarantee future results. Information provided is for educational purposes only and should not be considered financial advice. Investors should read all related documents carefully and consult a certified advisor before investing. Registration granted by SEBI and Enlistment with RAASB/BSE and certification from NISM in no way guarantee performance of the intermediary or provide any assurance of returns to investors. The investor is requested to take into consideration all the risk factors before actually trading in stocks or derivatives. The SEBI RIA license INA000021757 & RA license INH000025045 are for Balachandran RV