Long
Long
Dow Jones Futures Wave 2 Pullback Targets 51,182–49,991Dow Jones Futures (YM) is pulling back to correct the cycle from the 45,430 low in wave 2. The Elliott Wave structure suggests that the index remains vulnerable to further downside in the near term, as long as it stays below the 53,105 high. The decline from the peak completed three swings within wave (w), followed by a corrective bounce in wave (x). This bounce ended at 53,105, and YM has since turned lower again. The current structure suggests that the index is developing another five-wave decline in wave (y), which could complete the larger wave 2 correction.
We expect wave (y) to extend toward the 51,182–49,991 area. This zone represents the 100%–161.8% Fibonacci extension of wave (w) and could provide an important area for the next reaction. How YM responds there will help determine whether the entire wave 2 pullback has ended or whether the current decline represents only part of a larger correction.
In the next 24 hours, we expect any bounce to fail in 3- 7- or 11-swings to continue downside while remaining below 53,105. However, the wave 2 pullback still appears relatively shallow compared with the previous advance from 45,430. Therefore, there is a possibility that the correction could extend further and develop into a larger 7- or 11-swing structure.
For now, the near-term bias remains lower, with 51,182–49,991 serving as the key zone to watch for signs of support and a potential change in structure.  Long
Long
Gold Doesn’t Hate You — It’s Testing Your Risk ManagementAfter a few losing trades on Gold, many traders start saying things like, “XAU/USD is too difficult,” “Gold always hunts my stop loss,” or “The market is trading against me.”
But the truth is simple: Gold doesn’t hate you. It is testing the way you manage risk.
Gold is one of the most volatile markets. It reacts quickly to economic news, bond yields, the U.S. dollar, and shifts in market sentiment. That means if your position size is too large, your stop loss is too tight, or you trade emotionally, Gold will expose those mistakes very quickly.
1. The problem is not always your entry
Many traders correctly predict the market direction and still lose money. Why?
Because they:
- Use too much leverage
- Place their stop loss poorly
- Move the stop when price goes against them
- Hold losing trades for too long
- Add more positions in an attempt to recover losses
You can be right about the direction and still lose because your risk management is wrong.
2. Gold punishes poor discipline
XAU/USD does not give traders much room to repeat the same mistakes. Just a few oversized trades or revenge trades can seriously damage an account.
A beginner usually asks:
“Will this trade win?”
An experienced trader asks:
“How much will I lose if this trade is wrong?”
That is the real difference.
3. What does good risk management look like?
A solid Gold trading plan should include:
- Defining the risk before entering
- Risking only a small percentage of the account
- Placing the stop loss where the setup is truly invalidated
- Never increasing position size just to recover a loss
- Accepting that missing a trade is better than damaging the account
4. What Gold may be teaching you
If Gold keeps hitting your stop loss, the market may not be working against you. It may be showing you that:
- You are entering too early
- Your stop loss is too tight
- You are not waiting for confirmation
- Your position size is too large for your risk tolerance
This is not punishment. It is feedback.
Checklist before trading Gold
Before pressing Buy or Sell, ask yourself:
- What percentage of my account am I risking?
- Is my stop loss based on market structure?
- Will I remain calm if this trade loses?
- Am I following my plan or reacting emotionally?
- Am I trying to trade properly, or just trying to make money quickly?  Education
Will Bitcoin hit $35000 before $300K?History Has A Habit Of Repeating Itself.
In 2018, The SEC Rejected A Spot Bitcoin ETF While #Bitcoin Was Trading Around $8,500.
Following The Rejection, BTC Crashed From $8,500 To $3,128, A 63% Correction.
Yet Over The Next 3 Years, Bitcoin Rallied More Than 2,100% (ATH $69,000 in 2021)
Now, We May Be Facing A Similar Moment With The U.S. Clarity Act.
If The Clarity Act Is Rejected, I Believe The Market Could React Negatively In The Short Term. A 30–50% Correction Would Not Surprise Me, Which Could Put Bitcoin Somewhere In The $40K–$30K Range.
However, If History Rhymes Again, That Correction Could Become The Foundation For The Next Major Bull Run.
In My View, The Next 3 Years Could See Bitcoin Trading Above $300K By 2029.
The Biggest Opportunities Often Appear When Fear Is At Its Highest.
NFA. Always DYOR.  Long
Long
Why Simple Trading Often Produces Better ResultsMany traders believe that more indicators, more timeframes, and more analysis will improve their results.
Often, the opposite happens.
Too much information creates confusion. One indicator says buy, another says sell, and the trader starts changing decisions based on emotion.
Simple trading does not mean careless trading. It means having a clear process:
Market context → Key level → Confirmation → Risk
First, understand whether the market is trending or ranging. Then wait for price to reach an important area. Do not enter immediately—look for confirmation. Before opening the trade, decide where the idea becomes invalid and how much you are willing to lose.
A simple plan also makes patience easier. When your conditions are not present, there is no trade. You do not need to chase every candle or participate in every market move.
Simple strategies are easier to review as well. You can clearly see whether the setup was valid, the risk was controlled, and the plan was followed.
The goal is not to predict every movement.
The goal is to make fewer decisions, but better ones.
Beginners search for more signals. Professionals wait for clearer opportunities.
This article is for educational purposes only and is not investment advice. Education 
 Long
Long
Why Simple Trading Often Produces Better ResultsMany traders believe that more indicators, more timeframes, and more analysis will improve their results.
Often, the opposite happens.
Too much information creates confusion. One indicator says buy, another says sell, and the trader starts changing decisions based on emotion.
Simple trading does not mean careless trading. It means having a clear process:
Market context → Key level → Confirmation → Risk
First, understand whether the market is trending or ranging. Then wait for price to reach an important area. Do not enter immediately—look for confirmation. Before opening the trade, decide where the idea becomes invalid and how much you are willing to lose.
A simple plan also makes patience easier. When your conditions are not present, there is no trade. You do not need to chase every candle or participate in every market move.
Simple strategies are easier to review as well. You can clearly see whether the setup was valid, the risk was controlled, and the plan was followed.
The goal is not to predict every movement.
The goal is to make fewer decisions, but better ones.
Beginners search for more signals. Professionals wait for clearer opportunities.
This article is for educational purposes only and is not investment advice. Education 
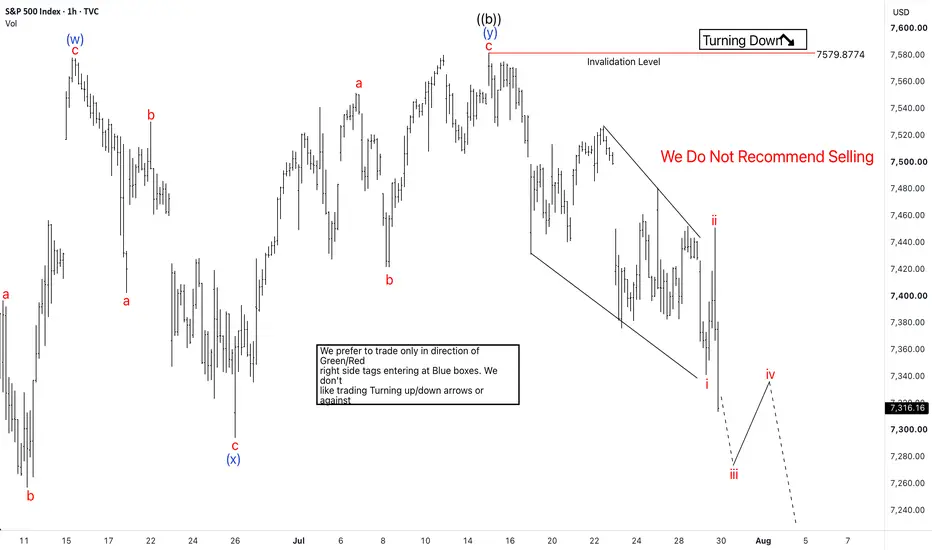
SPX Pullback Targets 7193–6953 Before Another BounceThe S&P 500 (SPX) is currently correcting the strong advance from the 6317 low to the 7620 peak in wave 2. Based on the current Elliott Wave structure, the index appears to be forming a flat correction. Sub-waves ((a)) and ((b)) look complete, and SPX is now progressing lower in the final five-wave decline of wave ((c)). We expect wave ((c)) to extend toward the 7193–6953 area. This zone represents the 100%–161.8% Fibonacci extension of wave ((a)) and could provide an area for the correction to find support and trigger another bounce.
The structure still allows for the possibility of a deeper decline. However, as long as SPX remains above the 6317 low, we expect the pullback to eventually find support. The correction could complete in 3, 7, or 11 swings, depending on how the structure develops.
In the short term, the index remains vulnerable to further downside. Over the next 24 hours, we expect SPX to continue lower while staying below the 7579 invalidation level. The decline may include short-term corrective bounces along the way as wave ((c)) unfolds.
Once the correction completes, the broader bullish structure can resume, provided SPX holds above 6317. Therefore, the 7193–6953 region remains an important area to monitor for signs of support and a potential turn higher. Short

Trading Masterclass #1Institutional trading means trading like hedge funds, banks, prop firms, and professional desks. They do not trade based on emotions, random tips, or gambling. They use systems, probabilities, risk control, position sizing, discipline, and psychology.
Retail traders often lose because they focus only on “entry.” Institutions focus on:
Risk Management
Capital Protection
Position Sizing
Probability
Psychology
Consistency
Repeatable Edge
In options trading, if you think like institutions, your results can improve significantly  Education


Long 


 Short
Short
 Short
Short