#TBZ DIVERGENCE WARNING: Daily strong but W + M both negative.
- Structure: Bottom at ₹110.50 → recovery to 157 → today +20% UC to 165.49
- Upper circuit driven move — could be news/event based
- Weekly and Monthly CCI have NOT confirmed — this is NOT a valid positional per NimblrTA rules
- Per NimblrTA: Positional requires at least CCI W > 100. Here W = -13.9
Harmonic Patterns
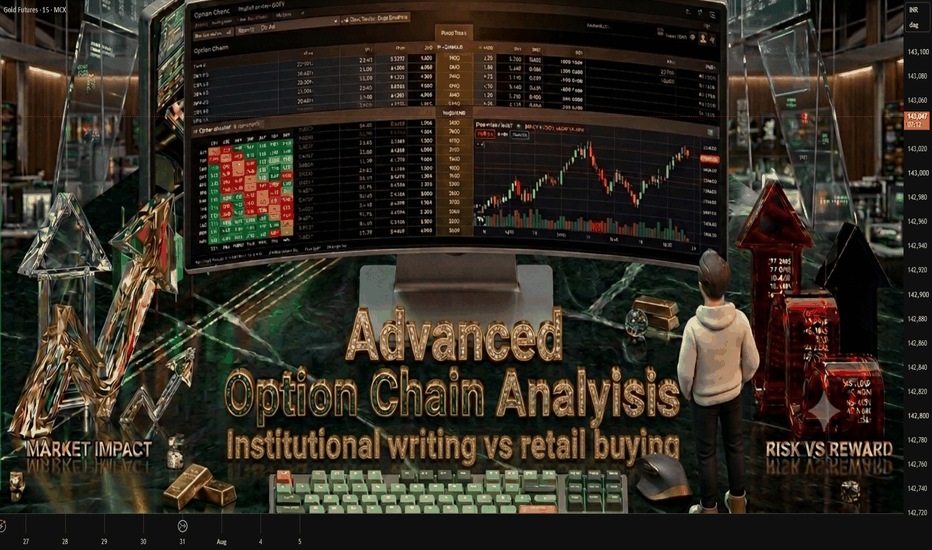
Road Mapoptions trading and institutional trading are important parts of modern financial markets. Options trading offers flexibility and opportunities for profit, while institutional trading provides liquidity and stability to the market. However, beginners should learn market concepts carefully before entering options trading because losses can occur quickly without proper knowledge and risk management. Education, practice, and disciplined investing are essential for long-term success in trading.
Advanced Options TradingIn options trading, institutional traders usually have advantages over retail traders because they have access to better technology, market data, and experienced analysts. Institutions often use options to hedge portfolios, manage market exposure, and improve investment returns. For example, a fund manager may buy put options to protect investments during uncertain market conditions. Their trading strategies are usually more disciplined and data-driven compared to individual investors.
Institutional Swing Option TradingInstitutional Investors such as banks, hedge funds, mutual funds, and insurance companies play a major role in the financial markets. Institutional trading refers to large-scale buying and selling of securities by these organizations. Because institutions trade in huge volumes, their actions can strongly influence stock prices and market trends. They often use advanced research, algorithms, and risk-management systems to make trading decisions.
Advanced Intraday TradingOptions Trading is a type of financial trading where investors buy or sell contracts that give them the right, but not the obligation, to purchase or sell an asset at a fixed price before a specific date. Traders use options to earn profits, hedge risks, or speculate on market movements. Common strategies include call options, put options, straddles, and spreads. Options trading can provide high returns, but it also carries significant risk because prices can change rapidly due to market volatility.
NIFTY- Intraday Levels :- 1st June 2026 NIFTY sustain above 23923/40/57 above this bullish then around 23974/83/92 above this more bullish then above this wait more levels marked on chart.
If NIFTY sustain below 23859/47/39/31 below this bearish then around 23815/03 then 23733/03 or 23686/56 below this more bearish then 23405/23385 below this wait more levels marked on chart
Consider some buffer points in above levels.
Please do your due diligence before trading or investment.
**Disclaimer -
I am not a SEBI registered analyst or advisor. I does not represent or endorse the accuracy or reliability of any information, conversation, or content. Stock trading is inherently risky and the users agree to assume complete and full responsibility for the outcomes of all trading decisions that they make, including but not limited to loss of capital. None of these communications should be construed as an offer to buy or sell securities, nor advice to do so. The users understands and acknowledges that there is a very high risk involved in trading securities. By using this information, the user agrees that use of this information is entirely at their own risk.
Thank you.
Apple Stays Bullish but Pullback Risk Is RisingAAPL continues trending strongly higher on H4 after rallying from the 245–250 zone toward 312.
Price remains far above both EMAs, with the short-term EMA around 298–300 acting as key support. While the broader structure stays bullish, the current extension also increases the risk of short-term pullbacks.
Strong earnings, positive revenue expectations, and large buyback programs continue supporting Apple fundamentally.
Trade Plan
Buy setup: wait for a pullback toward 305–300. If buyers defend this zone clearly, targets are 318–320.
Continuation target: if momentum remains strong, the next upside zone becomes 325.
Avoid chasing longs directly near highs because price is already extended away from EMA support.
Invalidation: clear H4 breakdown below 300 weakens short-term bullish momentum.
AUD/USD Moves Within a Consolidation RangeAUD/USD moved within a range-bound consolidation zone during Friday's trading session.
Despite struggling to capitalize on the previous day's strong rebound from levels below 0.7100, the spot price managed to maintain its position above 0.7150.
If this stability holds until the close of the New York session, the Aussie is poised to record a modest weekly gain for the first time in three weeks.
------------------------------------------------------------------------------------------------
✅ Fundamental Dynamics: The Tug-of-War of the Truce vs. RBA Domestic Sentiment
Global capital flows have been mixed in response to geopolitical developments and the latest inflation data:
- 🔸PCE Inflation Blast Wall: However, the Aussie's room for further upside is being constrained by macro data. Yesterday's US PCE release, which surged to 3.8% YoY, confirmed the fastest inflation rate in three years. This has kept the market skeptical of a complete de-escalation and locked bets on a 25-bps Fed rate hike in 2026 at around 50%.
- 🔸RBA Cools: Domestically, Australia's diminishing speculation that the Reserve Bank of Australia (RBA) will raise interest rates at its June meeting has discounted the AUD's strength, forcing the pair to move sideways.
------------------------------------------------------------------------------------------------
✅ Technical Analysis: Testing the Upper Limit of the Consolidation Corridor
Technically, AUD/USD has been trapped within the same consolidation corridor for nearly two weeks. Technical indicators show signs of buyer accumulation but remain tentative:
- 🔸RSI (Near 56): Moving slightly above the midline, indicating gradual daily constructive momentum without risk of overbought.
- 🔸Key Resistance (0.7180 - 0.7185): A close above this area would open a fast path to the structural swing high at 0.7279.
- 🔸Nearest Support (0.7109): The 38.2% Fibonacci retracement level. This support must be maintained to keep the weekly recovery structure alive.
GBPUSD Struggles Below Major EMA ZoneGBPUSD is attempting to recover on H4 after the strong decline from 1.3600, but price still remains below the larger EMA resistance near 1.3450–1.3460.
The rebound from 1.3380 has slowed, suggesting the current move still looks more like a corrective bounce rather than a confirmed bullish reversal.
Trade Plan
Buy setup: only consider longs if GBPUSD breaks and holds above 1.3465. Targets are 1.3500 and 1.3520.
Sell setup: if price rejects again from 1.3450–1.3460, targets are 1.3400 and 1.3380.
Continuation sell: if 1.3380 breaks, the next downside zone becomes 1.3350.
Invalidation: strong H4 close above 1.3465.
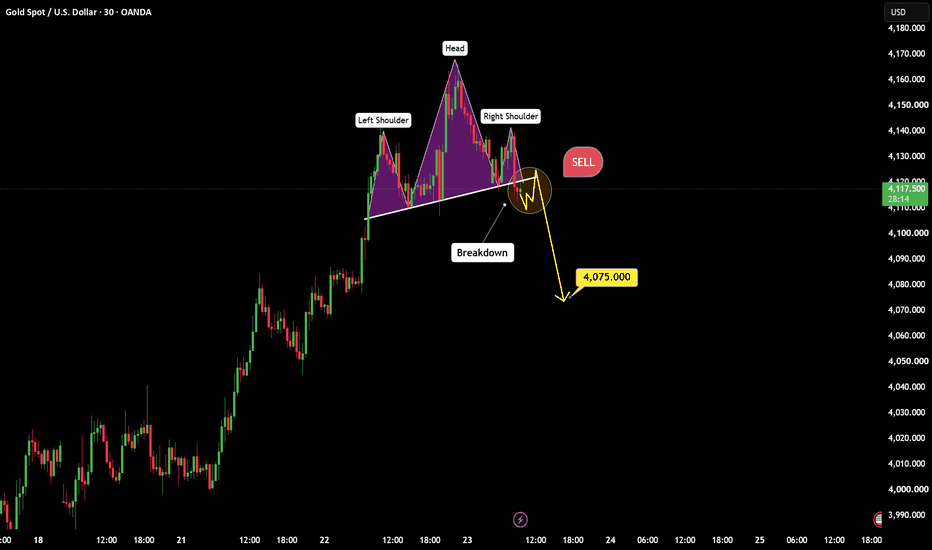
Gold Reclaims 4,500 After Strong ReversalGold reacted strongly after sweeping liquidity below 4,400 and rebounding from the 4,360–4,380 area.
Price has now reclaimed 4,490–4,500 and is trading near the short-term EMA, showing improving short-term momentum. However, the larger EMA around 4,550–4,560 still acts as major resistance, while the broader H4 structure remains bearish overall.
Trade Plan
Buy setup: wait for a pullback toward 4,490–4,500. If buyers defend this area clearly, targets are 4,530 and 4,550.
Continuation buy: if gold breaks and holds above 4,550, the next upside zone becomes 4,575–4,590.
Sell setup: if price rejects strongly from 4,530–4,550, the rebound may weaken and sellers could retest lower liquidity again.
Invalidation: clear H4 breakdown back below 4,490.
Stop Counting Pips. Start Measuring Real ProfitStop Measuring Your Trading Performance in Percentages or Pips
Most traders track their performance the wrong way. They obsess over pip counts, celebrate percentage returns, and compare account balances. None of that tells you whether you are actually trading well. Today I want to show you a better way to measure your results, one that professional traders and prop firms actually use.
This article is written for shorter-term traders who typically hold one to three positions at a time. If you manage a diversified stock portfolio or a hedge fund with dozens of assets, this may not apply directly to you. But if you are a retail trader managing your own account, read this carefully because it will change how you look at your performance.
Why Percentages and Pips Are Misleading
Here is the problem with measuring returns in percentages. A 100% return on a $500 account means you made $500. A 20% return on a $50,000 account means you made $10,000. Which trader performed better? The percentage says the first one. The reality says the second one.
Percentages look impressive on paper but they do not reflect the actual skill or risk involved in making those returns.
Pips have the same problem. A trader risking 50 pips to make 20 pips is performing very differently from a trader risking 10 pips to make 30 pips, even if both made the same number of pips in total. The pip count alone tells you nothing meaningful.
Every trader has a different account size, a different risk tolerance, and a different position sizing approach. Comparing performance using percentages or pips between two different traders is like comparing apples to oranges. It does not work.
The Right Way to Measure Performance: R
The most accurate and useful way to track your trading performance is through something called R, which stands for your risk to reward ratio across all your trades.
R is simply your total profits divided by your total losses over a series of trades.
If you made $100,000 in a year but lost $50,000, your R value is 2. That means for every dollar you lost, you made two dollars back. A 3R track record means you made three dollars for every dollar lost.
This number is what actually matters. It tells you whether your strategy is working, whether your risk management is sound, and whether you are making more than you are losing in a way that is sustainable over time.
Here is a real example using 20 trades with fixed risk:
Trade 01: +3R (Winner)
Trade 02: -1R (Loser)
Trade 03: -1R (Loser)
Trade 04: -1R (Loser)
Trade 05: +3R (Winner)
Trade 06: +3R (Winner)
Trade 07: -1R (Loser)
Trade 08: -1R (Loser)
Trade 09: +5R (Winner)
Trade 10: +4R (Winner)
Trade 11: +2R (Winner)
Trade 12: -1R (Loser)
Trade 13: -1R (Loser)
Trade 14: -1R (Loser)
Trade 15: +3R (Winner)
Trade 16: +6R (Winner)
Trade 17: -1R (Loser)
Trade 18: -1R (Loser)
Trade 19: -1R (Loser)
Trade 20: +4R (Winner)
Total Wins: 33R
Total Losses: 11R
Overall R: 3R (33 divided by 11 = 3)
Notice something important in that example. Out of 20 trades, 11 were losers and only 9 were winners. That means this trader lost on 55% of their trades and still came out with a 3R overall result. This is exactly why win rate alone means nothing. What matters is how much you make when you are right compared to how much you lose when you are wrong.
Account Size Does Not Tell the Full Story
Here is something most traders do not think about. Due to leverage, a trader with $1,000 in their account can trade a similar position size to a trader with $20,000 in their account. Account balance is not a reliable indicator of how much risk someone is taking or how skilled they are.
You do not need a large account balance to trade meaningful size. You need a clear understanding of your risk per trade.
For this reason, keeping all your trading capital in one account makes very little sense. Most of it can sit in a separate savings or investment account earning interest while you only keep what you need to trade your desired position size. The account balance your broker sees is not a reflection of your overall financial position or your trading ability.
Risk Tolerance Is Personal
One trader might be comfortable risking $200 per trade. Another might risk $2,000. Neither is right or wrong as long as it fits within their personal financial situation and does not affect their ability to make clear decisions.
A simple rule to check if you are risking too much: if your open trades are keeping you awake at night, your position size is too large.
Risk tolerance grows naturally as your skills and track record develop. A beginner should start small and build confidence over time. An experienced trader with a proven edge can reasonably increase their risk per trade as their results justify it. But that confidence has to be earned through a track record, not assumed.
What Prop Firms Actually Look At
If you ever want to trade someone else's capital or attract outside funding, understanding R becomes even more critical. Prop trading firms do not care about your pip count or your percentage return in isolation. They look at your return relative to the risk you took to achieve it.
A prop trader only gets paid when their R value is above 1. Anything below 1 means they lost more than they made, regardless of how many pips they caught.
Banks, hedge funds, and prop firms all measure performance this way. They want to see that you are generating returns efficiently relative to the risk you are accepting. A long track record showing a consistent R value of 2 or 3 is far more impressive to a serious investor than a flashy percentage return achieved by risking too much on one trade.
One Important Warning
Understanding R does not mean you should start risking more per trade. That would completely miss the point. R is a measurement tool, not a license to increase your position size recklessly.
The goal is to keep your risk fixed and consistent so that your R value accurately reflects your trading edge over time.
If your risk changes from trade to trade, your R number becomes meaningless because you cannot compare the results fairly. Fix your risk, track your R, and let the results show you whether your strategy is actually working.
Final Thought
Stop chasing pip counts. Stop getting excited about percentage returns that look good on paper but mean very little in reality. Start measuring what actually matters, how much you make relative to how much you risk, consistently, over a large series of trades.
A trader with a 3R track record over 100 trades has proven something real. A trader with a 200% return on a $300 account has proven very little.
Track your R. Build your edge. Let the results speak for themselves.
Thank you for reading. I hope this article helped you better understand market behavior, trading psychology, and risk management during volatile conditions.
For more trading education, chart analysis, and market insights, follow:
@Trade-Technique on @TradingView
Intraday AnalysisOption Chain Analysis: Decoding Open Interest (OI) to find where the "Big Players" are positioned.
FII/DII Data: Understanding institutional activity and its impact on market direction.
Intraday Strategies: Scalping and swing setups using Price Action and key EMAs.
Global Market Cues: How GIFT Nifty and US Markets might influence our opening.
Institution Option Trading Part-2PCR (Put-Call Ratio) – Institutional Trading Strategy
What is PCR?
PCR = Put OI ÷ Call OI
It shows market sentiment of big players in indices like NIFTY 50.
Institutional Psychology
2. How Big Players Use PCR
Retail buys options randomly
Institutions control PCR zones to trap traders
👉 You follow PCR = You follow smart money
📈 PCR Levels (Game Changer)
3. Key Zones
PCR < 0.7 → Bearish sentiment (too many Calls) → ⚠️ Reversal possible
PCR 0.7 – 1 → Neutral zone
PCR > 1.2 → Bullish sentiment (too many Puts) → ⚠️ Reversal possible
👉 Extreme PCR = Trap zone (Institutional move coming)
Institution Option Trading Part-1PCR means Put Call Ratio
It tells us how many Put options and Call options people are buying or trading.
Why it matters for institution trading
Big players mostly use options. So PCR helps us understand what big money may be thinking.
If PCR is high
More puts than calls.
Means traders are scared or taking protection.
Sometimes big players expect weakness.
If PCR is low
More calls than puts.
Means confidence in upside.
Sometimes market is bullish.
Why learn this
Price only shows movement.
PCR shows mindset behind movement.
Institutions think different
Retail people chase candles.
Institutions manage risk first.
$ETH Down 20% From My FVG Level - Here My Next PlanCRYPTOCAP:ETH Down 20% From My FVG Level. Here Is Exactly Where I Am Buying For $10K-$15K Target
ETH/USDT Playing Out Exactly As Called
ETH rejected clean off the FVG at the $2400-$2600 zone, just like I mapped out. Price is now down nearly 20% from that level and sitting back below $2000.
Structure stays bearish until we reclaim $3050. No reason to fight that.
Here Is My Game Plan From Here:
Price needs to hold $1750 to keep the bullish long term case alive. My first entry is already filled in the $1750-$1800 range, and honestly that is my best long term entry in my view.
If $1750 breaks, I am not panicking. I am ready to gift myself buys below $1500. Accumulation Zone 2 sits at $1500-$1400, a massive discount for long term holders.
Long Term Targets Unchanged: $10,000 | $15,000 | $20,000
If you are a real long term player you already understand what this dip is telling you. This is where accumulation for the next cycle begins.
I genuinely do not see anything on the chart that says ETH goes below $1000. So the $2000 down to $1400 range is your window to accumulate slowly for serious returns down the line.
In my view ETH prints a new ATH in 2026-2027. The next 19 months could be huge.
This is my own analysis. Not Financial Advice. ALWAYS DYOR
Hindalco TechnicalImportant Support Levels
1100–1090 → Immediate support zone
1070–1055 → Strong demand zone
1035 → Positional support
1000 → Major trend support
Resistance Levels
1120–1135 → Near resistance
1150 → Breakout confirmation zone
1180–1200 → Next swing target if breakout sustains
Trading Scenarios
Above 1120 with strong closing → momentum can extend toward 1150–1180
If price slips below 1090, expect pullback toward 1070–1055
Below 1050 trend momentum may weaken short term
USD/CAD Strengthens Quite Well for the Medium TermUSD/CAD recorded significant gains for the third consecutive day, successfully building momentum following a breakout of the critical resistance barrier in the 1.3810-1.3815 range.
The spot price surged to the 1.3870 region during the Asian session, marking a new high since April 13th, supported by the overall strength of the US Dollar (USD) in the foreign exchange market.
---------------------------------------------------------------------------------------------
✅ Fundamental Dynamics: USD Safe-Haven Effect Breaks CAD Correlation
Historically, rising crude oil prices strengthen the Canadian Dollar (CAD) as a commodity currency. However, current market dynamics indicate a very bullish anomaly for USD/CAD:
- Shattered Diplomatic Hopes: Reports of new US military airstrikes inside Iran and President Donald Trump's rejection of draft peace terms have dashed hopes for a diplomatic solution to the Gulf War, which is entering its third month.
- Expectations of a Double US Rate Hike: Although crude oil rebounded modestly from a three-week low, its impact on the CAD was significantly outweighed by the strengthening US Dollar.
---------------------------------------------------------------------------------------------
✅ Technical Analysis: Constructive Bullish Structure in Overbought Area
Technically, USD/CAD's success in recording a strong daily close confirms the transition of the medium-term trend to a pure bullish one:
- Key Resistance (1.3875): A breakout of this level will trigger a more pronounced continuation of the uptrend towards the 1.3963 area.
- Key Support Anchor (1.3810): The intersection of the 200-day SMA and the 61.8% Fibonacci level. As long as USD/CAD remains above this horizontal level, the bullish structure is deemed secure and intact.
S&P 500 Holds Bullish Structure Near HighsThe S&P 500 continues trending higher on H4 with a clean higher-high and higher-low structure. Price remains above both EMAs and is trading near 7,520.
The EMA support zone around 7,430–7,380 remains very important. As long as buyers defend this area, the bullish trend stays intact.
However, price is already stretched away from the EMAs, increasing the risk of short-term pullbacks and volatility.
Gold XAUUSD Faces High Selling PressureGold prices (XAU/USD) faced massive selling pressure in midweek trading.
The apparent ceasefire optimism was shattered after the US military launched new airstrikes inside Iran, while President Donald Trump openly rejected the current draft peace deal.
-----------------------------------------------------------------
✅ Geopolitics: New Crossfire in Iran & Trump's Rejection of the Deal
The diplomatic de-escalation scenario is officially over, replaced by increased direct military activity in the Gulf:
- 🔸New US Airstrikes: A US official confirmed to Reuters that the United States military launched new airstrikes inside Iran on Wednesday. The operation targeted strategic military sites deemed to threaten the safety of US troops and commercial shipping lanes.
- 🔸Drone Interception: US forces on the ground reportedly intercepted and shot down several Iranian combat drones detected approaching the commercial maritime zone of the Strait of Hormuz.
- 🔸Trump Rejects Peace Terms: Market sentiment was hit hard after President Donald Trump stated that he was dissatisfied with the terms of the interim negotiations with Iran. Trump asserted that he would not rush to sign a deal, dashing hopes for a diplomatic solution to the war, which has entered its third month.
----------------------------------------------------------------
Technically, the structure of the gold daily chart shows complete bear dominance:
- 🔸Least Resistance Path: Down. The rise to the $4,580 area earlier this week proved to be a bull trap as the entire upward gap has been filled.
- 🔸Critical Floor ($4,350): The late-March low is once again a major daily downside target. If this level is broken cleanly in tonight's New York session, gold will trigger further technical selling towards deeper macro support areas.
- 🔸Super Catalyst North American Session: All major market players are refraining from long-term daily bets ahead of tonight's super-important macroeconomic data releases: the Q1 Preliminary GDP report and the key inflation indicator, the Personal Consumption Expenditures (PCE) Price Index. A strong PCE figure would immediately lock in gold's decline.