Bitcoin Printed Liquidity-Sweep Lower High. Here's My $50K Plan Bitcoin Just Printed A Liquidity-Sweep Lower High. Here's My $50,000 Roadmap
Bitcoin Just Tapped Premium And Got Rejected.
Here's What The Chart Is Telling Me:
→ Price swept the $83K FVG + Ascending channel top
→ Stamped a clean LH right into the Bearish OB zone
→ Daily closes are now back inside the channel = weakness confirmed
→ HTF bias stays bearish until we reclaim $97,900 (ChoCh level)
Two Scenarios I'm Watching:
1️⃣ Bullish Invalidation: Daily close above $83K opens the door to Bearish OB 2 at $89K-$92K. That's the last supply before $97,900 ChoCh.
2️⃣ Base Case (Bearish): Rejection holds → channel breakdown → liquidity grab below $59,809 BOS → downside target $50,000.
The structure is screaming distribution. Lower High printed, premium tapped, no follow-through buying.
Smart Money doesn't chase. They wait for the sweep.
I'm sitting on hands until either $85K reclaim or $60K sweep prints. No middle ground trades here.
Patience pays. FOMO bleeds.
TA Only. Not Financial Advice. ALWAYS DYOR.
Harmonic Patterns
$XTZ ALERT: The 5,500% Potential Setup Nobody Is Watching CRYPTOCAP:XTZ ALERT: The 5,500% Potential Setup Nobody Is Watching
Tezos Crashed -96% from its $9.17 ATH.
The Setup:
➡️ Accumulation Zone: $0.20 - $0.16
➡️ Current Price: ~$0.34
➡️ Trigger: Weekly Close Above $0.6418
➡️ Invalidation: Below $0.17
Bull Cycle Targets: $0.6418 | $1.30 | $4 | $10
Potential Upside: 5,500%
Bearish structure still intact short-term. Patience over hype. Position gradually, not emotionally.
The best trades are the ones nobody is talking about.
TA Only. Not Financial Advice. ALWAYS DYOR
My Honest Take on $HYPE - Read Before You LongFamily, let me share my personal view on GETTEX:HYPE right now because I am seeing too much euphoria around it.
Where We Are
▪️ Price pumped from $20 bottom to $62+ (already 3x from cycle low in Just 4 Months)
▪️ Listed on NYSE & NASDAQ ETFs ( 21Shares ETF - NASDAQ:THYP & Bitwise ETF - AMEX:BHYP )
▪️ ETF inflows: $74.91M in just 8 trading days since launch
▪️ Everyone on CT is suddenly a "HYPE Maxi"
Why I am Cautious Short Term
✅ Classic "Buy the Rumour, Sell the News" setup is playing out. ETF hype is now priced in.
✅ Forming a potential Double Top near previous ATH zone (~$60). HTF structure is screaming caution.
✅ Risk-Reward on longs at current price is poor. You are buying at resistance, not at value.
✅ Most retail entering now with high leverage are exit liquidity for smart money who accumulated near the $20-22 Re-Accumulation Zone.
My View
I am NOT saying HYPE cannot pump higher. Long term, $150-$200 is very much on the table given fundamentals and ETF demand.
But short term swing traders chasing greens at ATH with 20x-50x leverage? That is not trading, that is gambling.
Smart money buys fear. Retail buys hype. Don't confuse the two.
What I Would Do
▪️ Wait for healthy retracement to $40-$35 (previous breakout zone)
▪️ Strong Re-Accumulation Zone: $30-$20 (best DCA zone if we get there)
▪️ Invalidation for bullish thesis: Loss of $20
Discipline > FOMO. Always.
TA Only. Not Financial Advice. ALWAYS DYOR.
AARTI INDUSTRIES LTD. – Long-Term Technical Breakout Setup📈 AARTI INDUSTRIES LTD. – Long-Term Technical Breakout Setup
Aarti Industries is showing signs of a potential long-term reversal after almost a 2-year consolidation and retest zone near the major support area.
🔹 Key Observation:
• Price has taken support around the ₹310–₹350 zone multiple times
• Falling trendline breakout attempt visible on the higher timeframe
• Strong accumulation zone formed after a prolonged correction
• Momentum building near an important resistance breakout area
🎯 Resistance / Target Levels:
• Resistance 1: ₹454
• Resistance 2: ₹476
• Resistance 3: ₹604
• Resistance 4: ₹674
• Resistance 5: ₹763
• Resistance 6: ₹952
• Final Long-Term Target: ₹1022
📌 Fundamental View:
Aarti Industries Ltd. is one of India’s leading specialty chemical manufacturers with strong presence in pharma, agrochemicals, polymers, dyes, and custom synthesis businesses.
✅ Strong long-term demand outlook in specialty chemicals
✅ Focus on export-driven growth and value-added products
✅ Capacity expansion plans underway
✅ Improving operational efficiency and margin recovery expected
✅ Strong relationships with global clients across multiple sectors
Recent quarterly commentary also indicates management’s confidence in long-term growth with improving EBITDA visibility over the coming years.
⚠️ Disclaimer:
This is only for educational and informational purposes. Please do your own research before investing or trading.
#AartiIndustries #StocksToWatch #IndianStockMarket #TradingView #BreakoutStocks #SwingTrading #Investing #ChemicalSector
Shilpa medicare..beast mode on for 20-30% gain Momentum setupShilpa Medicare is currently trading near ₹490 after delivering a strong breakout above the ₹420–430 resistance zone. The stock has formed a clean Stage-2 uptrend with higher highs and higher lows, while sustaining above its key moving averages. Price action now indicates institutional-style accumulation, with strong acceptance above the previous value area instead of immediate rejection.
Fundamentally, FY26 was the company’s strongest year yet with revenue reaching ₹1,549 crore, EBITDA touching a record ₹445 crore, and Adjusted PAT surging 135% to ₹232 crore. Management also guided for margin recovery toward 9.5–11% from 8.7% in Q3, supported by Oncology API demand and CDMO growth visibility. The recent Latin America biosimilar licensing deal further strengthens the long-term growth narrative.
Technically, the breakout structure remains healthy as buyers repeatedly defended the ₹470–480 region. Volume profile shows heavy accumulation near ₹410–430, while momentum expansion above ₹500 could trigger another leg higher. Relative strength versus the pharma sector has also improved significantly over the past few weeks, which is usually a bullish sign for swing continuation.
As long as the stock sustains above ₹470, the probability of continuation toward ₹560, ₹590, and potentially ₹620 over the next 6–8 weeks remains strong. Compared to highly speculative pharma names, Shilpa currently offers a better balance of earnings quality, technical structure, and momentum sustainability for a potential 20–30% swing setup.
XAUUSD: The Most Important Candle Is Not the Breakout CandleOne of the most common mistakes in trading gold is reacting too quickly to a large candle.
When traders see a strong bullish candle breaking above resistance, many immediately assume that a new uptrend has started. When they see a strong bearish candle breaking below support, many quickly conclude that the market is about to drop much deeper.
But with XAUUSD, a large candle is not always a reliable signal.
Sometimes, it represents real market strength. But many times, it is only a liquidity sweep, a stop-loss trigger, or a short-term price push designed to pull retail traders into the wrong position.
That is why the most important candle is not the breakout candle.
The most important candle is the candle that comes right after the breakout.
The breakout candle shows that the market has just made a strong move. But the next candle reveals whether that move is actually accepted by the market.
This is a major difference.
A strong bullish candle breaking above resistance may look attractive at first. It creates the feeling that buyers are fully in control. But if the next candle fails to continue higher, the candle body becomes smaller, a long upper wick appears, and price falls back below the breakout zone, it suggests that the previous buying pressure may have been absorbed.
In other words, the market did not accept the new price level above resistance.
At that point, the breakout may not be the beginning of a real bullish trend. It may simply be a buy-side liquidity sweep, where buy stop orders are triggered and sellers’ stop-losses are cleared before price reverses.
The same logic applies to the downside.
A strong bearish candle breaking below support may cause many traders to sell into the breakdown. But if the next candle fails to continue lower, price rejects strongly from below and returns back inside the previous support area, that breakdown may only be a sell-side liquidity sweep.
This is why many traders lose money even when their initial market direction is correct.
They are not wrong for noticing the breakout.
They are wrong because they enter before the market confirms that the breakout is real.
With gold, fast movement and large candle ranges can easily create a sense of urgency. Traders fear missing the move, so they enter as soon as they see a strong candle. But that FOMO often turns them into liquidity for the market.
A real breakout usually does not rely on just one beautiful candle. It needs continuation.
After breaking above resistance, price needs to hold above the breakout zone. The next candle should not immediately cancel out the previous bullish move. If there is a retest, the old resistance should act as new support. Buyers need to defend the new price area instead of allowing price to fall back into the previous range.
A real breakdown requires similar confirmation.
After breaking below support, price needs to stay below the broken zone. The next candle should show that buyers cannot push price back up. If price retests the old support, that area should act as new resistance. Sellers need to maintain pressure instead of allowing the market to recover immediately.
That is why the candle after the breakout is more important than the breakout candle itself.
It shows how the market is responding to the breakout.
If the candle after the breakout continues in the same direction, closes strongly, and does not get rejected aggressively, that is a sign of follow-through. When follow-through appears, the breakout has a higher probability of being real.
But if the candle after the breakout immediately weakens, forms a strong rejection wick, or closes back inside the previous zone, that is a sign of rejection. When rejection appears, the breakout may only be a trap.
New traders are often attracted by the strong candle. Experienced traders focus on the market reaction after that strong candle.
This is a very important principle, especially with XAUUSD.
Gold does not lack large candles. What gold often lacks is confirmation after those candles.
A large candle can be created by news.
A large candle can be created by stop-losses being swept.
A large candle can be created by thin liquidity.
A large candle can simply be a short-term emotional reaction from the market.
But the continuation after that candle is what shows whether real money is actually supporting the move.
If, after a strong bullish candle, the market continues to form higher lows, holds the breakout zone, and does not give back most of the move, that is a sign that buyers are truly in control.
If, after a strong bearish candle, the market continues to form lower highs, fails to return above the broken zone, and keeps getting sold on pullbacks, that is a sign that sellers truly have the advantage.
On the other hand, if a strong candle is rejected immediately, traders should be careful. When a strong move appears but fails to produce a meaningful result, it often means the opposite side is absorbing the pressure very well.
In price action, a large candle does not automatically mean strength.
A large candle is truly powerful only when it changes market structure or is confirmed by the price action that follows.
Without follow-through, a large candle is only noise.
This is an important lesson when trading gold: do not let the size of a candle deceive you. What matters is not how big the candle is, but whether the market continues in that direction after it appears.
A disciplined trader does not rush into a trade just because they see a breakout.
They wait for the next candle.
They observe the reaction.
They check whether price can hold the new zone.
They see whether the breakout has follow-through or gets rejected.
They allow the market to confirm itself before taking action.
In XAUUSD, being one candle slower can sometimes help traders avoid many bad entries.
A trader may miss a small part of the first move, but in return, they can avoid buying the exact top of a liquidity sweep or selling the exact bottom of a fake breakdown.
Trading is not a competition to see who enters the fastest.
Trading is the process of waiting for the right signal, at the right price area, with the right confirmation.
So when gold creates a very strong breakout candle, the key is not to react immediately. The key is to watch the next candle and see whether the breakout is confirmed or rejected.
With XAUUSD, sometimes the answer is not found in the candle that attracts the most attention, but in the candle that comes right after it.
22nd May 2026 — Nifty Report — Another Flattish WeekNifty Stance Slightly Bullish
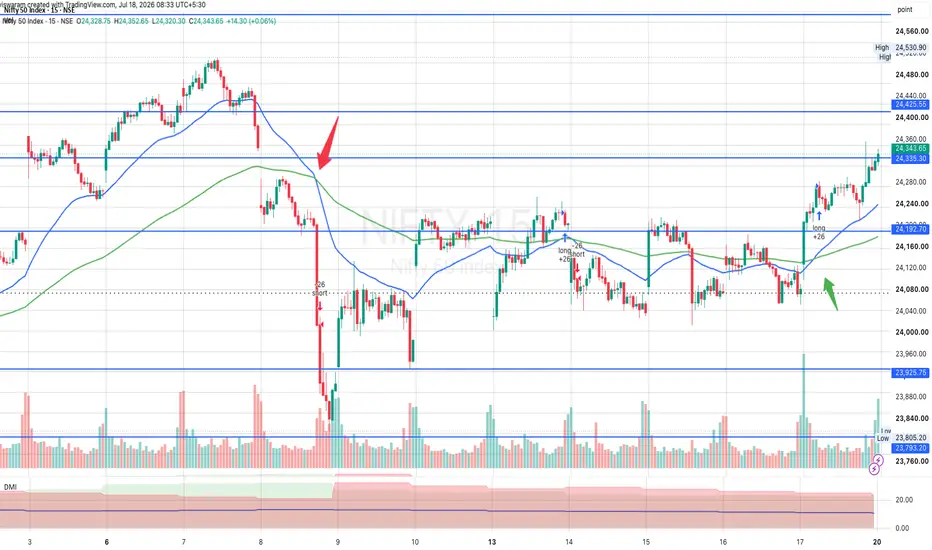
Nifty’s range-bound journey continues. Nifty was trapped between the support 23793 and the resistance 24335 for 33 days, i.e. 8th April to 11th May. And for the last 11 days, it has been stuck between support at 23357 and resistance at 23793. Like every consolidation, this one would break as well, but it would require a strong trigger.
This week started with a gap-down opening on 18th May, right at the support level of 23357, which was followed by a strong retracement for a flattish close. Tuesday, we started flat, but gave away gains in the afternoon. On Wednesday, we tried to retest the 23357 support again, but we closed strong. Thursday, we opened above the resistance level of 23793, but we gave up all those gains. On Friday, we tried to break through the resistance of 23793 again, but failed. Overall, we only managed to gain 75pts (~ 0.32%) this week. The zig-zag movement, but with no real gains or losses is indicative of a flattish market.
If you look at the chart, you can see multiple crossovers between the blue and green EMAs (3 this week). Since the ADX 1D timeframe remains below 20 pts, our stance is flattish with a minor bullish bias.
Important Things to Watch for the Next Week
Results of the following major companies are expected over the next week. NTPC, Divis Labs, JK Cement, ABB Power, ONGC, Cummins, Ashok Leyland, and Asian Paints.
We are expecting the Industrial Production data, FX reserves, and Federal Fiscal Deficit (March).
25th May 2026 is a holiday for the US market due to Memorial Day. Other global events to watch out for are: CB Consumer Confidence (US), ECB Financial Stability Review (Euro), Core Personal Consumption Expenditure (PCE) Index (US), Q1 GDP (US), Initial Jobless claims, and Chicago PMI (US).
28th May 2026 is a holiday for Bakri Id, and the Sensex expiry will be on Wednesday, 27th May.
If Nifty starts falling, the important support levels are 23357, 22781 and 22519. If Nifty starts rallying, the important resistance levels are 23793, 23925, and 24192.
We expect next week’s trading to be totally dependent on the US-Iran peace deal; until then, the range-bound trade may continue.
Meanwhile, the USDINR hit an all-time high of 96.96 on Wednesday and has since cooled off by 1.32%. This was after the RBI stepped in to sell USD at massive volumes. Speculations of an interim rate hike were also doing the rounds.
This is how the Indian Rupee has performed against the Pakistani Rupee since 3rd July 2025. Our currency has depreciated by 12.05% against the US dollar, whereas the PKR has appreciated by 1.98%. The Indian currency is underperforming the Pakistani currency by ~ 14%.
Note: The technical analysis indicator mentioned above is for educational purposes only and not a guarantee that the trade could end up in profits. Investments in the securities market are subject to market risks, including the potential loss of principal. Past performance does not guarantee future results. Information provided is for educational purposes only and should not be considered financial advice. Investors should read all related documents carefully and consult a certified advisor before investing. Registration granted by SEBI and Enlistment with RAASB/BSE and certification from NISM in no way guarantee performance of the intermediary or provide any assurance of returns to investors. The investor is requested to take into consideration all the risk factors before actually trading in stocks or derivatives. The SEBI RIA license INA000021757 is for Balachandran RV
NIFTY- Intraday Levels :- 25th May 2026 NIFTY sustain above 23779 above this bullish then 23816/31/46 thnen28863/93 then around 23951 above this more bullish above this wait more levels marked on chart.
If NIFTY sustain below 23711 then 23690/64 below this bearish then 23643 then around 23618/12 below this more bearish below this wait more levels marked on chart
My view :-
"My viewpoint, offered purely for analytical consideration, The trading thesis is: Nifty (bullish tactical approach: buy on dip)
This analysis is highly speculative and is not guaranteed to be accurate; therefore, the implementation of stringent risk controls is non-negotiable for mitigating trade risk."
Consider some buffer points in above levels.
Please do your due diligence before trading or investment.
**Disclaimer -
I am not a SEBI registered analyst or advisor. I does not represent or endorse the accuracy or reliability of any information, conversation, or content. Stock trading is inherently risky and the users agree to assume complete and full responsibility for the outcomes of all trading decisions that they make, including but not limited to loss of capital. None of these communications should be construed as an offer to buy or sell securities, nor advice to do so. The users understands and acknowledges that there is a very high risk involved in trading securities. By using this information, the user agrees that use of this information is entirely at their own risk.
Thank you.
Gold Testing A Major Breakout ZoneGold is currently forming a bullish inverse head & shoulders structure while testing the neckline resistance area.
📊 Key level to watch:
• Hourly close above 4534 could confirm the breakout and strengthen bullish momentum.
As long as price holds above the rising trend support, buyers may continue attempting a push higher.
Traders are now watching for:
• Breakout confirmation above resistance
• Momentum strength after the breakout
• Volume reaction near key levels
$WLD Down 98% From ATH: Is This The Setup For A Generational Ent#WLD Is Trading Deep Inside A Macro Descending Channel, Sitting In A High-Risk Accumulation Zone After A Brutal ~98% Drawdown From Its ATH. Price Is Now Pressing Against A Critical Accumulation vs Invalidation Level.
Technical Structure
✅ Cycle ATH: $11.97 (Macro Top)
✅ Macro Drawdown: -98% Into Current Range
✅ Multi-Year Descending Channel With Clean Lower Highs And Lower Lows
✅ HTF Accumulation Zone: $0.26 To $0.18
✅ Price Compressing Near Channel Support (Possible Base Forming)
✅ Repeated Rejections From Dynamic Trendline Resistance
✅ No Confirmed Bullish Break Of Structure Yet
✅ Bullish Shift Only Valid On Reclaim And Hold Above $0.66
✅ Invalidation: Weekly Close Below $0.135
Cycle Context
➡️ Expansion Phase: Vertical Rally To $12 ATH
➡️ Distribution Phase: Continuous Lower High Formation
➡️ 2024 To 2026: Two-Year Corrective Accumulation Range
➡️ Descending Trendline Still Acting As Heavy Supply
Key Levels
👉 HTF Demand Zone: $0.26 To $0.17
👉 Breakdown Trigger: Weekly Close Below $0.135
👉 Trend Reclaim: $0.66 (Channel Breakout Confirmation)
Bull Cycle Targets: $0.63 | $2 | $5 | $10+
The $0.26 To $0.17 Region Is A High-Risk HTF Accumulation Zone For EURONEXT:WLD Ahead Of A Potential Long-Term Expansion Phase. Patience Over Prediction. Structure Over Hype.
TA Only. Not Financial Advice. ALWAYS DYOR.
Gold Price Faces Bearish Pressure – XAU/USD SELL SetupXAU/USD SELL Signal Analysis
Pair: XAU/USD (Gold)
Timeframe: M30
Bias: Bearish Short-Term
The chart shows gold moving inside an ascending channel, but price is struggling to maintain bullish momentum near the upper resistance zone around 4570 – 4580. Repeated rejection from this area suggests sellers are still controlling the market.
The large bearish projection indicates a possible breakdown toward the lower demand/support zone near 4450 – 4470. Current structure also shows lower highs forming after the recent rejection, increasing the probability of downside continuation.
Key Levels
Resistance: 4570 – 4580
Current Price: 4519
Support Target: 4470 – 4450
Trade Idea
SELL Entry: 4520 – 4530
Take Profit 1: 4470
Take Profit 2: 4450
Stop Loss: 4585
…
GBPUSD Recovery Still Looks FragileGBPUSD is attempting to recover after the sharp breakdown in mid-May, but the rebound still looks weak overall.
On the H4 chart, EMA34 has crossed below EMA89 and both moving averages continue trending downward, confirming that the medium-term bearish structure remains dominant.
Recent upward moves look more like technical pullbacks, with weak volume and repeated rejections around EMA34 — a pattern often seen before trend continuation.
At the same time, the US dollar continues attracting strong capital flows due to high Treasury yields and expectations that the Fed will keep rates elevated for longer.
Meanwhile, GBP still lacks a strong catalyst capable of shifting momentum clearly against the USD.
Trading Option Analysis With Education and Logic PCR means Put Call Ratio
It tells us how many Put options and Call options people are buying or trading.
Why it matters for institution trading
Big players mostly use options. So PCR helps us understand what big money may be thinking.
If PCR is high
More puts than calls.
Means traders are scared or taking protection.
Sometimes big players expect weakness.
If PCR is low
More calls than puts.
Means confidence in upside.
Sometimes market is bullish.
Gold, May 22 | Firmly Adhering to a Bullish Strategy🔥 Gold, May 22 | Firmly Adhering to a Bullish Strategy
Hello everyone, today we bring you a real-time gold analysis, focusing on a bullish strategy and seizing the rebound opportunity in the key 4500-4650 range.
Currently, gold prices are around $4516. Although there may be some short-term volatility, the support is very solid, with the $4500 level being a crucial bottom support for the bulls.
The overall market is exhibiting a narrow range-bound trading structure, indicating that the market is accumulating funds on a large scale, rather than showing weakness.
Gold prices have presented multiple buying opportunities within the $4500-4530 range, and bullish momentum is gradually building, with the next rebound expected to unfold rapidly.
In terms of news, gold prices continue to be strongly supported by three factors.
First, global central banks continue to increase their gold reserves, and the scarcity of hard currency makes gold a core asset for international financial security.
Second, the continued weakening of the US dollar index and the dovish stance of the Federal Reserve provide strong upward momentum for gold.
Finally, persistent geopolitical risks and rising market risk aversion also provide external impetus for the bulls. Based on technical and fundamental analysis, our strategy today is clear: only go long.
As long as gold prices remain above $4500, the bullish structure remains valid. A pullback to around $4500 is the optimal entry point, with target prices at $4550, $4600, and even $4620.
Once gold prices break through $4530, the bullish trend will be confirmed, attracting more funds and driving a strong short-term rebound.
Buy: $4510-$4520
Stop Loss: $4475
Target Price: $4550-$4600-$4620+
Short-term volatility is a signal of accumulation; large funds are gathering strength to prepare for the next round of upward movement.
Retail investors should not be misled by market fluctuations. Focus on the key support level of $4500; the bullish direction is clear, and substantial profits can be obtained in the upcoming rebound. Holding above 4500 and breaking through 4530 will be key to initiating the next round of gains.
Today's gold market is full of opportunities. We remain bullish and plan to buy on dips, closely monitor key price levels, and follow the trend.
NIFTY- Intraday Levels :- 22nd May 2026 NIFTY sustain above 23711 above this bullish then 23754/71 then 23816/31/46 above this more bullish then 23898/913/28/43/58 above this wait more levels marked on chart.
If NIFTY sustain below 23643 below this bearish then 23512/452 below this more bearish then 23372/313 below this wait more levels marked on chart
My view :-
"My viewpoint, offered purely for analytical consideration, The trading thesis is: Nifty (bearish tactical approach: sell on rise)
This analysis is highly speculative and is not guaranteed to be accurate; therefore, the implementation of stringent risk controls is non-negotiable for mitigating trade risk."
Consider some buffer points in above levels.
Please do your due diligence before trading or investment.
**Disclaimer -
I am not a SEBI registered analyst or advisor. I does not represent or endorse the accuracy or reliability of any information, conversation, or content. Stock trading is inherently risky and the users agree to assume complete and full responsibility for the outcomes of all trading decisions that they make, including but not limited to loss of capital. None of these communications should be construed as an offer to buy or sell securities, nor advice to do so. The users understands and acknowledges that there is a very high risk involved in trading securities. By using this information, the user agrees that use of this information is entirely at their own risk.
Thank you.
XAUUSD Sell Setup | Range Breakout & Resistance RejectionGold is showing a clear bearish structure after rejecting from the resistance zone around 4545–4555. Price attempted a breakout but failed to hold above resistance, creating a possible fakeout move before continuation lower.
Current market structure still favors sellers as lower highs and weak bullish momentum are visible on the chart. If price stays below the marked supply zone, we can expect another downside move toward the 4490 support area.
📉 Trade Idea:
🔴 Sell Zone: 4540 – 4555
🛑 Stop Loss: 4570
🎯 Target 1: 4510
🎯 Target 2: 4493
🎯 Target 3: 4470
📊 Analysis:
Resistance rejection from supply zone
Bearish breakout structure remains valid
Weak retracement after impulsive drop
Sellers still controlling momentum
⚠️ Manage risk properly and wait for confirmation before entry.
Indonesia's JCI Has the Potential to Weaken FurtherThe sharp correction that hit the Indonesia Stock Exchange (IDX) on Thursday morning, May 21, 2026, reflected an extreme idiosyncratic shock.
The Jakarta Composite Index (JCI) plunged 136 points, or 2.2%, to 6,185, extending its downward trend to eight consecutive sessions and plunging the index to its lowest level in 13 months.
Positive sentiment from the overnight Wall Street rally and external stability (WTI oil falling to $99 and the DXY to 99.0) failed to provide a cushion for the JCI.
Institutional and foreign investors opted for mass capital flight in direct response to the drastic changes in Indonesia's upstream commodity trading policy architecture.
-----------------------------------------------------------------
✅ State-Owned Enterprises' Commodity Export Monopoly: The Main Trigger for the Parabolic Correction
President Prabowo's policy of tightening export regulations for strategic commodities, including crude palm oil (CPO), coal, and ferroalloys, by requiring all shipments to go through a single state-owned exporter (SOE), has been a major blow to private issuers.
- Short-Term Margin Disruption: The market views this policy as reducing the free trade flexibility of private companies, increasing bureaucratic risks, and potentially cutting producers' net profit margins due to the new intermediary cost structure.
- Mass Selloff: Shares of upstream commodity conglomerates were immediately hit by the automatic rejection threshold (Auto Reject Lower/ARB), led by Barito Pacific (BRPT) which plunged 9.9%, Medco Energi (MEDC) which plunged 8.7%, Darma Henwa (DEHA) which fell 7.7%, and copper-gold giant Amman Mineral Internasional (AMMN) which fell 5.7%.
-----------------------------------------------------------------
✅ Bank Indonesia Interest Rate Surge to 5.25%
To protect the Rupiah exchange rate, which continues to hit new record lows since April due to the impact of the closing of the Strait of Hormuz (Week 12), Bank Indonesia (BI) executed aggressive measures:
BI Rate Increased 50 bps to 5.25%: This emergency measure on Wednesday succeeded in temporarily stemming the Rupiah's decline. However, for the stock market, a 50 bps interest rate hike in a single meeting is toxic to equity valuations.
This measure immediately raised corporate borrowing costs (cost of funds), suppressed upstream credit growth, and triggered a sharp correction in the debt-heavy transportation, energy, and industrial sectors.
USDINR = 300 by 2047I have done data back analysis and what i have found is no matter what happens, INR depreciates @ 2 % per annum in the best year, 5 to 7 in mid and 10 15% per annum in worst year
using the linear regression model, USDINR shall be 160 by 2037
but my brain i can probably say with 80% conviction USDINR with 250
using the same, by 2047 USDINR shall be around 200 or 300++
Institution Option Trading Part-3PCR means Put-Call Ratio
It compares how many Put options are traded versus Call options.
Simple formula: Put Volume ÷ Call Volume.
This helps understand market mood.
Institutions use options heavily
Big players like banks, hedge funds, mutual funds often use options for hedging and positioning.
So PCR can give clues about what smart money may be doing.
Shows fear vs confidence
High PCR = More puts than calls = Fear, protection, bearish mood.
Low PCR = More calls than puts = Confidence, bullish mood.
Institutions often buy protection before market falls.