Log vs Linear: Why Your "Broken" Support Never Actually BrokeLog vs Linear: Why Your "Broken" Support Never Actually Broke
LOG vs LINEAR: THE ADVANCED BREAKDOWN
(Premium Edition - for traders who actually draw levels for a living)
Most people treat this as a cosmetic toggle. It isn't. Your scale choice silently changes your trendlines, your Fibs, your moving averages, and your backtest results. Here's the deep version. 👇
🔰 THE CORE MATH:
🔹 Linear scale: equal vertical distance = equal absolute price change (Δ$).
🔹 Log scale: equal vertical distance = equal proportional change (Δ ln P).
On a log chart, a straight line is not constant price growth, it is constant percentage growth. A rising straight line on log = compounding at a fixed rate. That single fact is why log is the natural home for any asset with exponential history.
Crypto is the most exponential asset class in existence. CRYPTOCAP:BTC has moved roughly 8 orders of magnitude. Displaying that on linear is a rendering error, not analysis.
🔰 WHERE LOG IS NON-NEGOTIABLE
✔️ HTF structure - Weekly, Monthly, and multi-cycle views
✔️ Long-term trendlines and channels (semi-log channels only)
✔️ Power law / log regression bands, rainbow models, diminishing returns curves
✔️ Cycle-to-cycle comparison: 2013 vs 2017 vs 2021 vs 2024–25 tops
✔️ Ratio charts (ETH/BTC, TOTAL2/BTC.D, alt/BTC pairs): ratios are inherently multiplicative
✔️ Any asset with 10x+ range on screen: majors, low-caps, memecoins
✔️ Comparative performance overlays between two assets with different price magnitudes
⚠️ The Trap: a multi-year trendline that reads as a clean breakdown on linear is frequently untouched on log. Every cycle, a chunk of the market capitulates into a support that never actually broke. Check the log view before you post a breakdown call.
🔰 WHERE LINEAR IS THE CORRECT TOOL
✔️ Execution timeframes: 1m through 4H
✔️ Order Blocks, FVGs, breaker blocks, liquidity pools, equal highs/lows
✔️ Precise entry, invalidation, and R:R measurement
✔️ Range-bound and compressed price action
✔️ Anything where your position sizing is denominated in absolute dollar risk
✔️ Volume profile, VWAP, market profile studies
Rationale: within a narrow range, ln(P) is approximately linear, the two scales converge and linear gives you cleaner, more auditable measurement.
🔰 THE PART ALMOST NOBODY TALKS ABOUT
1️⃣ Fibonacci levels change:
A 0.618 retracement on linear is not the same price as a 0.618 on log. Log Fibs compute the retracement in percentage space. On a 5x impulse the difference between the two can be double-digit percentages. If you swing trade off Fibs across large moves, you must decide which one is your system and never switch mid-analysis.
2️⃣ Moving averages are linear objects:
An SMA/EMA is computed on price, not on log-price. So on a log chart the MA is still a linear-space calculation being rendered in log space. It is not "wrong," but do not treat an MA slope on log as a growth-rate line the way you would a semi-log trendline.
3️⃣ Pattern geometry warps:
Wedges, triangles, and channels are geometric shapes. Change the scale, change the geometry. A "rising wedge" on linear can render as a clean parallel channel on log. Both readings cannot be right. Choose your reference frame first, then read the pattern.
4️⃣ Volatility is proportional, not absolute:
Crypto returns are far closer to log-normal than normal. Your risk model should think in percentage terms (ATR%, standard deviation of log returns), not raw dollar swings. Log charting is the visual expression of the same idea.
5️⃣ Backtests inherit the scale:
If you draw your levels on log and backtest on linear, you are testing a different strategy than the one you traded. Reproducibility dies here.
🔰 THE OPERATING FRAMEWORK
➡️ LOG for BIAS: cycle position, HTF trend, long-term structure, ratio analysis, valuation models
➡️ LINEAR for EXECUTION: LTF structure, entries, stops, targets, sizing
Zoom out in log space. Zoom in in linear space. Never let the two contaminate each other in a single thesis.
🔰 THE DISCIPLINE RULE:
A trendline drawn on log and a trendline drawn on linear are two different objects. So are the Fibs, the channels, and the patterns built on them.
Therefore:
→ Declare your scale before you draw
→ Keep it fixed across the entire analysis
→ Label the scale on every chart you publish
→ If your level only holds on one scale, that is information, say so out loud
Analysts who don't state their scale are not publishing a level. They are publishing a picture.
🔰 CryptoPatel Note: Log is the true coordinate system of an exponential asset. Linear is the coordinate system of a trade. Professionals use both and they never confuse which one they are standing in.
Save this one.  Long
Long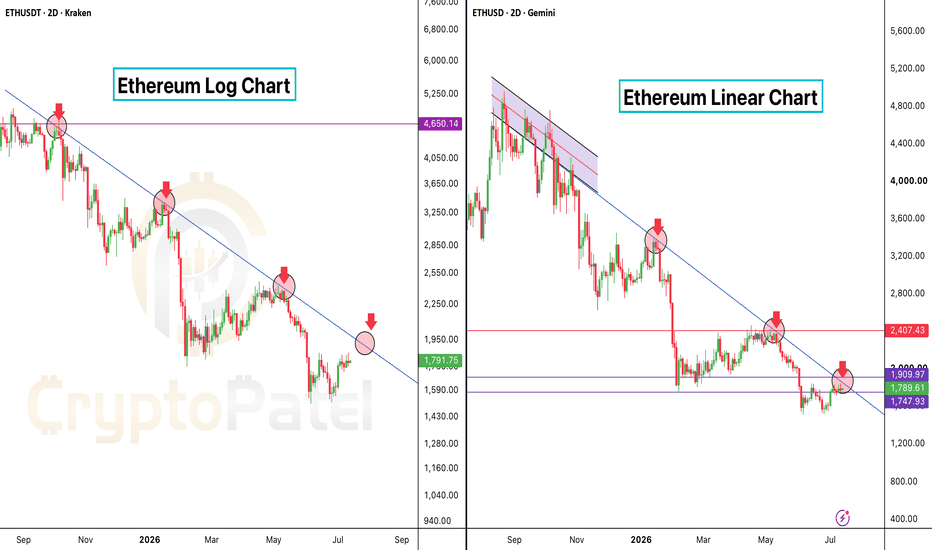
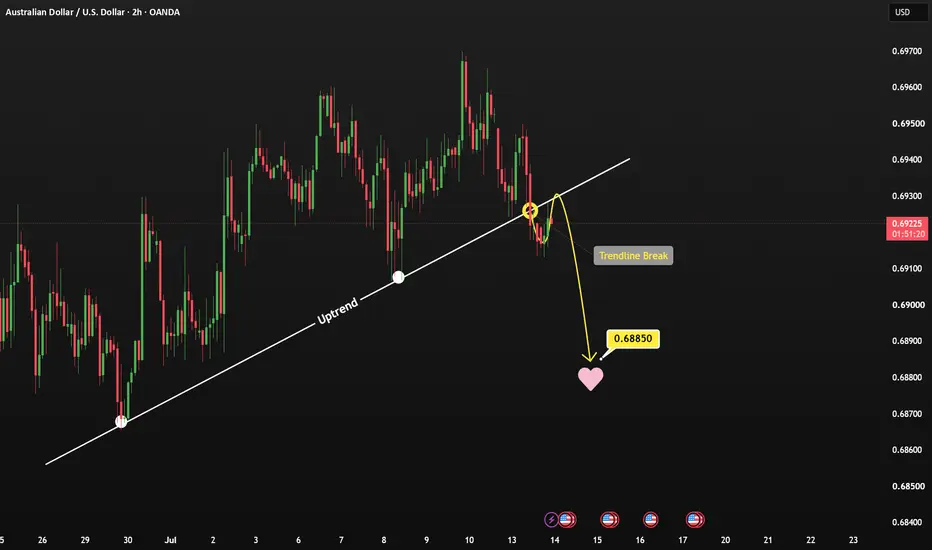
AUDUSD LONG Although the price action on AUD/USD isn't particularly clear, the pair is still trading above the 50 EMA on the weekly timeframe. Over the past two weeks, we've also seen strong bullish rejections, suggesting that buyers are still defending lower prices.
The 10 EMA and 20 EMA are converging, which indicates slowing momentum, but there's still a reasonable possibility that price could break above the previous week's high.
PDH is cleared.
On the 4-hour timeframe, after the recent rejection, I can identify a good Fibonacci setup. Price has closed above the 61.8% retracement of the last bullish impulse, which adds confluence for a potential long position.
My plan is to look for a long entry and target the previous week's high, with the possibility of extending the target slightly beyond it if momentum continues.
That said, this isn't a perfect setup. There is still a chance that price could break below the previous week's low. Additionally, the 4-hour break of structure isn't very convincing since it was only a wick break rather than a candle close above the level.
Overall, this isn't an A+ setup, but it's a valid trade idea with enough confluence to keep on my watchlist.
 Long
Long
XAUUSD 4023 retest — 3972 still calling XAUUSD 4023 retest — 3972 still calling
That bounce back above 4,000 looks nice for a second.
But yeah. I’m not buying the whole story yet.
Gold dumped hard from the 4,100 zone, broke the short-term channel, then kept sliding under the EMA stack. That is pressure. No need to overcomplicate it.
The small recovery from 3,990 is just a reaction from the low for now. Price is still trading below 4,023, below 4,052, below 4,074, and under the bigger 4,088 area. That whole EMA cluster is sitting above price like a ceiling.
Macro also isn’t clean for bulls. USD only paused after a strong run. Oil and inflation worries are still around. Fed expectations still lean heavy. So gold gets a bounce, sure. But upside looks capped unless buyers reclaim structure properly.
Main bias stays bearish while price holds below 4,052 - 4,074.
The zone I’m watching is 4,023 first. If gold retests there and fails, sellers can hit it again. Below 4,000, the next draw is the discount zone around 3,972 - 3,962. That area makes sense for the next liquidity grab.
Trading scenario:
Sell idea only if price rejects 4,023 - 4,052 or breaks back below 4,000 with clean pressure.
Entry zone: 4,023 - 4,052 after rejection
Alternative entry: below 4,000 after breakdown confirmation
Stop loss: above 4,074
TP1: 4,000
TP2: 3,988
TP3: 3,972 - 3,962
No rejection, no chase.
If gold closes back above 4,074 and holds, this short idea gets messy. Above 4,088, sellers lose control for now.
Until then, this still looks like a weak bounce into resistance.
You selling the retest, or waiting for 4,000 to snap again?
 Short
Short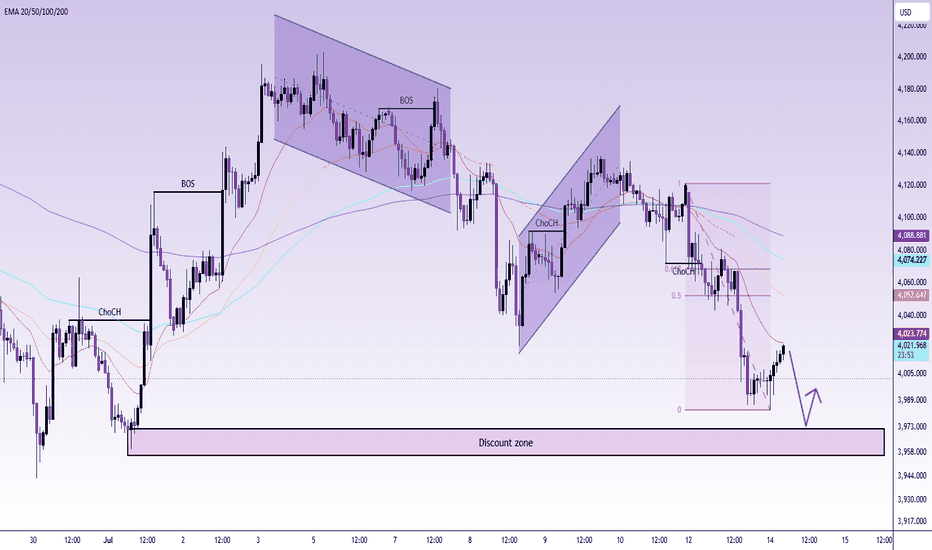
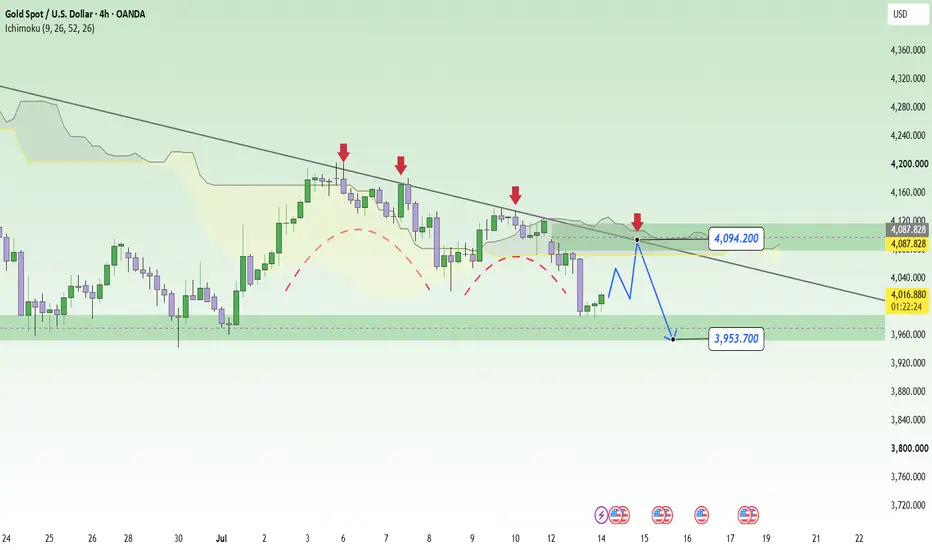
XAUUSD: Bearish Trendline Continues to Cap Recovery MomentumXAUUSD has bounced off the support zone around 3,960–3,980, but the current rebound is insufficient to alter the bearish structure on the H4 timeframe. Prices remain below the descending trendline—which has repeatedly triggered selling pressure—while the area above is further reinforced by the Ichimoku Cloud and a resistance zone around 4,087–4,094.
Notably, recent highs have been progressively lower. Whenever gold approaches the bearish trendline, buying momentum quickly fades and sellers step back in. This suggests the current rally is likely just a technical rebound following the sharp decline, rather than a confirmed reversal signal.
On the macroeconomic front, gold remains under pressure from the US dollar and US bond yields, which are holding at elevated levels ahead of inflation data. Rising oil prices have also fueled concerns that the Fed may need to maintain a hawkish monetary policy for longer, thereby increasing the opportunity cost of holding gold.
If the price rallies to the 4,087–4,094 range but fails to secure a firm close above the bearish trendline, selling pressure could drive XAUUSD back toward the 3,953.7 level. This is a critical support level and a clear downside target on the chart.
Suggested Strategy: Sell around 4,087–4,094 upon signs of rejection; Take Profit (TP) at 3,953.7; invalidate the trade if the price closes above 4,110 on the H4 timeframe. Short 
Short 
XAUUSD: Long-term trend line continues to exert pressureFollowing a brief rebound late last week, XAUUSD once again approached the downtrend line extending from late June but failed to achieve a breakout. Prices quickly reversed and are currently hovering just above the short-term support zone around 4,058, indicating cautious buying sentiment ahead of a series of key US economic data releases this week.
Fundamentally, the market favors holding the USD as US bond yields remain elevated and investors await the CPI report and fresh signals from the Federal Reserve. Reuters also notes that the dollar continues to be supported by expectations that interest rates will remain higher for longer, prompting a temporary shift of capital away from non-yielding assets like gold.
On the H4 timeframe, the price remains below the downtrend line and has yet to clear the 4,058–4,080 resistance zone. This area also represents an Ichimoku convergence point, raising the likelihood of another rejection. Should selling pressure persist in this zone, XAUUSD could break through the nearest support level and extend its decline toward the 3,965 area.
Entry: Sell around 4,058–4,080 upon a rejection signal.
TP: 3,965
SL: Above 4,100 Short 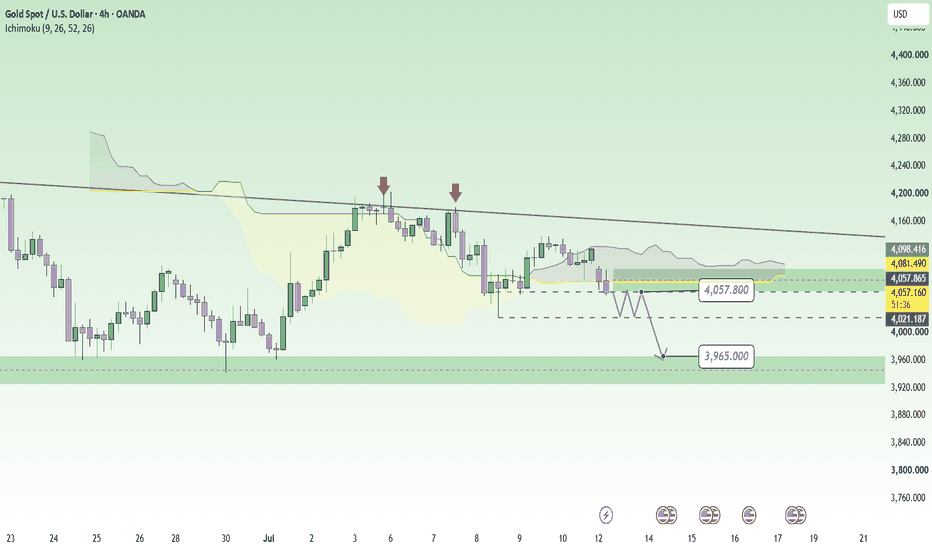
 Long
Long
 Education

 Education

Education

 Education

 Long
Long
Education

Education

Shriram FinanceSupport Zones
₹1,035–1,040 – Immediate support
₹1,010–1,020 – Strong buying zone
₹980–990 – Positional support
Resistance Zones
₹1,065–1,075 – Immediate resistance
₹1,095–1,110 – Breakout zone / 52-week resistance
Technical View
✅ Trend: Bullish
✅ RSI: Around 59, indicating positive momentum without being extremely overbought.
✅ Price is above the 20, 50, 100, and 200 DMA, supporting the broader uptrend.
Trading Plan
Buy on dips: ₹1,020–1,035
Stop-loss: ₹995 (positional)
Upside Targets:
Target 1: ₹1,075
Target 2: ₹1,110
Target 3: ₹1,160 (if a strong breakout above ₹1,110 occurs)
A sustained close above ₹1,110 could signal continuation toward fresh highs, while a break below ₹1,020 would weaken the short-term bullish setup. Punjab National BankCurrent Technical Trend
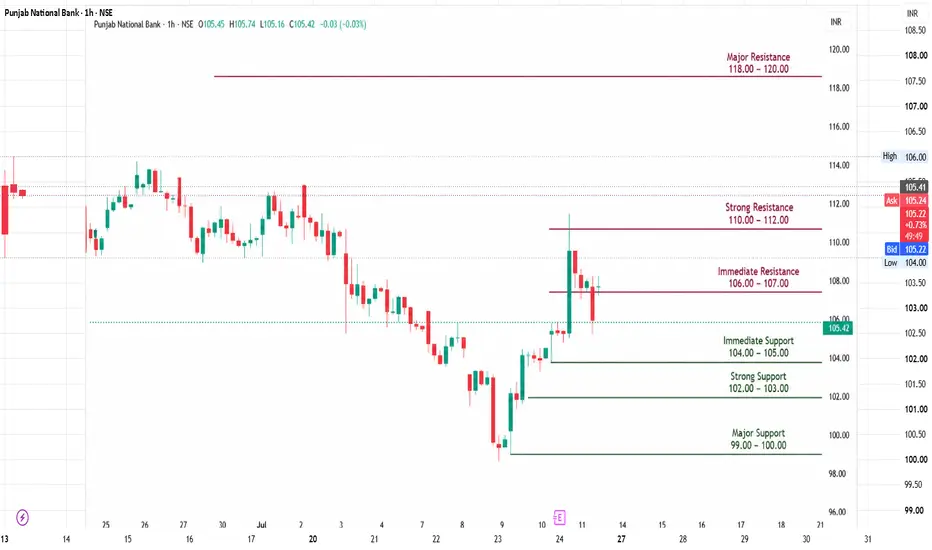
The stock is trading around ₹105–106.
The short- to medium-term trend remains weak to neutral, with price below several important moving averages. RSI is around 42–46, indicating weak momentum but not deeply oversold.
Key Support Levels
₹104–105: Immediate support.
₹102–103: Strong support zone.
₹99–100: Major support. A break below this could increase selling pressure.
Key Resistance Levels
₹106–107: Immediate resistance.
₹110–112: Strong resistance zone.
₹118–120: Major breakout level for a stronger uptrend.
Trading Strategy
Bullish scenario: A sustained close above ₹107–108 with strong volumes could lead to a move toward ₹112–118.
Bearish scenario: If the stock falls below ₹102, it may test the ₹99–100 support area.
Fundamental View
PNB's recent quarterly business update showed healthy growth in advances and overall business, although the share price weakened after the announcement, suggesting that short-term market sentiment remains cautious.
Overall view:
Short-term: Neutral to slightly bearish.
Medium-term: Wait for a breakout above ₹107–108 before expecting stronger upside.
Long-term: The banking sector remains fundamentally supported, but confirmation through price action is important.
If you're holding PNB, tell me:
your buy price,
quantity, and
whether you're a trader or long-term investor,
and I'll suggest suitable stop-loss and target levels. IndusInd BankTechnical Levels
Immediate Support: ₹1,000–1,005
Strong Support: ₹980–990
Major Support: ₹950–960
Immediate Resistance: ₹1,030–1,040
Major Resistance: ₹1,070–1,100
Bullish Target (if ₹1,040 is crossed with volume): ₹1,100–1,150
Technical View
The stock has reclaimed the psychologically important ₹1,000 level with improving volumes, which is a positive sign.
As long as it holds above ₹1,000, the short-term trend remains bullish.
A decisive close above ₹1,040 could trigger another upward move toward ₹1,100–1,150.
A fall below ₹980 may weaken the momentum and could lead to a retest of the ₹950–960 zone.
Trading Strategy
For swing traders: Consider buying on dips near ₹1,000–990, with a stop-loss below ₹975.
For existing holders: Continue holding while the stock remains above ₹1,000. Consider partial profit booking near ₹1,090–1,120 if momentum slows.

 Long
Long