HDFC Bank Technical AnalysisKey Support Levels
₹812–815 – Immediate support
₹807–810 – Strong buying zone
₹800–802 – Major positional support
Key Resistance Levels
₹823–825 – Immediate resistance
₹828–833 – Breakout zone
₹840–845 – Next upside target after breakout
These levels align with multiple technical analyses and current moving average/resistance zones.
Trading Scenarios
Bullish Scenario
Sustained move above ₹825–828 with volume can trigger momentum toward:
₹840
₹850+
Bearish Scenario
A close below ₹812 may lead to:
₹807
₹800
₹793 if selling intensifies
Swing Trading View (1–2 Weeks)
Trend: Bullish above ₹812
Preferred strategy: Buy on dips near support rather than chasing rallies.
Stop-loss: Below ₹800 for swing positions.
Targets: ₹833 → ₹840 → ₹850
Momentum Outlook
Price remains above important moving averages and technical indicators continue to favor buyers, although resistance near ₹828–833 could lead to short-term consolidation before the next move.
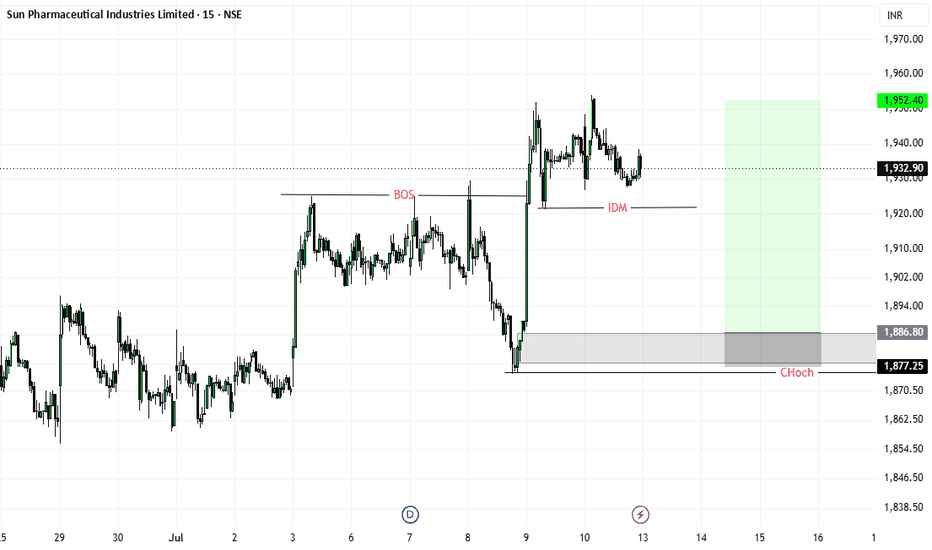
Harmonic Patterns
XAUUSD / GOLD – 1H Buy Limit Projection
Key Levels
Buy Zone: 4038–4041
Stop Loss: Below 4027
TP1: 4055
TP2: 4066
Final Target: 4080
Setup Explanation
Price has already broken the ascending trendline, so the short-term bearish correction may continue.
Price could fall toward the 4038–4041 strong demand zone, sweep the sell-side liquidity around 4035, and then produce a bullish reversal.
A strong rejection or lower-timeframe bullish CHoCH near 4040 would provide better confirmation for the buy setup.
Trade Management
Take partial profit around 4055.
After TP1, move the stop loss to breakeven or trail it into profit.
4066 is an important Fibonacci resistance level.
If bullish momentum remains strong, the final target is 4080.
The setup becomes invalid if an H1 candle closes below 4027.
⚠️ Avoid chasing a buy at the current market price. Wait for price to enter the buy zone and show clear bullish confirmation.
Educational analysis only. Always use proper risk management
NIFTY- Intraday Levels :- 13th July 2026 NIFTY sustain above 24229 above this bullish then 24289/296/310 above this more bullish above this wait more level are marked on chart
If NIFTY sustain below 23182/168154/149 below this bearish 24126/108/ below 24200/090 or 24070/24040 below this more bearish below this wait more levels marked on chart
My view :-
"My viewpoint, offered purely for analytical consideration, The trading thesis is: Nifty (bullish tactical approach: buy on dip)
This analysis is highly speculative and is not guaranteed to be accurate; therefore, the implementation of stringent risk controls is non-negotiable for mitigating trade risk."
Consider some buffer points in above levels.
Please do your due diligence before trading or investment.
**Disclaimer -
I am not a SEBI registered analyst or advisor. I does not represent or endorse the accuracy or reliability of any information, conversation, or content. Stock trading is inherently risky and the users agree to assume complete and full responsibility for the outcomes of all trading decisions that they make, including but not limited to loss of capital. None of these communications should be construed as an offer to buy or sell securities, nor advice to do so. The users understands and acknowledges that there is a very high risk involved in trading securities. By using this information, the user agrees that use of this information is entirely at their own risk.
Thank you.
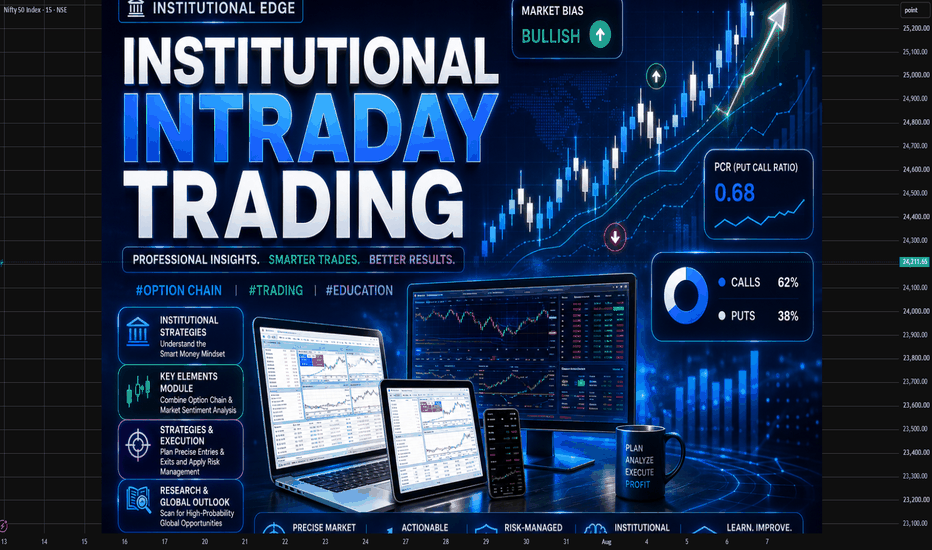
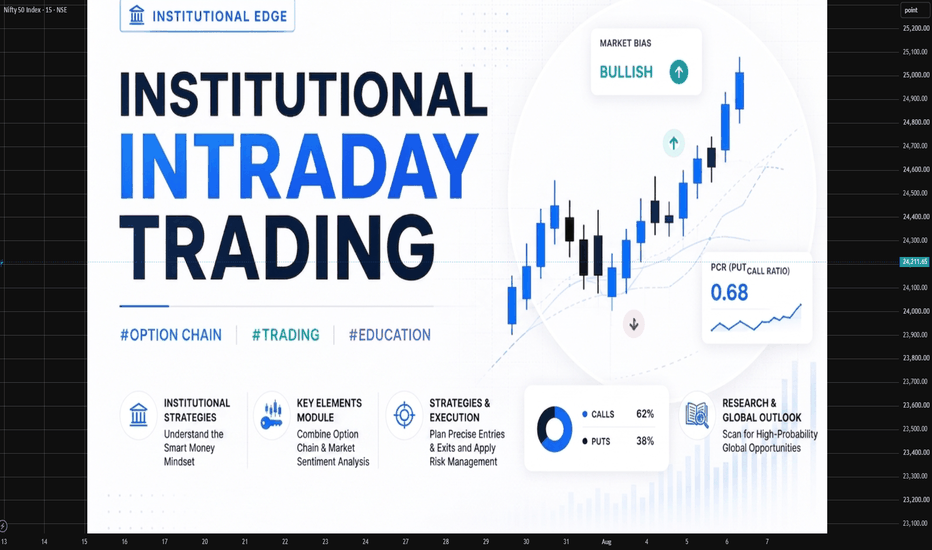
Institution Option Trading PCR (Put-Call Ratio) – Institutional Trading Strategy
What is PCR?
PCR = Put OI ÷ Call OI
It shows market sentiment of big players in indices like NIFTY 50.
Institutional Psychology
2. How Big Players Use PCR
Retail buys options randomly
Institutions control PCR zones to trap traders
👉 You follow PCR = You follow smart money
📈 PCR Levels (Game Changer)
3. Key Zones
PCR < 0.7 → Bearish sentiment (too many Calls) → ⚠️ Reversal possible
PCR 0.7 – 1 → Neutral zone
PCR > 1.2 → Bullish sentiment (too many Puts) → ⚠️ Reversal possible
👉 Extreme PCR = Trap zone (Institutional move coming)
Intrday AnalysisOption Chain Analysis: Decoding Open Interest (OI) to find where the "Big Players" are positioned.
FII/DII Data: Understanding institutional activity and its impact on market direction.
Intraday Strategies: Scalping and swing setups using Price Action and key EMAs.
Global Market Cues: How GIFT Nifty and US Markets might influence our opening.
Oversold MarketsWhat is overbought?
When the market goes up too much, too fast — like it got overexcited. RSI crosses above 70. This means most people who wanted to buy have already bought. Not many buyers left. So the market will likely slow down or fall a bit.
What you do: don't buy now. If you're already in profit, book some of it. Keep your stop loss tight.
What is oversold?
When the market falls too much, too fast — like everyone panicked and sold everything. RSI drops below 30. Most of the panic selling is already done. So a bounce or recovery is likely coming.
What you do: don't rush in all at once. Wait for one green candle or a volume pickup as confirmation. Then buy in small parts.
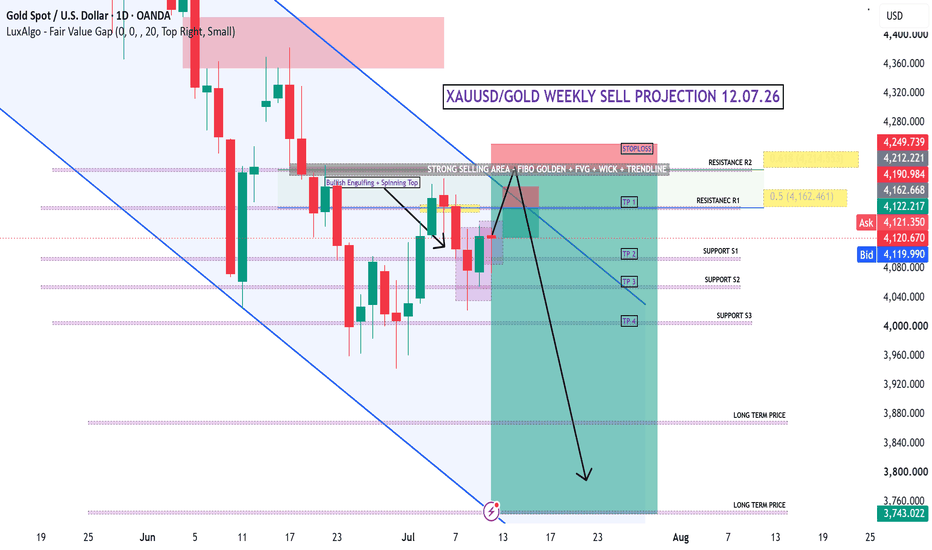
XAUUSD/GOLD WEEKLY SELL PROJECTION 12.07.26XAUUSD / GOLD Weekly Sell Projection Explanation
The chart shows a bearish weekly outlook, but it expects gold to make a temporary upward retracement before the larger decline.
Main selling zone: 4,190–4,215
This area is considered a strong resistance zone because several technical factors meet there:
0.50 Fibonacci level near 4,162
0.618 Fibonacci level near 4,215
Previous wick rejection and supply area
Fair Value Gap (FVG)
Descending trendline resistance
The bullish engulfing candle and spinning-top formation suggest that gold may first recover toward this resistance zone. A bearish rejection candle from 4,190–4,215 would provide stronger confirmation for the sell setup.
Trade levels shown on the chart
Potential sell zone: 4,190–4,215
Stop-loss: Above 4,249–4,250
TP1: Around 4,162
TP2: Around 4,085–4,095
TP3: Around 4,045–4,055
TP4: Around 4,000
Long-term targets: Approximately 3,870 and 3,743
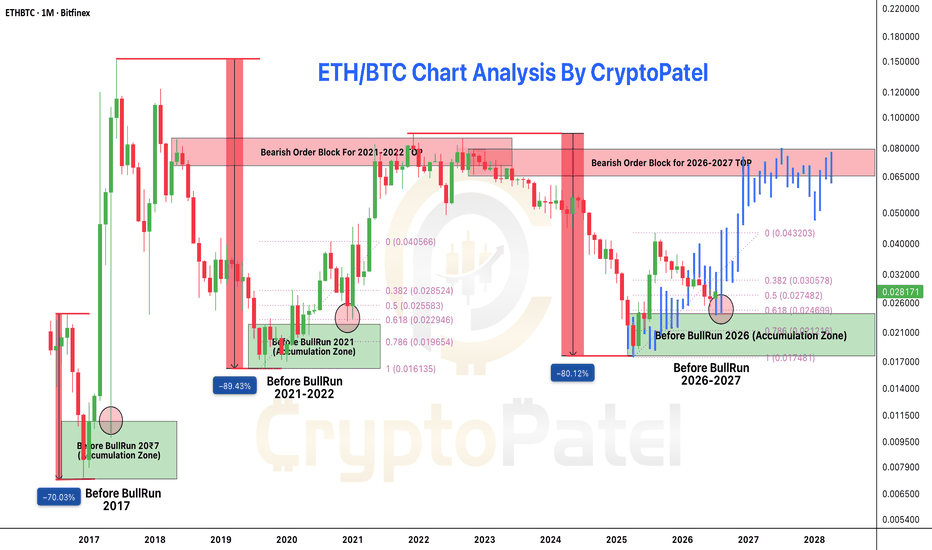
ETH/BTC Will Decide When Altseason Starts: Must Read for AltsznETH/BTC Will Decide When Altseason Starts, And The Chart Just Made Its Move
Most traders are focused on BTC/USD and ETH/USD.
Very few are watching the chart that has historically signaled when Ethereum is ready to outperform Bitcoin.
Here's What Stands Out:
🔹 Another ~80% macro correction: Nearly identical to previous cycles.
🔹 Price is holding the historical Accumulation zone.
🔹 Strong reaction from 0.618–0.786 FIB Golden Pocket.
🔹 Higher lows are beginning to form, suggesting accumulation rather than distribution.
The only major obstacle left is the 0.065–0.080 ETH/BTC macro Bearish Order Block.
A confirmed breakout above this zone would be a significant technical signal that ETH could enter its next phase of relative strength against BTC.
History doesn't repeat perfectly... but the structure is looking surprisingly familiar.
What's your ETH/BTC target for this cycle? 👇
❤️ Like if you found this analysis valuable.
🔁 Share with your trading circle.
💬 Drop your view in the comments.
NFA & DYOR
Trading AnalysisWhere is Nifty right now?
Nifty closed at 23,689 on Thursday May 14. After a brutal fall earlier this week (it touched ~23,300), it bounced back for 2 days in a row. So right now it's in a recovery mood — but it hasn't really "fixed" itself yet. Think of it like someone who had a fever, now feeling slightly better, but not fully healthy.
2 What's the wall above? (Resistance)
If Nifty tries to go up next week, it will hit a wall around 23,500–23,600 first. That's the first test. If it somehow crosses that, the BIGGER wall is at 23,900–24,000 — where all the major moving averages (50-day & 200-day) are sitting. Lots of sellers will be waiting there to book profits. So going above 24,000 next week? Unlikely unless something very positive happens.
3 What's the floor below? (Support)
If Nifty starts falling, the first safety net is around 23,300–23,150. This zone has held multiple times recently. If it breaks this level decisively (and stays below it), then the next stop could be 23,000 or even 22,900. That's the danger zone — but that's not the most likely scenario for next week.
Intraday AnalysisOption Chain Analysis: Decoding Open Interest (OI) to find where the "Big Players" are positioned.
FII/DII Data: Understanding institutional activity and its impact on market direction.
Intraday Strategies: Scalping and swing setups using Price Action and key EMAs.
Global Market Cues: How GIFT Nifty and US Markets might influence our opening.
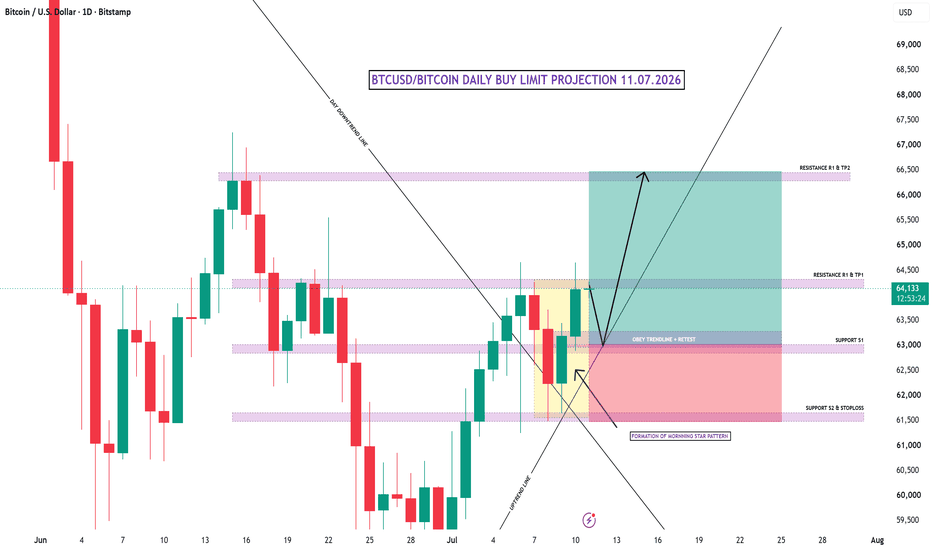
BTCUSD/BITCOIN DAY BUY LIMIT PROJECTION 11.07.26BTCUSD (Bitcoin) Daily Buy Limit Projection. The idea behind it is to wait for a pullback (retest) before buying, rather than buying immediately at the current price.
Overall Bias
🟢 Bullish (Buy Setup)
The analyst expects Bitcoin to continue higher after a temporary retracement.
1. Market Structure
The chart shows Bitcoin has:
Broken above a previous downtrend.
Formed a new uptrend.
Recently produced a strong bullish candle.
Expected to retest support before continuing higher.
This is known as a Breakout → Retest → Continuation setup.
2. Morning Star Pattern
The highlighted yellow candles indicate a Morning Star.
A Morning Star consists of:
Large bearish candle
Small indecision candle
Strong bullish candle
This pattern usually signals:
✅ Sellers are losing control.
✅ Buyers are entering.
It is one of the strongest bullish reversal patterns.
3. Buy Zone
The chart says:
"OBEY TRENDLINE + RETEST"
Meaning:
Instead of buying around 64,100, wait for price to pull back toward:
Support S1 (~63,000)
If price:
touches Support S1
respects the trendline
shows bullish rejection
then it becomes the preferred buy entry.
4. Stop Loss
The red area is the risk zone.
Stop Loss is placed below:
Support S2
approximately around
61,600–61,700
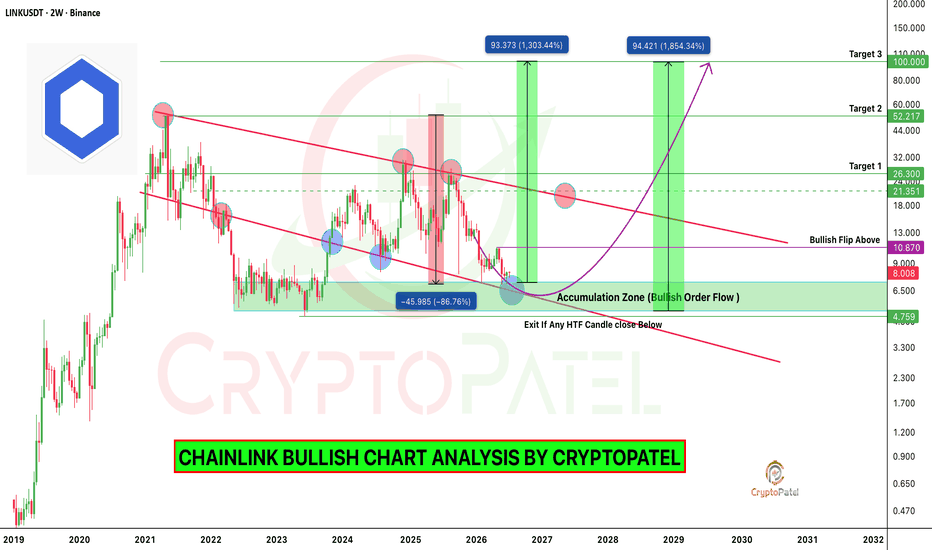
Will $LINK Potential to hit $50 in Next Altseason?Most People Only Believe In An Asset After It Has Already Pumped.
In 2020, Almost Nobody Thought BIST:LINK Could Reach $50.
It Proved Them Wrong.
Now It's 2026.
Since The Launch Of US Spot BIST:LINK ETFs, There Hasn't Been A Single Month Of Net Outflows.
Institutions Have Already Accumulated Over $125M+ Worth Of BIST:LINK Through US Spot ETFs In Just 8 Months.
Yet Retail Still Thinks #LINK Is Finished.
History Has A Habit Of Rewarding Those Who Buy Disbelief.
Accumulation Zone: $8–$5
Long-Term Targets: $50 → $100
Will You Be Early This Time?
Note: NTF & Always DYOR Before Any Investments.
NIFTY- Weekly Levels :- 12th to 17th JulyNIFTY sustain above 24029 important level above this bullish then around 24254 then 24280/303 above this more bullish then 24270/394 above this more bullish then above this wait more level are marked on chart
If NIFTY sustain below 23146/26 then around 24088/24060 then 23889 then 23908/882 ( make or break level ) 23856/60/42 below this bearish then 23714/23661 then 23614/590 important level 23432/381 last hope for the week below this more bearish below this wait more levels marked on chart
My view :-
"My viewpoint, offered purely for analytical consideration, The trading thesis is: Nifty (bearish tactical approach: sell on rise)
This analysis is highly speculative and is not guaranteed to be accurate; therefore, the implementation of stringent risk controls is non-negotiable for mitigating trade risk."
Consider some buffer points in above levels.
Please do your due diligence before trading or investment.
**Disclaimer -
I am not a SEBI registered analyst or advisor. I does not represent or endorse the accuracy or reliability of any information, conversation, or content. Stock trading is inherently risky and the users agree to assume complete and full responsibility for the outcomes of all trading decisions that they make, including but not limited to loss of capital. None of these communications should be construed as an offer to buy or sell securities, nor advice to do so. The users understands and acknowledges that there is a very high risk involved in trading securities. By using this information, the user agrees that use of this information is entirely at their own risk.
Thank you.
TrentResistance: ₹3,330–₹3,380 (previous consolidation and swing high area)
Support: ₹2,900 (current base where price is consolidating)
Trend: Strong uptrend → sharp gap-down breakdown → sideways base formation around ₹2,900.
What to watch next
Bullish: A sustained move above ₹2,950–₹2,980 with higher volume could indicate a recovery toward ₹3,050–₹3,100.
Bearish: A decisive break below ₹2,900 may lead to a retest of ₹2,850–₹2,820.
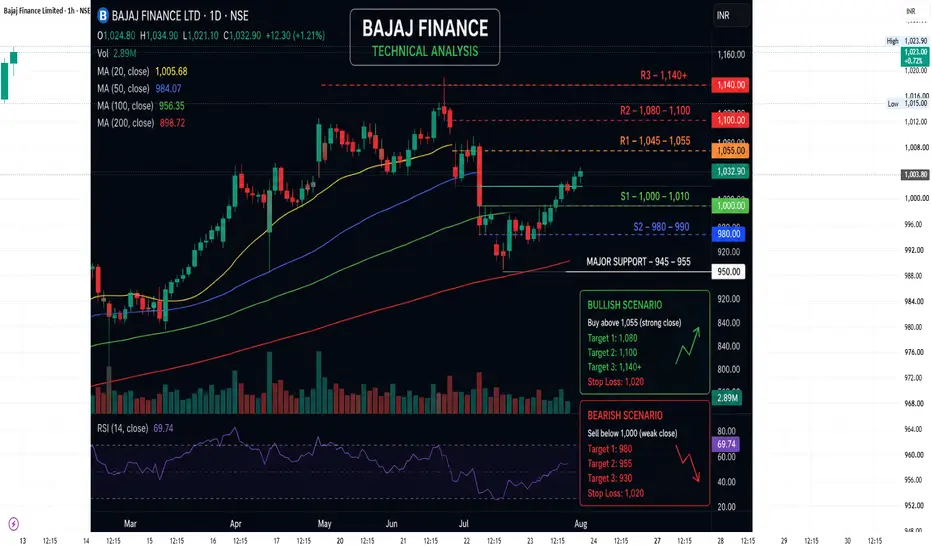
Bajaj FinanceCMP: Around ₹1,020–1,035
Support Zones
S1: ₹1,000–1,010
S2: ₹980–990
Major Swing Support: ₹945–955
Resistance Zones
R1: ₹1,045–1,055
R2: ₹1,080–1,100 (major breakout zone)
R3: ₹1,140+ (if breakout sustains)
Trading Plan
🟢 Bullish Scenario
Buy only after a strong close above ₹1,055 with good volume.
Upside targets:
₹1,080
₹1,100
₹1,140
Stop Loss: ₹1,020
🔴 Bearish Scenario
If price falls below ₹1,000, weakness may increase.
Downside targets:
₹980
₹955
₹930
Stop Loss for shorts: Above ₹1,020
Technical View
Trend: Bullish
RSI: Around 70+, indicating strong momentum but also nearing overbought conditions.
Price is trading above the 20, 50, 100, and 200-day moving averages, supporting the primary uptrend.
Professional TradingView Chart Setup
Add these horizontal levels:
🔴 Resistance: ₹1,100
🟠 Resistance: ₹1,055
🟡 Current Zone: ₹1,020–1,035
🟢 Support: ₹1,000
🔵 Support: ₹980
⚫ Major Support: ₹950
Bias: Buy on dips above ₹1,000 or on a confirmed breakout above ₹1,055. Avoid fresh longs if the stock is rejected near ₹1,100 without strong volume.
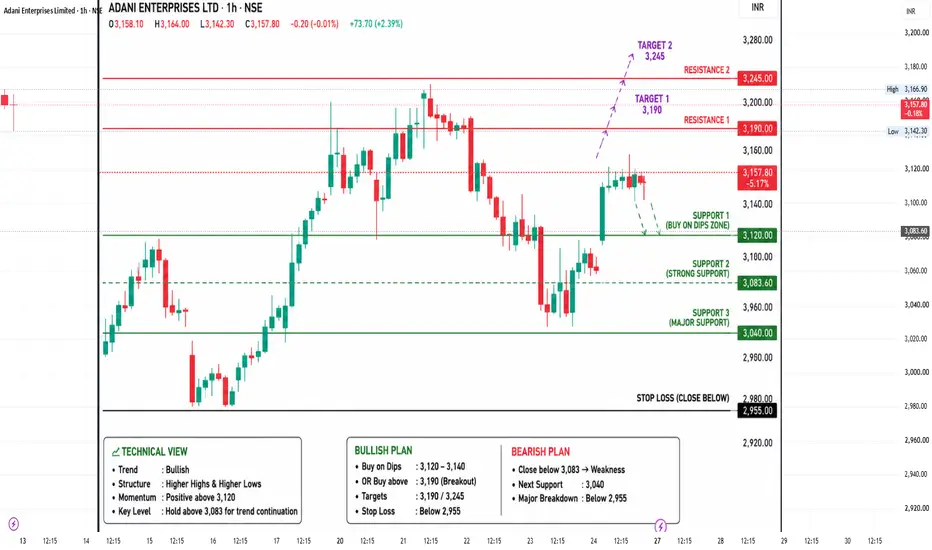
Adani EnterprisesTechnical Analysis
Trend: Bullish
Momentum: Positive while price holds above ₹3,140.
Breakout Trigger: Sustained close above ₹3,230 with above-average volume.
Targets after breakout: ₹3,275 → ₹3,350.
If price falls below ₹3,100: Momentum may weaken and a retest of ₹3,050 becomes likely.
Swing Trading Plan
Bullish Setup
Buy on dips: ₹3,140–3,160
OR buy after breakout: Above ₹3,230
Targets: ₹3,275 / ₹3,350
Stop Loss: ₹3,040
Bearish Setup
A close below ₹3,100 increases the probability of a decline toward ₹3,050–3,000.
Recent news flow has also been supportive, including Adani Enterprises' partnership in low-carbon chemicals, which has kept the stock in focus, though technical levels should remain the primary guide for trade execution.
Reliance IndustriesSupport Zones
S1: ₹1,295–1,300
S2: ₹1,270–1,280 (Major demand zone)
S3: ₹1,250–1,255 (Strong positional support)
Resistance Zones
R1: ₹1,330–1,340
R2: ₹1,365–1,380
R3: ₹1,430–1,475 (Major breakout target)
Trading View
Bullish Scenario
Buy only above ₹1,335 with strong volume.
Targets:
🎯 ₹1,365
🎯 ₹1,400
🎯 ₹1,470
Stop Loss: ₹1,295
Bearish Scenario
If the stock closes below ₹1,270, weakness may extend towards:
🎯 ₹1,250
🎯 ₹1,220
Technical Outlook
Trend: Neutral to Bullish
Momentum is improving after bouncing from the ₹1,250–1,270 demand zone.
Sustaining above ₹1,335–1,340 would confirm a stronger bullish reversal.
Key Levels Summary
Level Price
Immediate Resistance ₹1,330–1,340
Major Resistance ₹1,365–1,380
Breakout Target ₹1,430–1,475
Immediate Support ₹1,295–1,300
Major Support ₹1,270–1,280
Strong Positional Support ₹1,250–1,255
If you want the same professional TradingView-style chart (clean black background with colored support/resistance lines, targets, stop-loss, and buy/sell zones), upload your latest Reliance chart screenshot and I'll edit it in the same style as your previous charts.
ICICI Bank🟢 Support Levels
S1: ₹1,390–1,395
S2: ₹1,365–1,370
Major Support: ₹1,330–1,345
🔴 Resistance Levels
R1: ₹1,425–1,435
R2: ₹1,450–1,465
Major Resistance: ₹1,490–1,500 (52-week high zone)
Trading Plan
Bullish Scenario
Sustained move above ₹1,435 can trigger momentum towards ₹1,465, followed by ₹1,500.
Bearish Scenario
If the stock slips below ₹1,390, it may retrace towards ₹1,365.
A break below ₹1,330 would weaken the medium-term trend.
Swing View
Trend: Bullish
Buy on Dips: ₹1,365–1,390
Breakout Buy: Above ₹1,435 with strong volume
Stop Loss: Below ₹1,330 (for swing trades)