Short
Short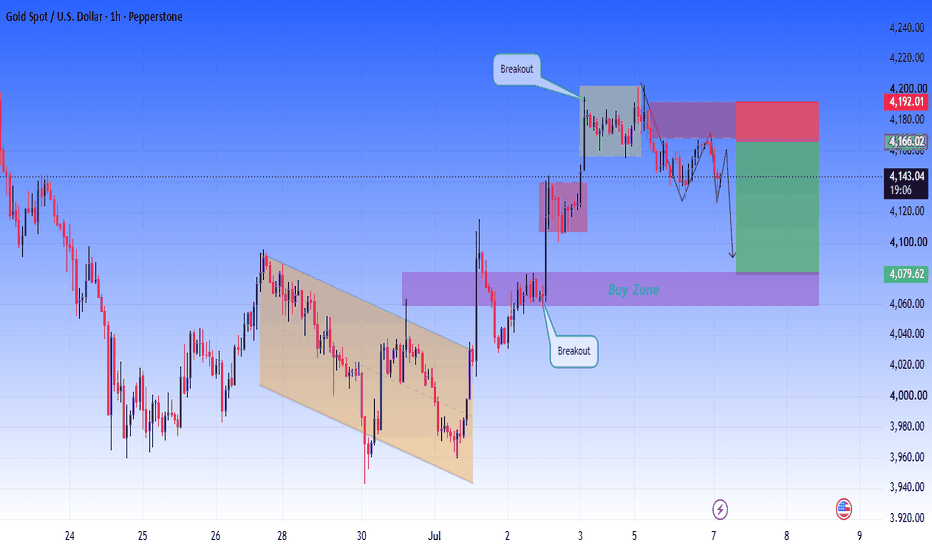
 Education
 Education
 Education

 Education

 Long
Long
$HBAR TO $1? The 1,600% Macro Setup Is Quietly Taking Shape CRYPTOCAP:HBAR TO $1? The 1,600% Macro Setup Is Quietly Taking Shape 🚀
#HBAR has corrected nearly 83% from its local high and is now trading Near a major weekly demand zone that has historically launched explosive rallies of 800%–1,800%.
Structure Breakdown:
HTF price has returned to a strong weekly Order Block (OB) + major historical support, a zone where institutional buyers have previously stepped in.
The macro correction has brought price back into a high-confluence accumulation area, while the descending trendline remains the final barrier before trend reversal confirmation.
Key Levels:
✅ Weekly Bullish OB / Demand Zone: $0.058–$0.042
✅ Major Historical Support Holding
✅ HTF Structure Remains Valid Above $0.0356 (Weekly Close Below = Invalidation)
✅ Breakout Trigger: Reclaim & Weekly Close Above The Descending Trendline
Upside Targets: $0.16 ➜ $0.35 ➜ $1
Potential 1,600% upside if the next macro expansion follows previous cycle behavior.
Macro Cycle Outlook:
➜ 2020: Macro Accumulation At Major Support
➜ 2021: +1,800% Explosive Bull Run
➜ 2022–2023: ~94% Bear Market Correction
➜ 2024: +800% Relief Rally
➜ 2025–2026: ~83% Reset Back Into Weekly Demand (You Are Here)
Smart Money Accumulates At Major Support, Not After The Breakout.
As long as CRYPTOCAP:HBAR holds this weekly Order Block, the macro risk/reward remains highly attractive.
If Price Hold Above $0.058-40.042 Level could mark the beginning of the next expansion phase, with $1.00 as the primary macro target.
Purely TA Based | Not Financial Advice | DYOR
What Is Your HBAR/USDT Target This Cycle? Drop It Below 👇
Like + Share + Bookmark  Long
Long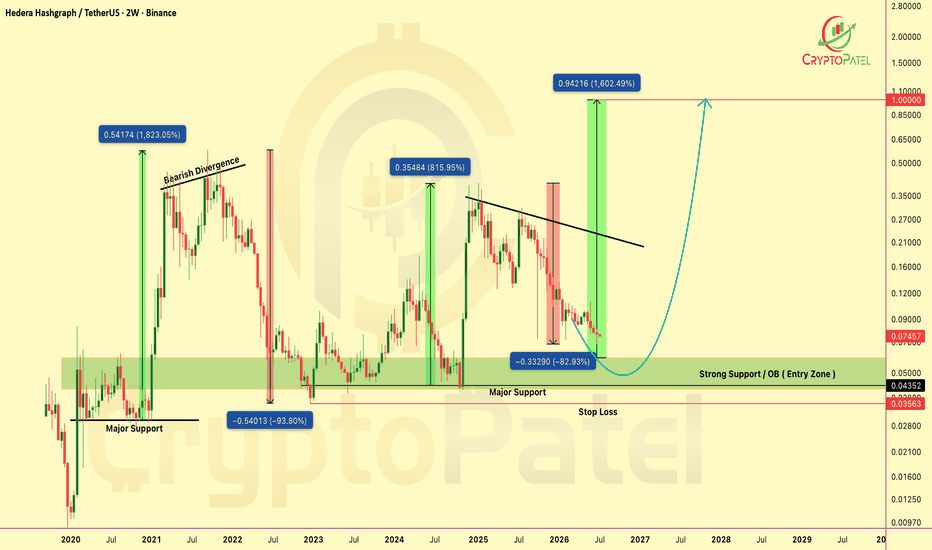
 Long
Long
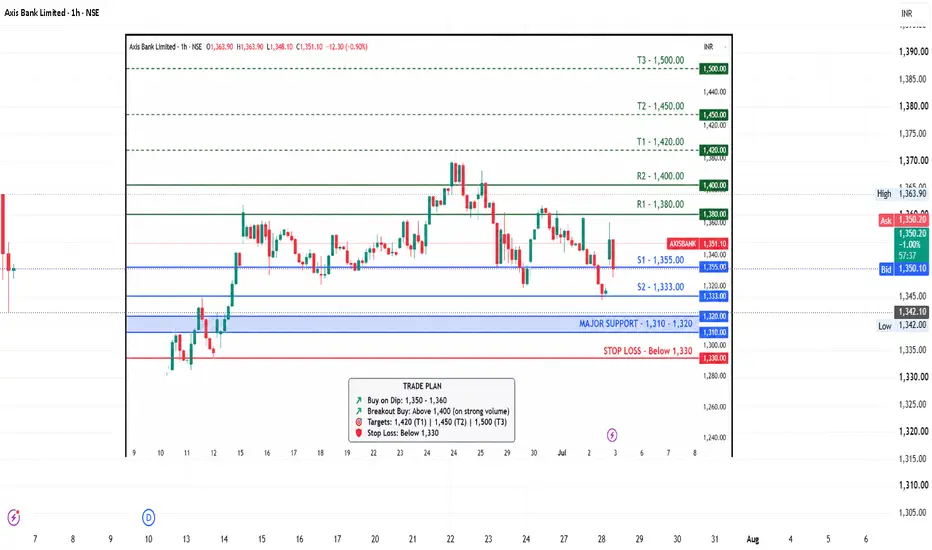
Axis Bank📈 Trend
Primary Trend: Bullish on the higher timeframe.
Short-term Trend: Consolidation after a strong rally.
The stock remains constructive as long as it holds the major demand zone. Banking stocks continue to show relative strength compared with the broader market.
🎯 Key Support Levels
S1: ₹1,355
S2: ₹1,333
Major Support: ₹1,310–1,320
🚀 Key Resistance Levels
R1: ₹1,380
R2: ₹1,400
Major Breakout: ₹1,420–1,425
✅ Swing Trading Plan
Buy on Dip: ₹1,350–1,360 (if bullish reversal candles appear)
Breakout Buy: Above ₹1,400 on strong volume
Targets: ₹1,420 → ₹1,450 → ₹1,500
Stop Loss: Below ₹1,330 (or below the recent swing low)
⚠️ Bearish Scenario
A daily close below ₹1,330 may trigger further downside toward ₹1,300 and ₹1,280 State Bank of IndiaCurrent Trend
Price is trading around ₹1,040–1,050.
The stock is above its 20, 50 and 200-day moving averages, indicating the medium-term trend remains positive. RSI is near 54–60, suggesting neutral to mildly bullish momentum rather than an overbought condition.
Key Support Levels
₹1,040–1,043 – Immediate support
₹1,020 – Strong support
₹1,000–1,005 – Major positional support
Key Resistance Levels
₹1,050–1,058 – Immediate resistance
₹1,066–1,080 – Strong breakout zone
A sustained close above ₹1,080 could open the door for a fresh rally.
Trading View
Bullish: Buy on dips near ₹1,020–1,040 with a stop-loss below ₹1,000.
Breakout Trade: Consider fresh buying only after a strong close above ₹1,058–1,066 with volume.
Targets after breakout: ₹1,100 followed by ₹1,150 if momentum remains strong.
Overall Analysis
✅ Trend: Bullish to Neutral
✅ Momentum: Positive but not overextended
⚠️ Watch the ₹1,050–1,060 resistance zone carefully. A decisive breakout with strong volumes would strengthen the bullish case. Banking stocks have generally shown technical strength in the current market backdrop. Bank Nifty📈 BANKNIFTY KEY LEVELS
CMP: 58,315
🟢 Resistance Levels
58,350 – Immediate Resistance
58,600 – Major Breakout Level
59,000 – Target 1
59,200 – Swing Target
59,500 – Extended Target
🔴 Support Levels
58,000 – Immediate Support
57,800 – Strong Demand Zone
57,500 – Major Support
57,200 – Trend Reversal Level
✅ Bullish Scenario
Buy Above: 58,350 (on a 1H candle close)
Targets:
🎯 58,600
🎯 59,000
🎯 59,200
🎯 59,500
Stop Loss: 58,000
🔻 Bearish Scenario
Sell Below: 57,800
Targets:
🎯 57,500
🎯 57,200
🎯 56,900
Stop Loss: 58,050
📊 Technical View
Trend: Bullish
Structure: Higher Highs & Higher Lows
Momentum: Positive above 58,350
Breakout Confirmation: Above 58,600
Bias: Buy on dips while price holds above 57,800 Larsen & ToubroCurrent Price
Around ₹4,045–4,050 (intraday, 6 Jul 2026).
Key Support Levels
₹4,025–4,050 – Immediate support
₹4,000–4,012 – Strong buying zone
₹3,940 – Major positional support
₹3,850 – Trend-changing support if broken decisively
Key Resistance Levels
₹4,080–4,120 – Immediate resistance
₹4,180 – Breakout level
₹4,330–4,340 – Major resistance
₹4,440 – 52-week high
Technical Analysis
The stock has corrected from ₹4,440 and is currently testing an important support area around ₹4,000–4,050.
Momentum is neutral to mildly bearish in the short term, but the long-term uptrend remains intact as long as ₹3,940 holds.
A close above ₹4,180 would improve the technical structure and could open the way toward ₹4,330–4,440.
Trading Plan
Bullish
Buy near ₹4,000–4,030 if support holds.
Add on a breakout above ₹4,180 with strong volume.
Targets: ₹4,330 → ₹4,440.
Bearish
A daily close below ₹3,940 could trigger further weakness toward ₹3,850 and potentially lower.
Investment View
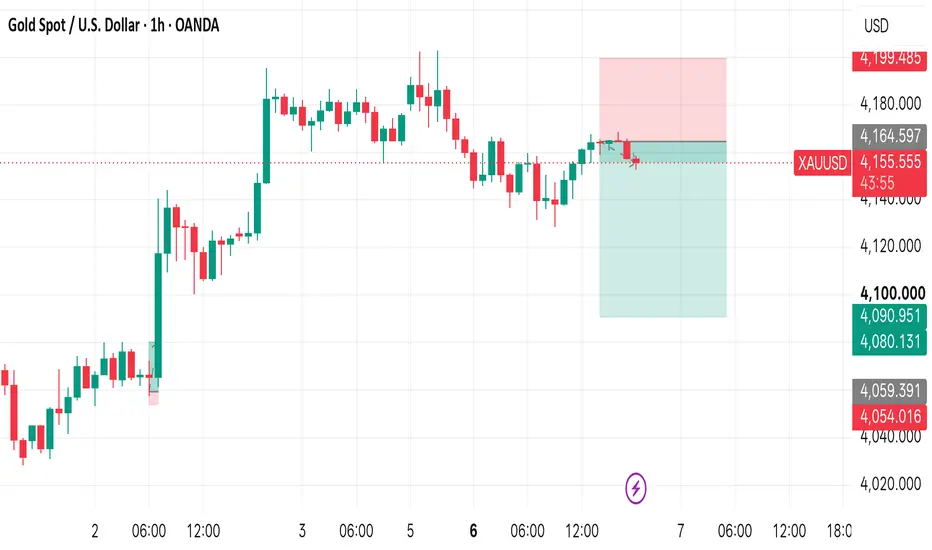
Fundamentally, L&T remains one of India's strongest engineering and infrastructure companies with a robust order book. Recent concerns have centered on geopolitical risks affecting its Middle East exposure, but analysts generally continue to view the long-term outlook positively despite near-term execution and margin pressures. XAUUSD: Buyers await a retest before extending toward 4,250XAUUSD is undergoing a minor correction following a strong rebound from its early-July lows. Notably, the price remains above the dashed uptrend line and has not broken the current recovery structure.
The 4,124–4,130 zone on the chart is acting as a key support level. If the price pulls back to this area and shows a clear bullish reaction, it would serve as a strong trigger for a continued upward move. The immediate target is 4,250, aligning with the green resistance zone above.
Entry Focus: Wait for a pullback to the 4,124–4,130 range followed by a bullish confirmation candle.
Invalidation: A drop below 4,100 would weaken the bullish scenario. Long 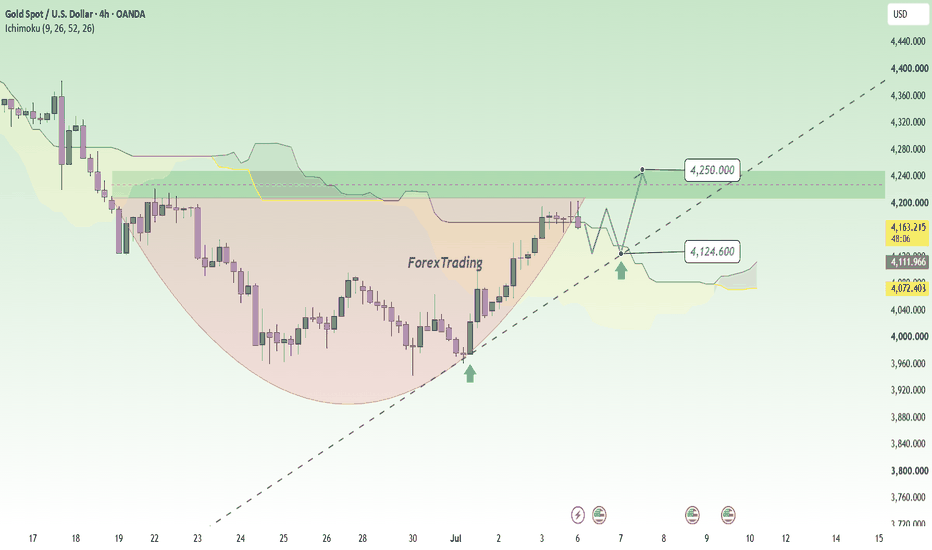
Long 
XAUUSD/GOLD WEEKLY SELL PROJECTION 05.07.26XAUUSD / GOLD – Weekly Sell Projection (05 July 2026)
Based on your chart, the overall idea is that gold may complete a short-term bullish pullback before resuming the main bearish trend. The analysis combines trendlines, Fibonacci retracement, resistance zones, and candlestick confirmation.
1. Overall Market Structure
The market is still making lower highs and lower lows, which means the primary trend remains bearish.
Price has recently bounced strongly from the support area, but this is currently viewed as a retracement, not a confirmed trend reversal.
2. Bullish Momentum Candle
The large green candle is labeled as a Bullish Momentum Candle.
This candle shows buyers have gained short-term strength after the recent decline.
However, one bullish candle alone does not invalidate the overall bearish trend.
Meaning:
Expect the price to continue moving upward for a while before sellers become active again.
3. Three Strike Line Pattern
The chart highlights a Three Strike Line Pattern.
This suggests:
Buyers have temporarily taken control.
Price is attempting to recover from the previous selling pressure.
The recovery is expected to end near a major resistance area.
4. Fibonacci Golden Ratio (61.8%)
The most important resistance is the 61.8% Fibonacci retracement, located around:
4,212.85
This area is significant because:
It is the Fibonacci Golden Ratio.
It aligns with the descending trendline.
It overlaps with the resistance zone.
When several technical factors meet at one level, it becomes a high-probability reversal area.
5. Resistance Zone
The purple resistance zone around 4,212–4,232 is where you expect selling pressure.
Reasons:
Fibonacci 61.8%
Previous resistance
Descending trendline
Market structure resistance
If bearish candlestick confirmation appears here (such as a bearish engulfing candle, rejection wick, or shooting star), it could provide a sell opportunity.
6. Stop-Loss Area
The red zone above the resistance represents the Stop-Loss Area.
This means:
If price breaks and closes strongly above this zone, the bearish setup becomes invalid.
Buyers may then continue pushing toward higher levels.
7. Take Profit Targets
Take Profit 1
Around the first support level.
Suitable for partial profit booking.
Take Profit 2
Near Support S1.
A stronger downside objective.
Take Profit 3
Around Support S2 near 4,020.
This is the final target if bearish momentum remains strong.
8. Trendline Analysis
The descending trendline indicates:
The long-term trend is still downward.
Every rally toward the trendline may attract sellers.
Unless price breaks above the trendline with strong momentum, the bearish outlook remains valid. Short 
 Long
Long