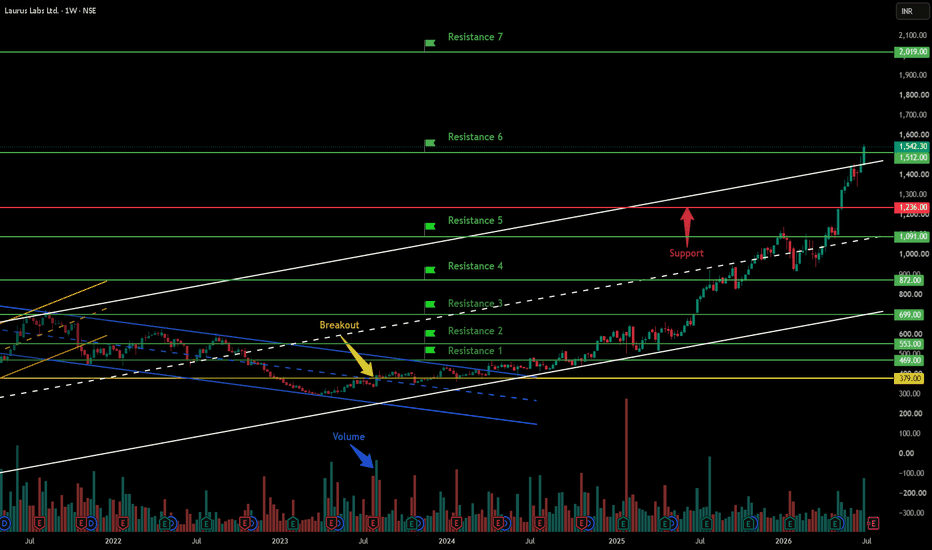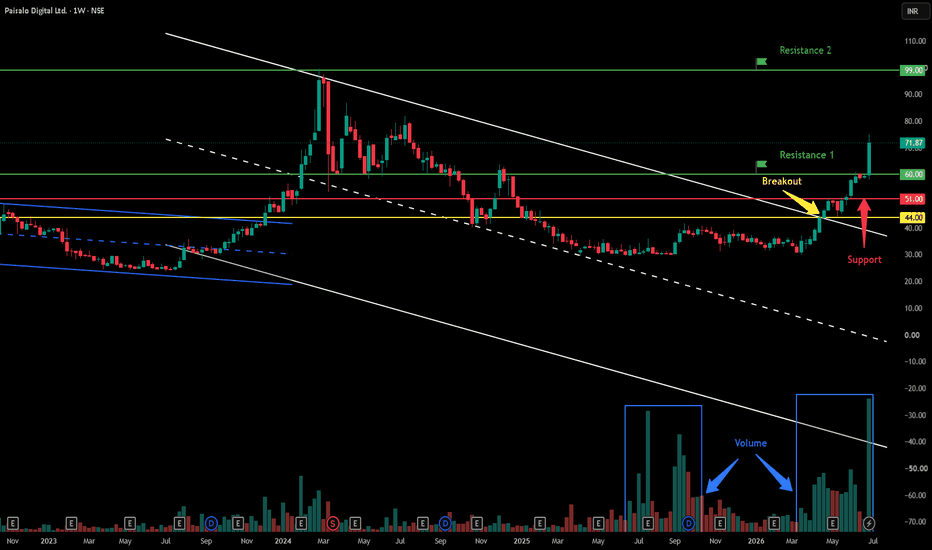
Danaos Corporation(DAC) analysis1. came out of base from 2009.
2. tested this resistance multiple times and failed. this time it has been able to break it.
3. after breaking a good correction is seen.
4. Begin of stage 2.
3. was holding well when SPX was falling.
4. has outperformed the market.
5. low financials, mid valuation, good momentum .
6.Minor increase in institution holding .
7. YoY net profit and revenue has increased.
I am managing my SL with 4.8% and aiming a target of 25-35%.
PS:- This is not tip or recommendation, This is just for learning purposes.
Harmonic Patterns
NIFTY- Intraday Levels :- 4th May 2026
Always refer the previous days levels also (30th April levels)
Range:- 24103/120/134 or 24669 above this more bullish, 23846/39 below this more bearish
NIFTY sustain above 24038 above this bullish then 24103/131 above this more bullish then 24238/80 then 24359/37 or 24480/94 above this wait more levels for more level refer previous day analysis.
If NIFTY sustain below 23954 below this bearish then 23888 thne 23863/46/06 below this more bearish then below this wait more levels marked on chart
My view :-
"My viewpoint, offered purely for analytical consideration, The trading thesis is: Nifty (bullish tactical approach: buy on dip)
We have 3 days holiday, any major news may impact the market movement.
This analysis is highly speculative and is not guaranteed to be accurate; therefore, the implementation of stringent risk controls is non-negotiable for mitigating trade risk."
Consider some buffer points in above levels.
Please do your due diligence before trading or investment.
**Disclaimer -
I am not a SEBI registered analyst or advisor. I does not represent or endorse the accuracy or reliability of any information, conversation, or content. Stock trading is inherently risky and the users agree to assume complete and full responsibility for the outcomes of all trading decisions that they make, including but not limited to loss of capital. None of these communications should be construed as an offer to buy or sell securities, nor advice to do so. The users understands and acknowledges that there is a very high risk involved in trading securities. By using this information, the user agrees that use of this information is entirely at their own risk.
Thank you.
Gold Sees Moderate RecoveryGold (XAU/USD) prices showed a moderate recovery to around $4,615 (+0.50%) in today's session, attempting to break a three-day downtrend.
Despite rebounding from a monthly low, the precious metal still faces a major storm from the strengthening US dollar, driven by the Fed's hawkish shift and the complete diplomatic deadlock in the Middle East.
------------------------------------------------------------------------------------------------
✅ FOMC: Largest Split Since 1992
The Fed's decision last night left a scar on expectations of monetary easing:
- ⚡Surprising Dissent: Although interest rates remained at 3.50%-3.75%, three Fed officials dissented from the accommodative tone in the policy statement. This is the largest internal split in 34 years.
- ⚡Interest Hike Hints: Markets responded sharply by reducing bets on a rate cut. Conversely, the probability of a rate hike by the end of 2026 has now crept above 10% due to stubborn energy inflation.
- ⚡Powell's Farewell: Jerome Powell attempted to balance the tone of the debate by stating that his focus was on "neutrality," but the market preferred to focus on the hawkish faction that was beginning to dominate ahead of Kevin Warsh's arrival.
✅ Geopolitics: Trump Closes the Door Unconditionally on Nuclear
Hopes for peace in Islamabad were officially dashed after the latest statement from the White House:
- ⚡Proposal Rejection: President Donald Trump officially rejected Iran's proposal. He asserted that there would be no peace deal or lifting of the naval blockade until Iran completely halted its nuclear program.
- ⚡Hormuz Crisis: Trump confirmed that the maritime blockade would continue, guaranteeing continued energy supply disruptions. This strengthened the greenback as a primary safe haven amid the risk of global energy inflation.
-----------------------------------------------------------------------------------------------
✅ XAU/USD Technical Analysis (Intraday)
Technically, gold is making a healthy correction amidst a still-strong downtrend:
- ⚡Critical Support ($4,520 - $4,535): The recently tested monthly low. As long as the price remains above this level, the opportunity for a short-term technical rebound remains.
- ⚡Immediate Resistance ($4,650): A psychological level that is now a major barrier. Gold needs to break through this level to convince the market that today's recovery is not just a dead cat bounce.
- ⚡PCE & GDP Pivot: The next major move will be triggered by the release of Q1 GDP and the PCE Price Index data tonight. A hotter-than-expected PCE inflation figure could quickly end today's gold recovery.
EURUSD: Discount Grab Before Repricing HigherDowntrend on the surface. Accumulation underneath.
EURUSD has been printing lower lows, keeping the bearish narrative alive. But zoom in… and you’ll notice something different now.
Price has tapped into a clean discount zone, swept sell-side liquidity, and is starting to show reaction where it actually matters.
This isn’t random buying.
This is positioning.
Current structure:
Sell-side liquidity taken below equal lows
Reaction from higher-timeframe demand
Early shift in short-term order flow
What I’m anticipating:
A controlled pullback into nearby inefficiency, followed by continuation to the upside targeting premium liquidity.
That green zone above?
That’s the draw.
Key concept:
Reversals don’t begin with strength.
They begin with the end of selling pressure.
Title: XAUUSD Bearish Continuation with Pullback Entry SetupThis chart outlines a clear bearish market structure on Gold (XAUUSD), where price has been consistently forming lower highs and lower lows, confirming strong downward momentum.
Initially, the market created a minor consolidation followed by a rejection from a supply zone (marked in red), where sellers stepped in aggressively. This led to a strong impulsive move downward, breaking previous structure and reinforcing bearish control.
Currently, price is in a corrective phase, pulling back toward a newly formed resistance area. The highlighted trade idea focuses on a sell setup from this pullback:
Entry Zone: Around the resistance/pullback area where price is expected to face selling pressure again
Stop Loss: Placed above the recent swing high to protect against invalidation
Target: Positioned near the previous lows, aligning with the continuation of the bearish trend
The setup offers a favorable risk-to-reward ratio, as it aligns with the dominant trend and utilizes a classic pullback-to-resistance strategy.
Key Insight:
As long as price remains below the defined resistance zone, the bias stays bearish, and further downside continuation is expected. A break above the stop-loss zone would invalidate this setup and suggest potential trend weakening.
NIFTY- Intraday Levels :- 30th April 2026 Monthly candle will be form today, today's closing will be very important level.
Today's Range:- 24669 to 23839 above this more bullish, below this more bearish
Also refer yesterday's levels.
NIFTY sustain above 24177/24220 above this bullish then 24339 to 24402/443 above this more bullish then 24502 then 24580 then 24628/57/69 above this wait more levels marked on chart
If NIFTY sustain below 24070/51 or 23999 below this bearish then 23981/52/23889 below this more bearish then 23889 then 23789/26 below this wait more levels marked on chart
My view :-
"My viewpoint, offered purely for analytical consideration, The trading thesis is: Nifty (bullish tactical approach: buy on dip) also Friday also seems to be buy on dip.
This analysis is highly speculative and is not guaranteed to be accurate; therefore, the implementation of stringent risk controls is non-negotiable for mitigating trade risk."
Consider some buffer points in above levels.
Please do your due diligence before trading or investment.
**Disclaimer -
I am not a SEBI registered analyst or advisor. I does not represent or endorse the accuracy or reliability of any information, conversation, or content. Stock trading is inherently risky and the users agree to assume complete and full responsibility for the outcomes of all trading decisions that they make, including but not limited to loss of capital. None of these communications should be construed as an offer to buy or sell securities, nor advice to do so. The users understands and acknowledges that there is a very high risk involved in trading securities. By using this information, the user agrees that use of this information is entirely at their own risk.
Thank you.
Xauusd gold today update 30.4.26.*🟡 XAUUSD (Gold) – TODAY UPDATE 🟡 ⏰*
*Validity: 30-04-26*
*🔹 Bullish Scenario (BUY)*
*• Trend Confirmation: Above 4615*
*• Targets: 4654– 4700*
*🔻 Bearish Scenario (SELL)*
*• Trend Confirmation: Below 4490*
*• Targets: 4460– 4400*
*🔄Key Reversal /Entry : 4554*#trading #Viral #profit #EURUSD #intraday #goldsignal #scalping #eurusdsignal #freevipsignal #anantmoney
BTC: Premium Rebalance Before the DropImpulse down. Reaction up. Trap set.
BTC has already shown its hand with a strong bearish displacement, slicing through structure and leaving behind a clean inefficiency. What we’re seeing now isn’t strength… it’s a rebalance into premium.
Price is retracing into a key supply zone where liquidity rests above. This is where late buyers step in… and where smart money starts unloading.
Narrative stays simple:
Retracement into premium / imbalance
Liquidity grab above short-term highs
Failure to continue higher
Expansion targeting sell-side liquidity below
That bounce you see forming?
It’s not a reversal… it’s an invitation.
The real move begins once price shows rejection from this zone and shifts structure back to the downside.
Target remains clear: draw on liquidity below the range.
Most traders will chase this upside.
Professionals wait for the trap to close… then execute.
How To Understad Option?Institutional Option Trading (7 Key Points):
Smart Money Activity – Institutions like banks, hedge funds, and FIIs trade options with large capital, creating strong directional moves in the market.
Option Chain Analysis – They focus on OI buildup, unwinding, and PCR to identify accumulation/distribution zones.
Liquidity Zones – Institutions trade where liquidity is high (ITM/ATM strikes), ensuring easy entry and exit without slippage.
Hedging Strategies – Use advanced strategies like spreads, straddles, and strangles to manage risk instead of naked positions.
Volatility Play (VIX Focus) – Institutional traders trade based on implied volatility expansion and contraction, not just price direction.
Support & Resistance Creation – Major OI levels act as strong support/resistance due to institutional positioning.
Ethereum: Premium Trap Before Expansion LowerThis isn’t a reversal… it’s a setup.
ETH delivered a clean bearish displacement, leaving behind a clear inefficiency and breaking short-term structure. Now price is retracing into a premium zone where most traders will start getting optimistic again.
That’s the trap.
What we have here:
Bearish impulse = strong intent
Current pullback = rebalancing, not strength
Price approaching a key supply / imbalance zone
My narrative is straightforward:
Price trades into the premium array → taps liquidity resting above → fails to continue → then expands aggressively to the downside.
That red path isn’t prediction… it’s delivery logic.
Key idea:
The market doesn’t reward late sellers or early buyers.
It rewards those who understand where liquidity is engineered.
If ETH respects this zone, the next move should target the inefficiency below and continue the bearish leg.
Most will try to catch the bounce.
Smart money waits for confirmation… then presses.
USDCHF_H1USDCHF has delivered a clean bullish leg and tapped into a premium array, leaving behind a well-defined H1 FVG. Now we’re at a decision point where most participants start forcing bias instead of reading delivery.
Here’s the framework:
Price is currently reacting inside the imbalance.
If this FVG holds, continuation higher remains valid.
But if price accepts below it, the narrative shifts completely.
My expectation:
Failure to hold the H1 FVG
Weak reaction / no displacement
Breakdown through short-term structure
Expansion towards draw on liquidity below