 Long
Long
SUDARSCHEM: Daily Inverse H&S Breakout1. The Macro Perspective: The Reversal Structure
I am taking a LONG bias on Sudarshan Chemical Industries Limited (SUDARSCHEM) on the daily (1D) timeframe.
When analyzing pure market structure, reversal patterns are critical to identifying shifts in major trends. Look at the structural development displayed on this chart. Following a painful and persistent markdown phase throughout late 2025 and early 2026, the stock carved out a deep structural bottom. Instead of a random V-shaped recovery, the stock systematically built out a textbook Inverse Head and Shoulders (H&S) pattern. This classic reversal structure visually maps the exact process of institutional accumulation, successfully transitioning the asset from a sequence of lower lows into a fresh structural uptrend.
2. The Educational Setup: The Inverse H&S and the Moving Averages
To understand the absolute technical validity behind this setup, look at the key components forming the reversal base:
The Pattern Construction: The chart perfectly defines the three foundational pillars of the reversal: a 'Left Shoulder', a deeper washout 'Head' marking the absolute floor near 741.15, and a higher-low 'Right Shoulder'. This higher low forming the right shoulder is the first major structural clue that selling pressure has completely exhausted and buyers are stepping in aggressively.
The Dynamic Cushion and Neckline: Notice how the price action behaved during the formation of the Right Shoulder. The stock decisively reclaimed the daily 20 SMA (the middle blue line of the Bollinger Bands, currently near 923.79), utilizing it as a dynamic launchpad. This rising support compressed the price action tightly against the solid black horizontal neckline at 978.60, which marks the absolute ceiling of the reversal pattern.
3. Current Price Action: Neckline Breakout and Volatility Expansion
Look at the most recent daily candles on the far right of the chart. The structural pressure cooker has exploded. Institutional buyers have stepped in with undeniable conviction, printing a massive, full-bodied green expansion candle that has surged out of the base, currently trading around 1,004.50. This vertical thrust has decisively obliterated the 978.60 neckline on an unmistakable volume surge (visible in the towering cyan volume bar below). Furthermore, the price has violently pierced the upper Bollinger Band, confirming a textbook shift out of accumulation and into a highly explosive, high-volatility markup trend.
4. The Trade Plan: Entries, Targets, and Risk Management
Entry Strategy: Momentum is exceptionally strong with the stock trading out in the open above the neckline. Chasing a vertical move immediately carries a short-term, lower-timeframe mean-reversion risk. The highest-probability, lowest-risk entry strategy involves waiting for a minor structural cooling-off period. Look to scale into long positions or place limit orders to catch a potential pullback to perfectly retest the broken 960.00 to 980.00 neckline zone. Letting old historical resistance prove itself as a concrete new support floor offers a phenomenal risk-to-reward ratio.
Take Profit (Targets): We use a classical measured move strategy based on the structural depth of the Inverse Head and Shoulders pattern. By taking the depth of the 'Head' (roughly 237 points from the 741.15 floor up to the 978.60 neckline) and projecting it upward from the breakout point, our primary structural target sits comfortably in the 1,200.00 to 1,220.00 zone. Intermediate profit-taking milestones rest near the psychological round numbers of 1,100.00 and 1,150.00.
Invalidation (Stop Loss): A structural reversal breakout thesis is completely invalidated if the price fails to hold its newly claimed neckline support and collapses back into the right shoulder. A hard stop loss should be placed safely below the daily 20 SMA and the mid-level of the Right Shoulder, specifically around the 880.00 to 900.00 level. A definitive daily close completely back below 860.00 would act as a severe warning sign of a failed reversal and a major bull trap.
5. Time Horizon:
Because this technical setup is built on a 1-Day chart capturing a classic structural reversal phase and a clear neckline breakout, this is a high-alpha swing trade designed to capture a rapid momentum markup phase over the coming weeks. Let the trend run!  Long
Long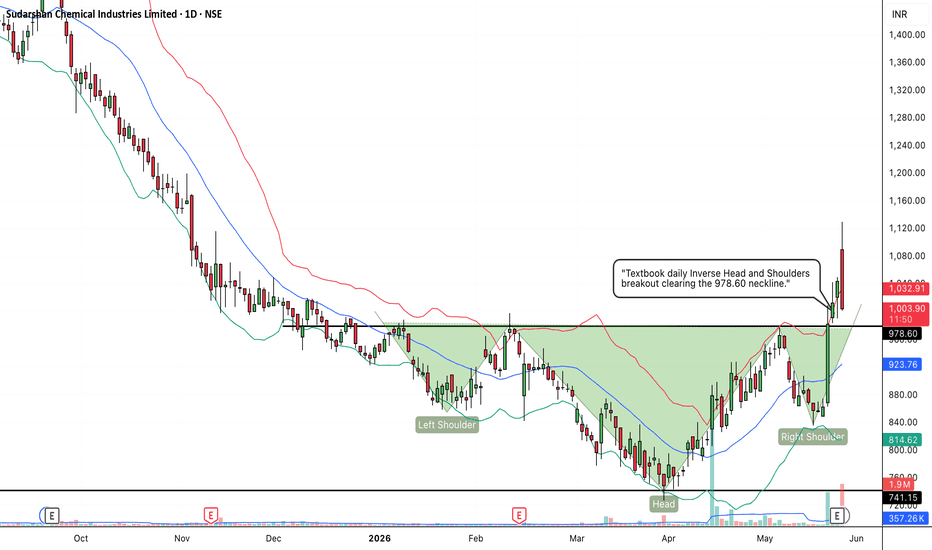
 Short
Short
 Short
Short
 Long
Long
 Long
Long
 Long
Long
 Long
Long
 Long
Long
 Short
Short
Hindustan Aeronautics Limited (HAL) Forming Inverse H&STurning our attention to the daily charts, we have a highly compelling technical setup developing in Hindustan Aeronautics Limited, commonly known as HAL.
As we can see on the daily timeframe, the stock has formed a textbook Inverted Head and Shoulders pattern. For our viewers tuning in, this is a classic technical indicator that typically signals a strong bullish reversal after a downtrend.
Let's break down the key components of this chart:
The Left Shoulder: The stock experienced an initial sell-off and consolidation phase, forming the first trough.
The Head: Following this, we saw a much deeper correction where the stock bottomed out, creating the lowest point of the pattern—the 'Head'.
The Right Shoulder: Most recently, the stock pulled back once more but established a higher low compared to the head. This completes the 'Right Shoulder' and indicates that seller momentum is drying up, with buyers aggressively stepping back in.
Current Price Action & Key Levels:
HAL is currently trading right around the 4,995 mark. What makes this setup actionable right now is that the price is actively testing a massive breakout zone. It is pushing against the downward-sloping neckline resistance—highlighted by the dotted line—as well as a crucial blue trendline.
What to Watch For:
Resistance: The immediate hurdle sits at the recent high of 5,105. A decisive, high-volume close above this neckline would confirm the breakout and potentially trigger a fresh upward rally.
Support: If the stock faces a rejection at these levels, the previous swing lows between the 4,670 and 4,848 zones will act as critical support.
In summary, the chart structure for HAL looks highly positive. Market participants should keep a very close watch on this counter in the upcoming trading sessions to see if it can sustain this breakout momentum.
this is not buy/sell call .  Long
Long
 Long
Long
OCCLLTD: Inverse Head and Shoulders Bullish Reversal1. The Macro Perspective: The Inverse Head and Shoulders Formation
I am taking a LONG bias on OCCL Limited (OCCLLTD) based on the daily (1D) timeframe
When analyzing market structure, the Inverse Head and Shoulders is a classic technical formation signaling a potential bullish trend reversal following a prolonged downtrend. After a significant downward move characterized by lower highs and lower lows, the stock formed a Left Shoulder, a deeper Head, and a higher Right Shoulder, indicating that selling pressure has reached an exhaustion point and buyers are becoming more aggressive. Fundamentally, this reversal pattern aligns with the company's recent Q4 FY26 performance, where they reported a net profit of ₹19.35 crore. Documenting these classical reversal patterns makes the charting workflow highly repeatable for anyone analyzing momentum shifts.
2. The Educational Setup: The Neckline Resistance
To understand the technical validity behind this reversal, look closely at how the price structure interacts with the core boundary:
The Neckline: The definitive line in the sand for a bullish structural shift is the resistance level connecting the highs formed between the shoulders and the head. A decisive breakout above this line is the key signal that the pattern is complete and an uptrend may be underway.
3. Current Price Action: Breakout Potential
As of June 5, 2026, the stock was trading at approximately ₹115.67. The structure is poised for a significant move, and the stock has shown a positive trend over the last six months with a return of approximately 21.54%. Institutional buyers stepping in with conviction during a breakout above the neckline, ideally accompanied by high volume, would confirm the trend reversal.
4. The Trade Plan: Entries, Targets, and Risk Management
Entry Strategy: The technical pattern formed is an Inverse Head and Shoulders, which acts as a bullish reversal signal. Traders often look to buy either on a confirmed breakout above the neckline resistance or on a retest of the neckline as new support.
Take Profit (Targets): A classical approach for measuring targets in an Inverse Head and Shoulders pattern is to take the vertical distance from the neckline to the head (the lowest point of the pattern) and project that distance upward from the breakout point. Based on the depth of this formation, an initial technical target for OCCLLTD sits in the 140.00 to 145.00 zone.
Invalidation (Stop Loss): A stop-loss is typically placed below the neckline or below the right shoulder to protect against a failed breakout, which would negate the bullish pattern. A defensive stop-loss level would be below the right shoulder, specifically around the 95.00 to 100.00 range.
5. Time Horizon:
Because this technical setup captures a clear structural reversal pattern, this is a high-alpha swing trade designed to capture a potential momentum shift. Let the trend run!  Long
Long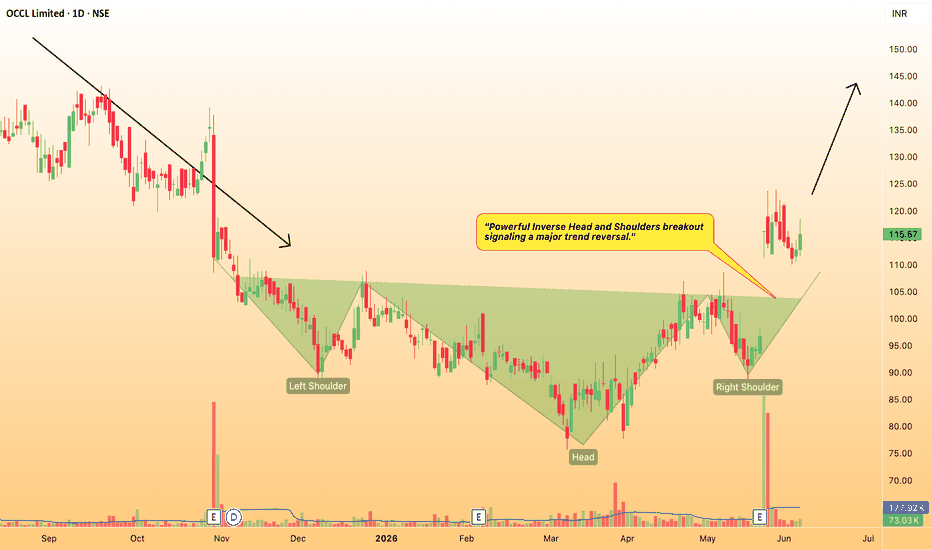
QUESS: Inverse Head and Shoulders Bullish Reversal1. The Macro Perspective: The Inverse Head and Shoulders Formation
I am taking a LONG bias on Quess Corp Ltd (QUESS) based on the daily structure . This is a classical technical formation signaling a potential bullish trend reversal following a prolonged downtrend. After a significant downward move characterized by lower highs and lower lows, the stock formed a Left Shoulder, a deeper Head, and a higher Right Shoulder, indicating that selling pressure has reached an exhaustion point and buyers are becoming more aggressive. Fundamentally, this reversal pattern aligns with the company's strong Q4 FY26 performance, where they reported a net profit of ₹64.35 crore—a 167.42% year-on-year growth.
2. The Educational Setup: The Neckline Resistance
To understand the technical validity behind this reversal, look closely at how the price structure interacts with the core boundary:
The Neckline: The definitive line in the sand for a bullish structural shift is the resistance level connecting the highs formed between the shoulders and the head. A decisive breakout above this line is the key signal that the pattern is complete and an uptrend may be underway.
3. Current Price Action: Breakout Potential
The structure is poised for a significant move, and the recent structural formation suggests a potential shift from a bearish to a bullish market sentiment. Institutional buyers stepping in with conviction during a breakout above the neckline, ideally accompanied by high volume, would confirm the trend reversal.
4. The Trade Plan: Entries, Targets, and Risk Management
Entry Strategy: Traders often look to buy either on a confirmed breakout above the neckline resistance or on a retest of the neckline as new support.
Targets: A classical approach for measuring targets in an Inverse Head and Shoulders pattern is to take the vertical distance from the neckline to the head (the lowest point of the pattern) and project that distance upward from the breakout point.
Risk Management: A stop-loss is typically placed below the breakout resistance (neckline) or below the right shoulder to protect against a failed breakout, which would negate the bullish pattern.
5. Time Horizon:
Because this technical setup captures a clear structural reversal pattern, this is a high-alpha swing trade designed to capture a potential momentum shift. Let the trend run!  Long
Long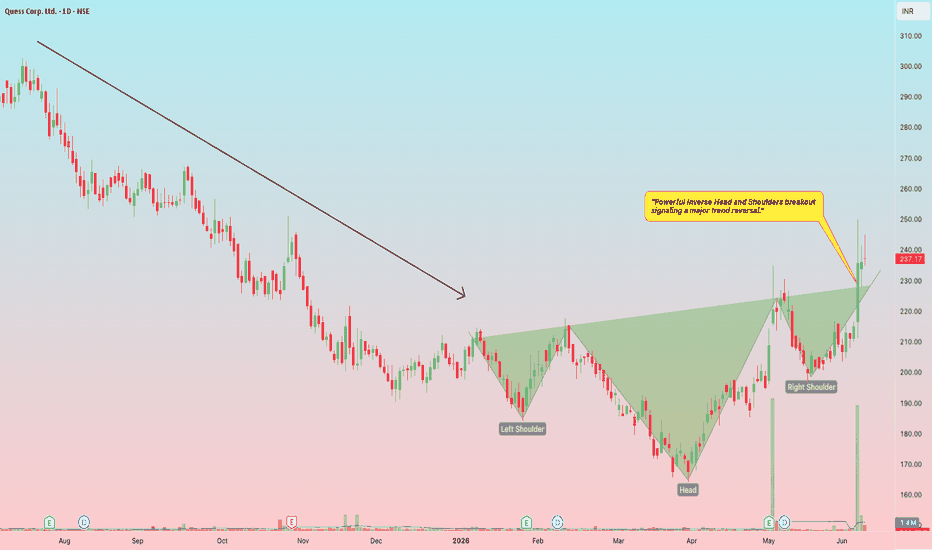
 Long
Long
 Long
Long


