CNXITThe CNX IT index is currently forming an inverse Head & Shoulders pattern, a bullish reversal formation. The index made a bottom at 30918 on 7th April 2024, which aligns with a prior support zone tested on 4th June 2024, followed by a strong upward move. This double test of support indicates a solid base formation.
If the pattern plays out, a breakout above the neckline could open the way toward the supply zone of 41600–43430, where previous selling pressure was observed.
Head and Shoulders
KIMS : Swing pick#KIMS #Swingtrade #trendingstock #breakoutstock
KIMS : Swing Pick
>> Breakout Stock
>> Trending setup
>> Good Strength in Stock
>> Good Volumes Buildup
>> Good Upside Potential
Swing Traders can lock profit at 10% and keep trailing
Disc : Stock charts shared are for Learning purpose not a Trade recommendation.
Consult a SEBI Registered Advisor before taking position in it.
ANGEL ONE: AN INVERTED H&S BREAKOUT WITH MASSIVE VOLUMN16th May 2025 / 10.00 PM
BUY ANGEL ONE with Target 3885 and SL 2544
1. Stock made clear inverted H & S pattern
2. Massive volume is observed on break out
3. Wait for a retracement at 2735 level for a retracement buy
4. Entry can be made on EAM 20 retracement on daily chart.
Expected Targets and SL are mentioned in Chart
Note: It's a swing trade. Risk Reward is excellent in this trade.
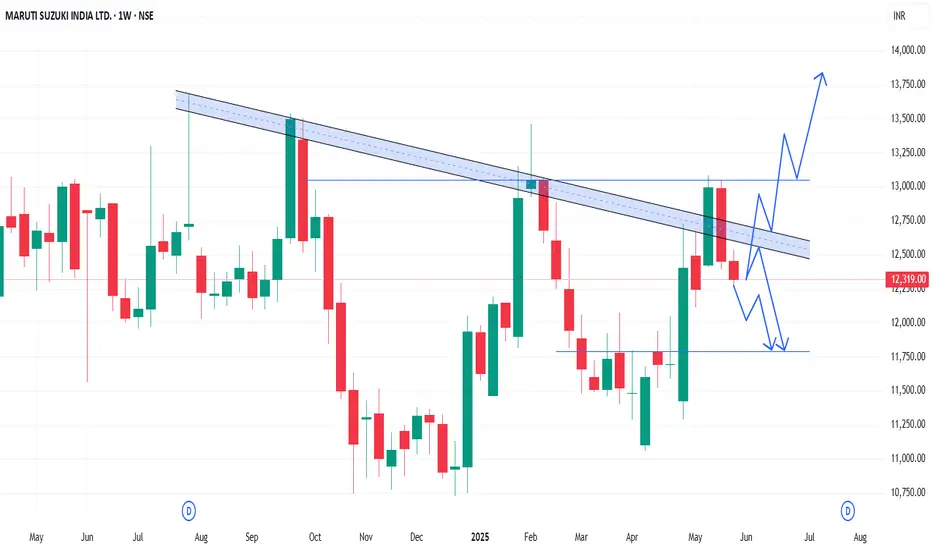
MARUTI - Weekly AnalysisIn the Weekly Chart of MARUTI ,
we can see that; it has shown rejection of Inverted H&S and Cup & Handle at the same time.
Even after rejection, selling is not that strong as it should be.
Possible momentums are shown in chart.
Lets see what direction it takes in next few weeks.
Chennai Petro Short Term TradeLevel of 670 has been a strong resistance since more than six months,
A head and shoulder pattern is visible, and the neckline coincides with this 670 level,
In the last three months, there are visible higher lows , forming a triangle like pattern,
Currently, there is a probable breakout, conformed with high volume, rise in atr, and overall bullish strength
Thus, there is a short term trade,
tgt 732, sl 650
ITC Approaches Key Support Within Mild UptrendTopic Statement:
ITC is trading in a range with a slight bullish tilt, presenting structured opportunities within a defined channel.
Key Points:
* The stock is moving within a slightly bullish up-trending channel, making it suitable for channel-based trading
* A head and shoulders candlestick pattern is emerging, which may signal potential short-term weakness
* The price is nearing the 180-day EMA, making levels near or below it attractive for long-term buying opportunities
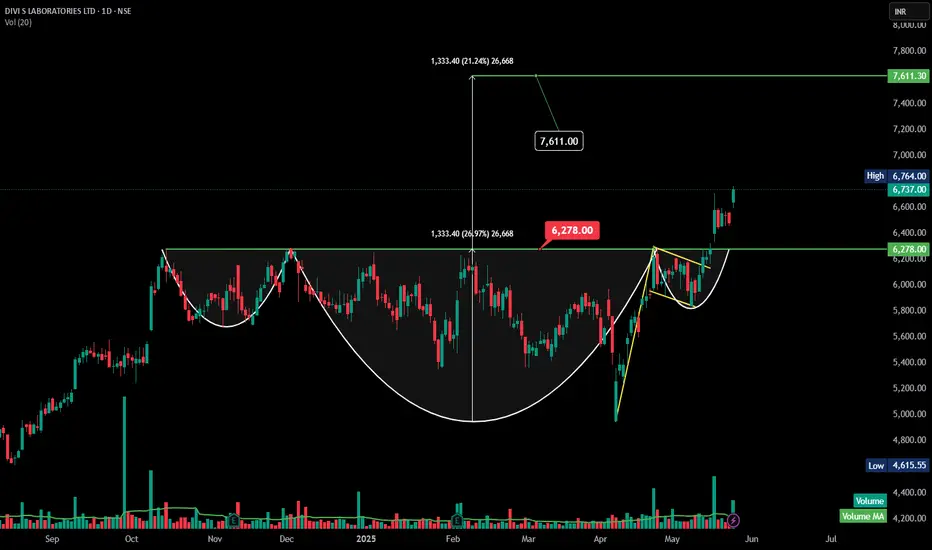
DIVISLAB -Inverted Head and Shoulders -DailyThanks for the clarification! Yes — the chart **does** resemble an **Inverted Head and Shoulders** pattern (a bullish reversal pattern), especially visible in the price structure before the breakout above ₹6,278.
---
### 🟢 **Inverted Head and Shoulders – Analysis (Divi's Lab)**
#### **Pattern Structure:**
* **Left Shoulder:** Formed in March.
* **Head:** Deepest low around early April.
* **Right Shoulder:** Higher low formed in late April to early May.
* **Neckline:** Breakout above the ₹6,2
ANGELONE | Inverse Head & Shoulders Breakout | Target ₹3,339+Here's the **technical analysis** for ANGEL ONE LTD based on the chart you provided:
---
### 🔍 **Technical Analysis – ANGEL ONE LTD (NSE)**
**Pattern Identified:** Inverse Head and Shoulders
**Breakout Level (Neckline):** ₹2,541
**Target:** ₹3,339.95
**Current Price:** ₹3,079.50
**Gain from Breakout:** 31%
---
### ✅ **Bullish Indicators:**
* **Inverse Head & Shoulders Pattern:** A classic bullish reversal pattern indicating potential trend reversal from downtrend to uptrend.
* **Breakout w
KITEX – Breakout from ATH KITEX – Breakout from ATH ⚠️ Risky but Noteworthy
CMP: ₹311
Breakout Zone: ₹296
Structure: Inverse Head & Shoulders (Daily TF)
Trend: Trading above key DMAs
Volume: On the lower side — no strong confirmation yet
Event Risk: Quarterly results approaching
KITEX has shown an aggressive bounce and is now breaking out of an all-time high zone around ₹296. The structure resembles a head and shoulders variant on the daily timeframe. While technically constructive, volume hasn't confirmed yet, which in
UNIONBANKUNIONBANK has given inverted H&S breakout with decent volume. Last quarter result also beat estimates. So there is fundamental support as well. And in recent days we have seen strong momentum in PSU banks. So UNIONBANK has a potential give very good return provided that it closes above 130 in coming days.
HDFCAMC - Inverted head and shoulder - Breakouttechnical analysis of the HDFC AMC LTD chart you've shared.
Looking at the price action, potential Inverted head and should pattern forming, which is generally considered a bullish sign.
Here's a simplified breakdown:
Head: Notice the rounded bottom shape that formed roughly between Dec 2024 and early April 2025. This suggests a period of consolidation before a potential upward move.
Handle: After reaching a high around ₹4,607, the price has pulled back and is now consolidating in a smaller
Nifty Smallcap- Inverted Head and Shoulder Pattern🚀 Breakout Watch Alert: Nifty SmallCap 100 Index (CNXSMALLCAP)
📌 Price: ₹17,147 📅 Date: 14-05-2025
① Pattern Name, Timeframe, Structure & Explanation
Pattern: Inverted Head & Shoulders
Timeframe: Daily Chart
Duration: \~4 Months (From Jan to May 2025)
The Nifty SmallCap 100 Index has formed a well-defined Inverted Head and Shoulders pattern, a bullish reversal structure commonly seen at the end of a downtrend. This pattern spans across four months with:
* Left Shoulder: Formed in early Marc
GRSE LONGThe Elliott Wave Theory's description of the structure and pattern of price movements in financial markets is known as the Elliott Wave Structure.
The Elliott Wave analysis indicates that the stock has completed waves (i),(ii, (iii), and (iv), which are shown as blue numbers on the daily chart. Wave (v) appears to be underway at this time.
Wave (v), also known as the impulse wave, unfolded into five waves, which are illustrated in red.
Wave levels are depicted on the chart.
An inverted Head
ESCORTS : BULLISH due to inverted Head & Shoulder
INVERTED HEAD & SHOULDER -
market made a clear inverted head & shoulder pattern and broke out of it indicating strong upward momentum for the stock
VOLUME SURGE -
market has shown strong volume surge with the breakout candle indicating strong upward pressure for the stock
PROFIT -
till 3266
REC : Bullish due to break out from inverted Head & Shoulder
INVERTED HEAD & SHOULDER -
stock is now bullish after breaking out an inverted head & shoulder pattern with strong confirmation of a green candlestick
BULLISH MACD -
MACD indicator of this stock is very bullish now with macd line having crossed over signal line properly over a period of time
WHITE CLOUD COVER -
apartfrom it a white cloud cover candlestick formed in the right shoulder indicating bullish movement
PROFIT TARGET -
463 level
STOP LOSS -
412 level
Trend Reversal setup in BSOFT(Inverted H&S Pattern)!Birlasoft (NSE:BSOFT) – Bullish Reversal on Inverted Head & Shoulders
📌 Technical Pattern: A classic Inverted Head and Shoulders pattern is forming, suggesting a potential reversal from the recent downtrend.
✅ Key Highlights:
RSI Divergence at the head hints at waning bearish momentum and potential reversal.
Price is testing the neckline zone; a breakout could confirm the bullish setup.
50-period EMA (~₹452) remains overhead, acting as a dynamic resistance.
📈 Target: ~₹516, calculated from
Trend Reversal setup in HCLTECH(Inverted H&S Pattern)!HCL Technologies (NSE:HCLTECH) – Bullish Reversal Setup
📌 Pattern Identified: A clear Inverted Head and Shoulders formation is visible on the daily chart, indicating a potential bullish reversal.
✅ Key Observations:
Price has broken above the neckline and also crossed the 50-period EMA, showing strength.
Notable volume buildup at the right shoulder, supporting the bullish move.
RSI is above 60, suggesting improving momentum.
📈 Projected Target: ~₹2,074 based on the pattern's height.
🔻 Stop
YESBANK - Daily -Breakout with volumes -Inverted HnSThis is a daily chart for YES BANK LTD (YESBANK) as of May 9th, 2025.
Here's a technical analysis of the chart:
Falling Wedge Pattern:
The stock was in a clear downtrend, forming a falling wedge pattern from approximately February 2024 to early 2025. A falling wedge is often a bullish reversal pattern when it occurs after a downtrend.
The price broke out from the upper trendline of this falling wedge around January/February 2025.
Inverted Head and Shoulders Pattern:
Following the breakout f
Head and Right Shoulder–Weekly Strategy for Nifty 08 May Expiry!Hello everyone, This week’s expiry strategy is not just any setup – it’s a premium structure crafted to take advantage of market exhaustion near resistance. We’re calling it the Head and Right Shoulder Strategy, and the payoff shape says it all!
Why This Strategy? (Based on Chart Analysis)
Resistance Zone: 24400–24785 (supply-heavy region, multiple rejection wicks visible)
Support Zone: 23800 (major bounce levels, strong candle reactions)
RSI Divergence Confirmation: Bearish divergen
FORCEMOT - Inverted Head and Shoulder - BreakoutThe chart technical analysis of Force Motors Ltd (NSE)**, showing a **cup and handle breakout pattern**—a bullish continuation formation. Here's a breakdown of the key insights:
---
# Pattern: Inverted Head and Shoulders (Bullish Reversal)
Left Shoulder: Formed around July–August 2023.
Head: Formed in December 2023, with a deeper low.
Right Shoulder: Formed in April 2025, with a higher low.
Neckline: Drawn across the resistance zone around ₹9,475.55 — now broken.
💥 Breakout Confirmation
Pric
(NSE: ICICILOMBARD) – Inverse H&S Signals Bullish Breakout! 📊 Chart Setup:
⏰ Time Frame: Daily
📈 Chart Pattern: Inverse Head & Shoulders (Bullish Reversal) 🎯
Key Resistance: 1908 – Price consolidating below this level!
🔥 Trigger: Wait for a high-volume breakout & close above 1908 to confirm bullish momentum.
🎯 Trading Plan:
Entry: Long on confirmation candle closing above 1908 with surge in volume 📊.
Stop Loss (SL): Low of the breakout candle (Trail SL upwards as price advances).
Targets:
➡️ 2000 (First psychological target 🎯)
➡️ 2100-2150 (Next
Inverse Head and Shoulders Pattern - IOCIndian Oil Corporation
Indian Oil Corporation Ltd is a Maharatna Company controlled by GOI that has business interests straddling the entire hydrocarbon value chain - from Refining, Pipeline transportation and marketing of Petroleum products to R&D, Exploration & production, marketing of natural gas and petrochemicals. It has the leadership position in the Oil refining & petroleum marketing sector of India.
Current Price ₹ 143
Stock P/E 16.7
Industry PE 20.2
Stock now trade November 2024 on