HEAD & SHOULDERS IN GOLD - WATCH THAT NECKLINESymbol - XAUUSD
CMP - 3288
Gold, after a sharp decline, is now trading and consolidating at important levels. The recent movement follows a strong sell-off as geopolitical and tariff-related issues between the US and China began to ease. This decline pushed gold back from its all-time high of 3500, with the metal currently hovering near key support.
The market remains cautious, with attention shifting toward potential shifts in FED policy and broader macroeconomic cues.
A Head & Shoulders pa
Head and Shoulders
Head N Shoulder Breakout in Alkem Labs. Ready for the upmoveAlkem Labs broke the neckline of Inverted Head and Shoulder on the daily chart, retested the neckline and it is looking good for a decent run. The HNS target comes to Rs.5616, which is a good 11.29% from the CMP of Rs. 5146.
The Inverted Head and Shoulders pattern is a bullish reversal chart pattern in technical analysis, signaling a potential shift from a downtrend to an uptrend.
Moreover, the stock is above trading above 11 & 22 DEMA which signifies good uptrend and momentum.
MACD is abov
Garden Reach Shipbuilders (GRSE) Bullish Inv HnS BO with volumeThanks for sharing the chart of **Garden Reach Shipbuilders (GRSE)**.
Strong **bullish setup** supported by two technical patterns:
1. **Falling Wedge Pattern (Breakout)** – A classic bullish reversal pattern, and it has broken out with strong volume.
2. **Inverted Head and Shoulders** – Another bullish reversal formation that also broke out around ₹1,730–₹1,750 zone, confirmed with high volume.
### Key Highlights:
- **Breakout Confirmation**: Price closed at ₹1,957.80, up **+11.90%**, with s
NIFTY DEFENCE "⚙️ NIFTY IND DEFENCE and the Head and Shoulders pattern—what's next?
The daily chart reveals a Head and Shoulders pattern in development for NIFTY IND DEFENCE. If this bearish reversal plays out, it could signal a potential shift in the trend. ⬇️
✅ Want to stay ahead with insights like this? Join my channel now for expert analysis and actionable updates to elevate your trading game!"
HEROMOTOCO-Positional Short Trade Stock upside taking support from trendline. Friday's session 25'th April The stock has shown weakness potential trend reversal.
There are two possibilities:
1)Head and Shoulder Pattern
2)Descending Tringle Pattern
For both the possibilities it the neckline/Support zone 3800 needs to break. If that happens it may test 3680.
If opens gap up Above 3960 Avoid!
Please don't forget click on follow button so you won't miss any upcoming ideas.
Any confusion, feel free to drop msg. Happy to help :)
(NSE:SUNPHARMA) Inverted H&S Breakout Eyes New ATH Chart Analysis:
Sun Pharma has formed a textbook Inverted Head & Shoulders (H&S) pattern on the daily timeframe, signaling a strong bullish reversal. The pattern completed with a clean breakout above the neckline at ₹1,820 , accompanied by a surge in trading volume (highest in 2 weeks). This validates buyer conviction and sets the stage for a sustained upward move.
Key Levels:
Neckline: ₹1,820
Resistance Targets:
Target 1: ₹1,910
Target 2: ₹1,960 (All-Time High, ATH)
Support Zone:1,750
T
CEAT Ltd | Cup and Handle Breakout | Targets Ahead CEAT Ltd has formed a classic Cup & Handle pattern on the daily chart, indicating a strong bullish continuation setup.
Breakout supported by increasing volume
Retest zone: 3,000 – 3,050 (Good entry opportunity)
SL: 2,870 (below handle support)
📈 Targets:
T1: 3,300
T2: 3,500
T3: 3,900 (measured move target)
💡 Bias: Bullish continuation | Swing to Positional
🕒 Timeframe: Daily Chart
Nifty Weekly ViewNifty is Forming either H&S or M pattern. If Nifty breaks & sustains 23870 and H&S pattern is confirmed then target will be 25750.
If Nifty breaks and Sustains below 23400 then M pattern is confirmed and in that case nifty may test 22800 level.
On chart please read H&S target as 25750.
possible INVERTED HEAD&SHOULDER in NIFTY50 soonThe Head and Shoulders consists of three distinct peaks:
Left Shoulder: A peak observed towards the end of November, followed by a downward movement.
Head: The highest peak formed around early January, indicating a strong upward movement before declining.
Right Shoulder: A smaller peak formed in late March, followed by another decline.
The neckline, which is a horizontal line connecting the troughs between the shoulders and the head, is positioned near 21,734.60 INR. This neckline is a criti
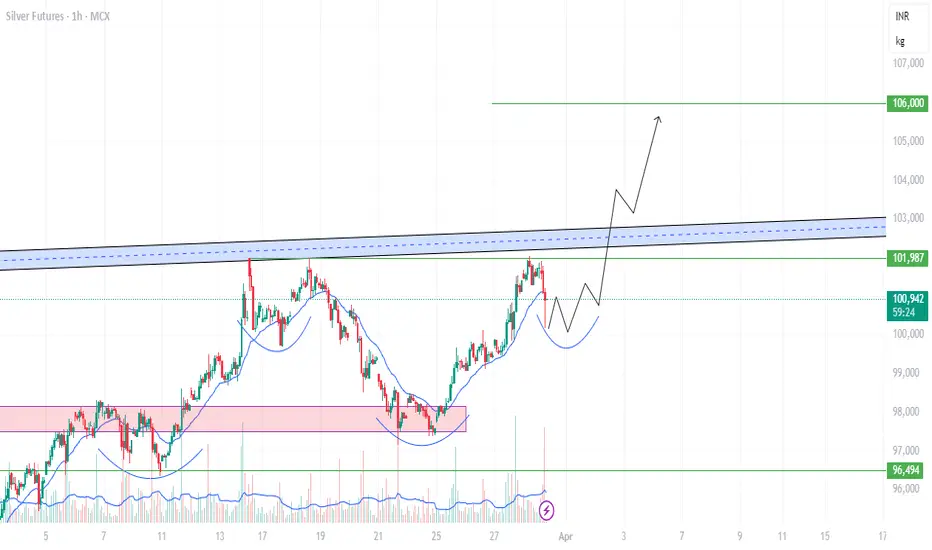
Inverse Head and Shoulder pattern In Silver ? New high Soon?chart shows an Inverse Head and Shoulders pattern in Silver Futures on the 1-hour timeframe.
The neckline (resistance) is marked by the blue zone, which, if broken with strong volume, could confirm a bullish breakout. The projected price movement (black arrow) suggests a potential rally toward ₹106,000.
A confirmation would come if the price breaks above the ₹101,987 - ₹103,000 resistance zone with volume.
Place SL below the right shoulder (~₹100,000) for a safe trade.
Bullish reversal in #RelianceThere is a formation of Bullish Head and Shoulders pattern on the daily chart of Reliance. The left shoulder and the head are already formed. The right shoulder is also half complete. There are good chances that the shoulder will complete.
The neckline is at 1320 which is around 100 Rs far from CMP of 1225.
#reliance #bullish
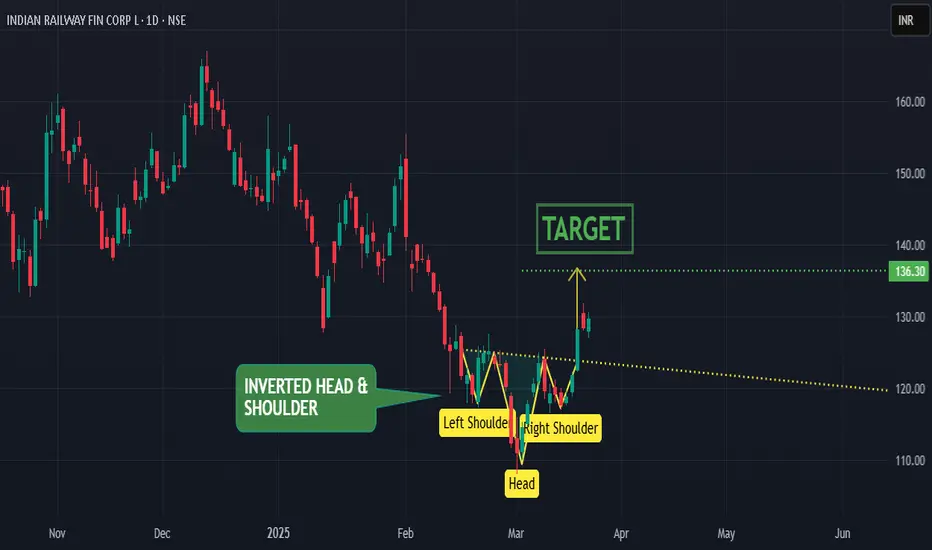
IRFC : BULLISH due to Inverted & Shoulder
INVERTED HEAD & SHOULDER -
the stock formed inverted head and shoulder pattern and broke out of the pattern indicating strong bullish momentum
BREAKOUT FROM STRONG SUPPORT-RESISTANCE LEVEL -
market has broken out of a very strong resistance level which was tested several times earlier
MACD -
macd line moved above the signal line indicating upward pressure
TARGET -
price will go till 136 level
Inverse Head and Shoulders pattern on the Silver Futures (MCX)The 4-hour Silver Futures (MCX) chart is showing a clear Inverse Head and Shoulders pattern, a bullish reversal signal. The pattern comprises a left shoulder, head, and right shoulder, with the neckline around the ₹97,800 - ₹98,300 region.
The price is currently testing this neckline, and a successful breakout above this level, confirmed by increased volume, could trigger a significant upward move.
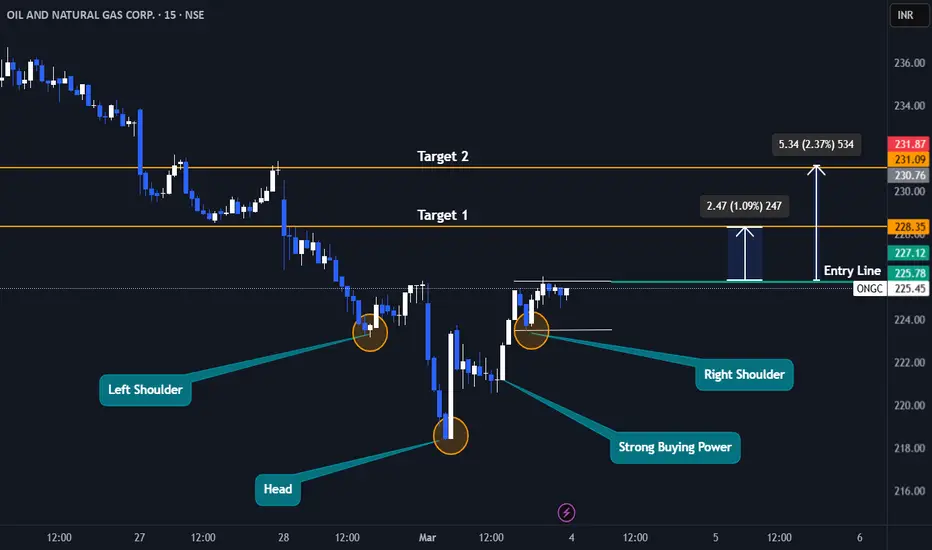
ONGC I OIL Burning Bright : Inverted H&S Pattern!!Hello Traders,
- ONGC is trading at a place called AOI (Area of Interest) A place from where price usually reverses.
- 218 levels is acting as a strong support pushing prices higher after a intraday low of about 3% making a big pin bar candle on 1D chart
- Inverted head and shoulder on 15m timeframe.
PRO TIP/-
The Entry Line is the Neckline of the inverted Head and shoulder.
Target 1:- 228
Target 2 :-231
Entry Criteria
Strong Close above Entry Line (225) 15mins TF
Stoploss
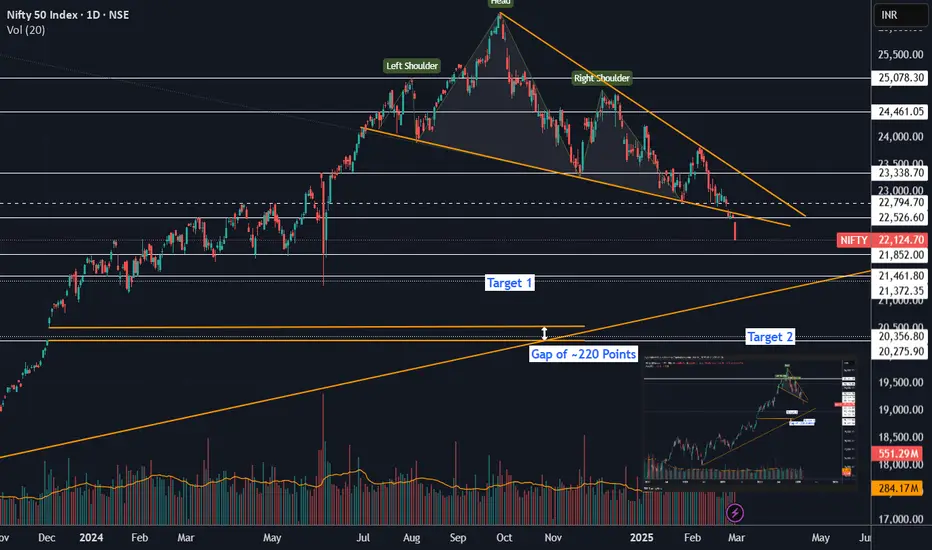
More fall expected in Nifty?NIfty has formed a bearish head and shoulder pattern, whose neckline has broken recently. Further, it was rejected from a downtrend line during its last swing. 21800 can act as next support, while 21450-21350 is the pattern target range as well as support zone. If it can't hold these levels, a fall to 20350 levels is imminent to cover the gap formed earlier. Interestingly, this zone is also the target indicated by the pattern.
But can it reach directly to these levels? It may not. Its very com