NIFTY 50 - HEAD & SHOULDER - WEEKLY CHART.NIFTY50 is making Head & Shoulder pattern at weekly chart.
23350 is a Strong Support, it is at an old lower trendline Support too. We took the support at this lower trendline even on 4th June - Election Result Day. Before that in the last week of October 2023.
Since 10% correction has already happened so there is strong probability of a Reversal from this level(23350), but in case Nifty breaks this level then there is a probability of it going down further, here I am just keeping the current m
Head and Shoulders
Is TURBOUSDT Poised for a Bullish Breakout or Bearish Move?Yello, Paradisers! Is TURBOUSDT about to break out into a small bullish move, or are we looking at a potential reversal? Let's dive into the analysis to see what the charts are telling us!
💎TURBOUSDT is currently forming an inverse head and shoulders pattern, a classic bullish signal. This pattern, coupled with the recent bullish reversal indicators, significantly increases the likelihood of an upward move.
💎 If the candle closes above resistant zone, the probability of a bullish move increase
UNIUSDT: Are We on the Verge of a Bullish Breakout?Yello, Paradisers! The UNIUSDT chart is shaping up with some bullish signals, but will they lead to the rally we're looking for? Let’s dive into the setup.
💎UNIUSDT is currently displaying a strong bullish market structure, forming an inverse head and shoulders pattern. This classic formation is known for signaling potential trend reversals—if it plays out, it could lead to a notable move upward.
💎If UNIUSDT breaks out and closes a candle above the resistance zone, it will confirm this patter
Marksans Pharma SL 1Hr candle close only, Target Trigger Price
All detail for chat. good entry at mark price only. and must stoploss minimum risk and good profit. risk ratio 1:1 to manage modified SL. This is not call, Just my idea. Please understand your risk and take full responsibility of your actions
HEAD & SHOULDERS PATTERN IN NIFTY. TIME TO SELL AGAIN ?Symbol - NIFTY50
CMP 24800
Nifty50 has turned its trend from bullish to bearish & sideways making lows - lows on daily time frame. We can see a Head & Shoulders pattern getting formed on daily TF in Nifty. Such patterns on larger time frame don't usually fail. Nifty is currently trading near neckline of this pattern. Breakdown & sustaining below this neckline zone 24730 - 24690 will get this pattern activated & we can see big target towards downside.
Target on downside can be 23370
P.S. : My
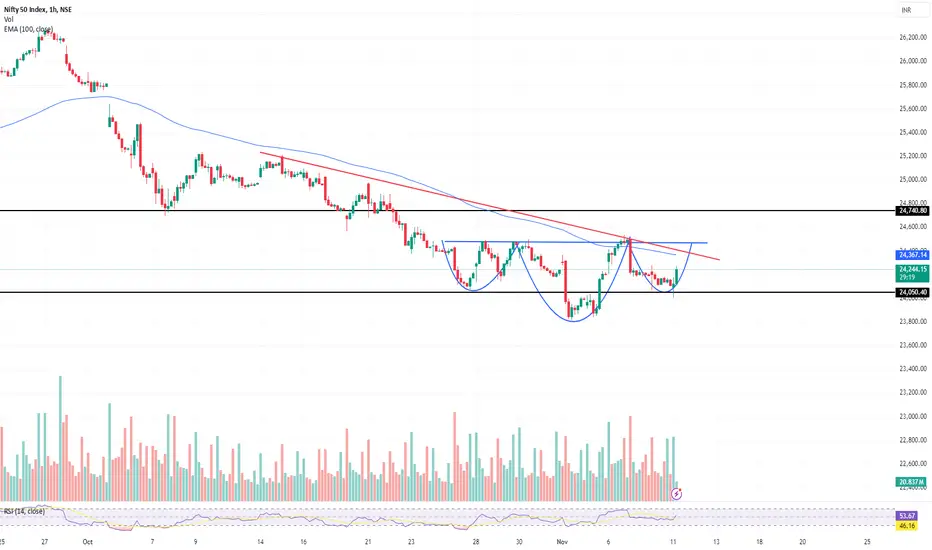
NIFTY making In IHNS with Trendline Supporthello everyone,
NITY Spot 24250 taking support from 24000 making in pattern inverse head and shoulder there is hurdle EMA 100 and trendline resistance near 24370-23430 __as RSI positive divergence reversal can expect still bearish trend on larger timeframe.
#NIFTY50 - 8TH NOVEMBER!!NSE:NIFTY
#NIFTYBANK ⚡
Observe, understand, then implement 👍🏻
Chart contains support and resistance levels (understand how it works 👇🏻)
Support and resistance are key concepts in technical analysis used to identify potential price levels where assets may reverse or stall.
Support:
-Definition: A support level is a price point where buying interest is strong enough to overcome selling pressure, preventing the price from falling further.
- Indicators: Support levels can be identi
HEAD&SHOULDER almost completed in NIFTY50Overview
The head and shoulders pattern is nearing completion, accompanied by positive RSI divergence, indicating the market may have bottomed out.
Key Observations
Head and Shoulders Pattern:
Suggests the end of the downtrend.
Indicates a potential upward trend.
Positive RSI Divergence:
Shows bullish signal with higher lows on the RSI and lower lows in price.
Market Projections
Final Correction Phase:
Nifty at 23700.
Breakout above 24600 confirms bullish momentum.
Conclusion
These technical
Reliance is completed a Head and shoulder pattern.NSE:RELIANCE
Reliance has completed a Head and Shoulders pattern, suggesting a potential target of 1280 based on the measurement from the head to the neckline. This target could act as strong support for a buy opportunity. However, breaking the current support level at 1325 is crucial for this to happen. Keep an eye on how it moves around this level. Timing will be key.
Aether Ind forming H&S on weekly charts.A perfect Head and shoulder pattern formation in Aether Ind.
Aether Industries is engaged in the production of intermediates and specialty chemicals. Products for Pharmaceutical, agro chemical, material sciences, coating, photography, additive and, oil and gas, segments of chemical industry.
MCap = 10491 Cr
P/E Ratio = 103
The company has grown in sale by 30% since September 2021 while the expenses has gone up by 40% from 101 Cr to 142 Cr. Opertaing profits are down by 1% (Sept 2021) to 28%
Is SUIUSDT Ready for a Bullish Surge? Key Levels to Watch NowYello Paradisers! Have you been watching SUIUSDT closely? If not, you might be missing out on a major opportunity! SUIUSDT has just broken out of a critical resistive trendline, signaling potential for a bullish move. But there's more to the story...
💎We’ve also seen a Change of Character (CHoCH) and the formation of an inverse head and shoulders pattern. This combination often points towards increased bullish momentum. However, before we can fully commit to a bullish outlook, there are a few k
banknifty sell on rise 51114 good resistance and 50500 support51114 is working as cip
if open gapup above 51114 bulish potential target 52000
if opened flat can see side way market wait for 50400 broken can see blood bath in banknifty
it can touch 49712
if open gapdown below 50400 wait fo sell on rise, sell on ticks market dont long in any case
we can check 52000 pe if cip take place in 52000 pe it will cause good fall.
wait for 51114 or 50500 broken between non trading zone
sell on rise
Bank Nifty - Formation of Bearish Head and ShoulderBank Nifty index is forming bearish head and shoulders pattern. Here are the key levels mentioned below:
Neckline : 50000 (activation point for the pattern)
Immediate Support: 49700 (200 EMA)
Potential Target: 46500 (if price pierces below 200 EMA)
Trend Breakdown: Noted breakdown of the uptrend line since October 23.
Make sure to keep an eye on these levels and monitor price action closely as it approaches them! If you have any more insights or questions about trading strategies, feel
Bank Nifty: Head & Shoulder Pattern.Bank Nifty: Head & Shoulder Pattern.
Index nicely shaped as Bear Flag (2 week long).
Potential Head & Shoulder pattern (Top) is also shaping up.
Levels mentioned on chart & Given targets seems achievable.
Plan your trade accordingly.
Views are for ‘’EDUCATIONAL PURPOSE ONLY’’, trade at your own risk.
"Trade what you see, Not what You Think"
Happy Trading(:)