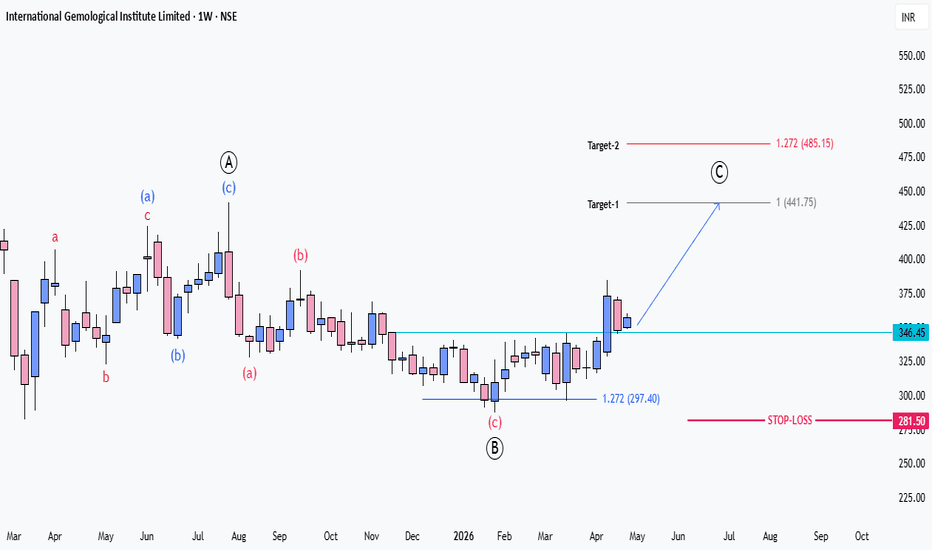
IGIL : Strong Consolidation Breakout and re-testIGIL stock was consolidating in the same range from NOV-2025 and it has given strong breakout and break-out level also got tested.
Stock fundamentals are very strong and stock could reach 440 levels in shorter period of time.
Note : This idea is purely for educational and learning purpose.
Head and Shoulders
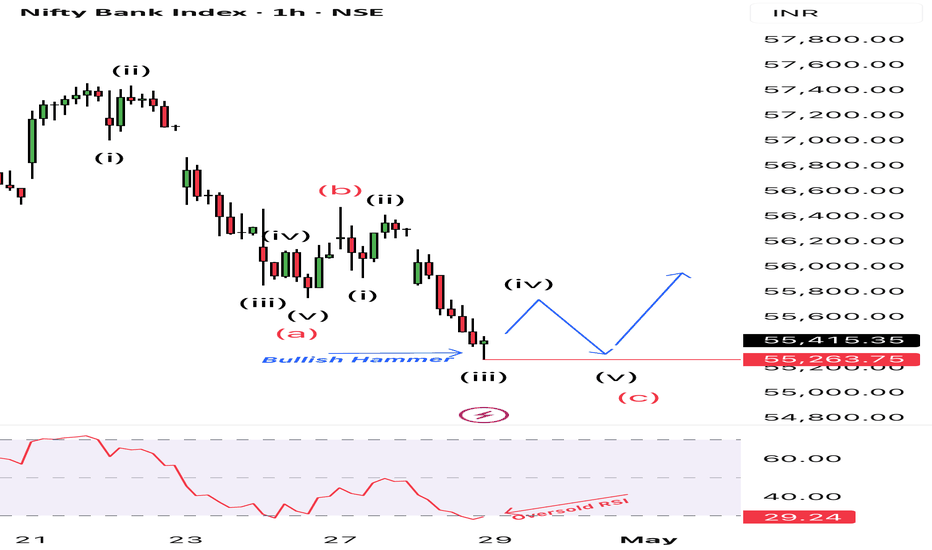
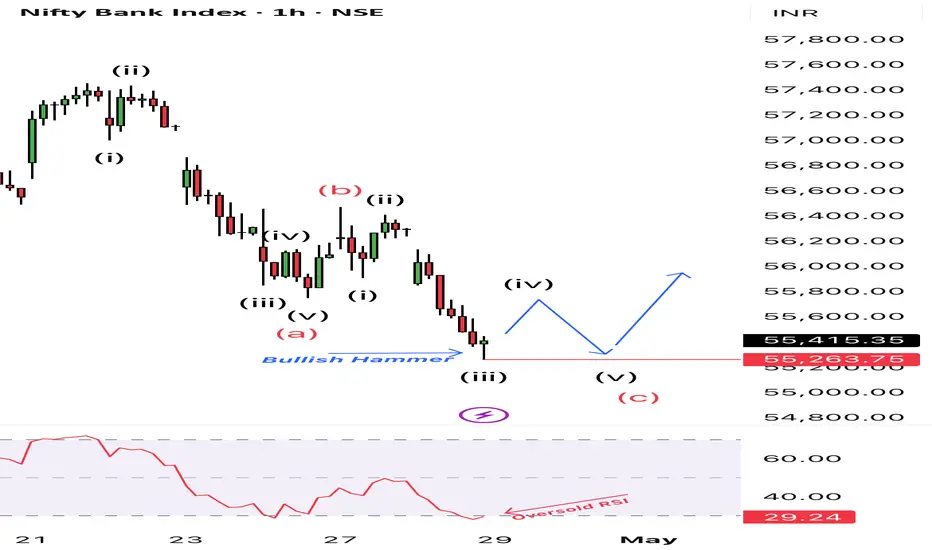
Nifty Bank: Relief Rally SetupNifty Bank Index (1H) Technical Update:
Price action indicates sub-wave (iii) exhaustion within a broader wave (c) correction. A bullish hammer has formed at 55,263.75 support, confluencing with an oversold RSI (29.24).
Anticipating a tactical wave (iv) counter-trend retracement before a final wave (v) decline.
Invalidation for this immediate relief bounce is strictly defined below the hammer wick.
Disclaimer: Not a buy/sell recommendation.
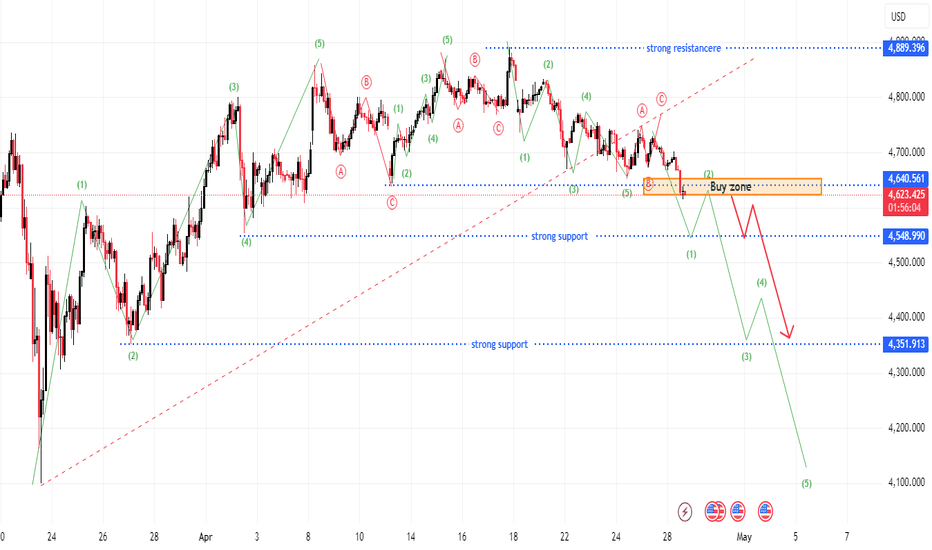
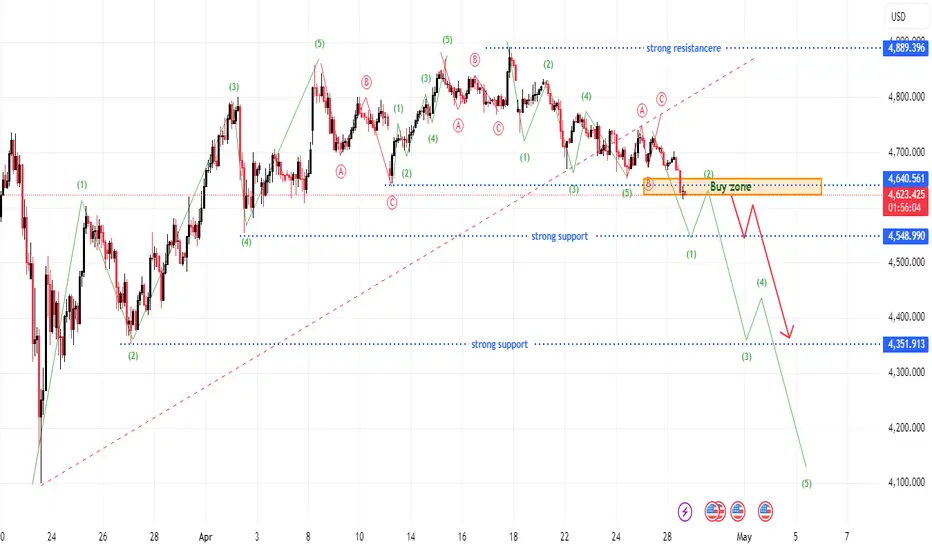
XAUUSD: Buy Zone FailingGold is clearly weakening in the short term as selling pressure returns and pushes price below the 4630 area. From Kelly’s perspective, this no longer looks like a minor pullback. It is starting to resemble a continuation structure, with the near-term support zone beginning to lose its effect.
Technical structure
On the chart, price has slipped below the recent reaction zone and is now testing the 4640 buying zone from a weaker position. What stands out is that the market has not been able to
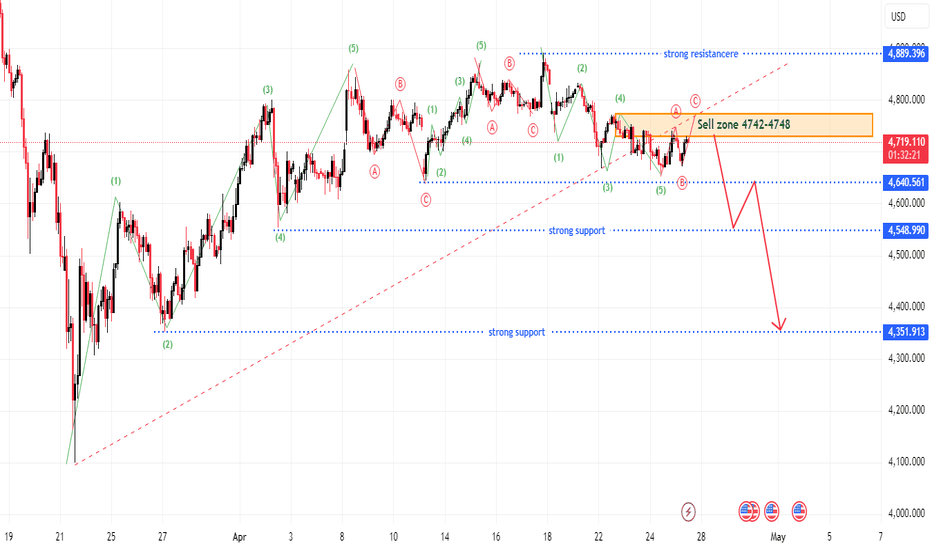
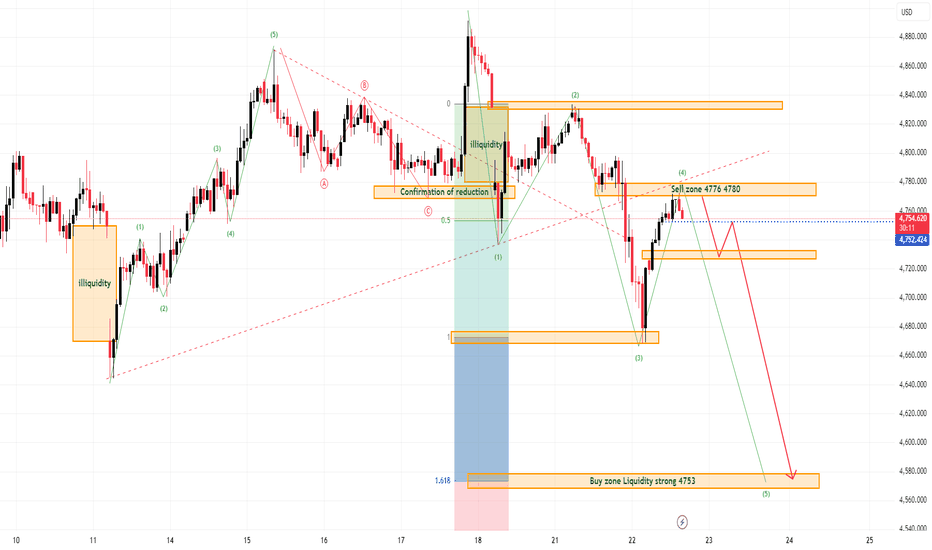
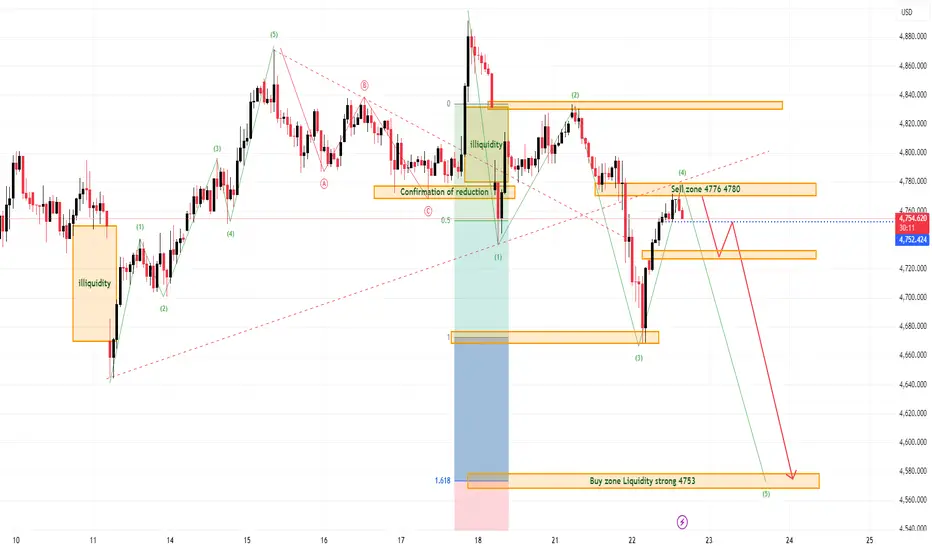
XAUUSD: Selling Wave C Near Sell ZoneGold is pushing into a sensitive area, but from Kelly’s perspective, the current recovery is more likely the final short wave C of a corrective structure rather than the start of a sustainable bullish trend. What makes this zone especially important is that price is approaching the 4742–4748 sell zone, where the short-term structure may complete before the market begins a new cycle on the higher timeframe. Technical structure The current structure shows gold still reacting below near-term resist
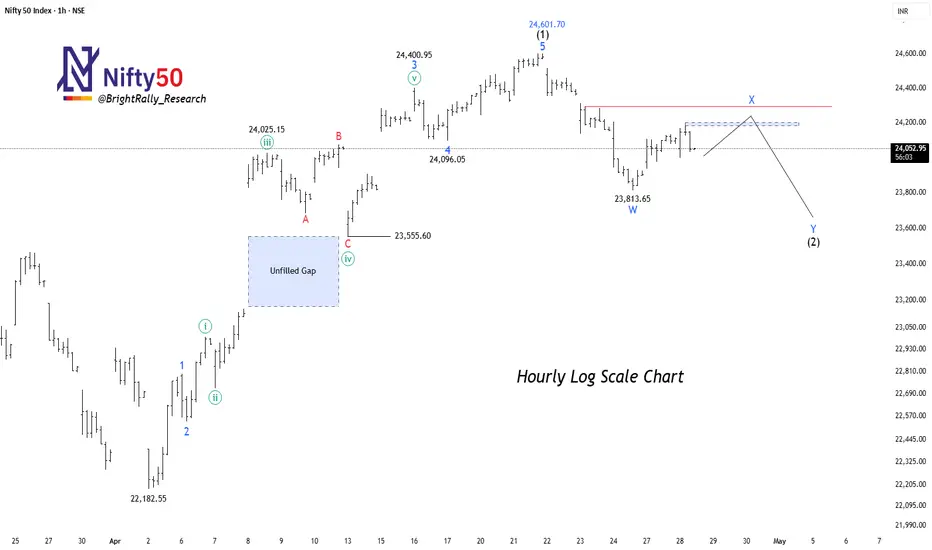
NIFTY 50 - Rejection Zone Building Potential Drop AheadNifty 50 is showing signs of slowing down after a strong up move. Price is now struggling near the 24,200 – 24,300 resistance zone, which suggests buyers are losing strength. The recent movement looks sideways with slight weakness, so the market may not continue upward immediately.
If price fails to break this resistance, it can move down toward 23,800 support, and possibly even the unfilled gap near 23,500 – 23,600 . However, if it breaks above 24,300 with strength, then the downside vi
NIFTY 50 - Base Formation Before Recovery?Nifty 50 appears to be in a corrective phase after completing a larger advance near the 26,373 zone. The recent sharp decline into the 22,955 region appears to be a potential wave (Y)/(v) exhaustion area, where selling pressure may be stabilizing. Price is now attempting to reclaim the 23,750 – 24,150 region, which acts as an important pivot. Holding above this zone could support a recovery move toward the first resistance cluster near 24,550 (R1), while a stronger breakout may open the
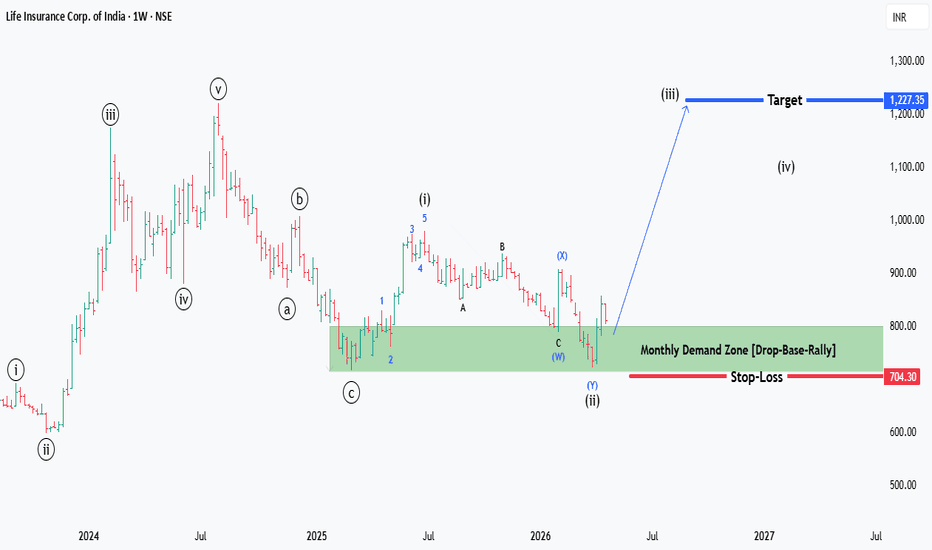
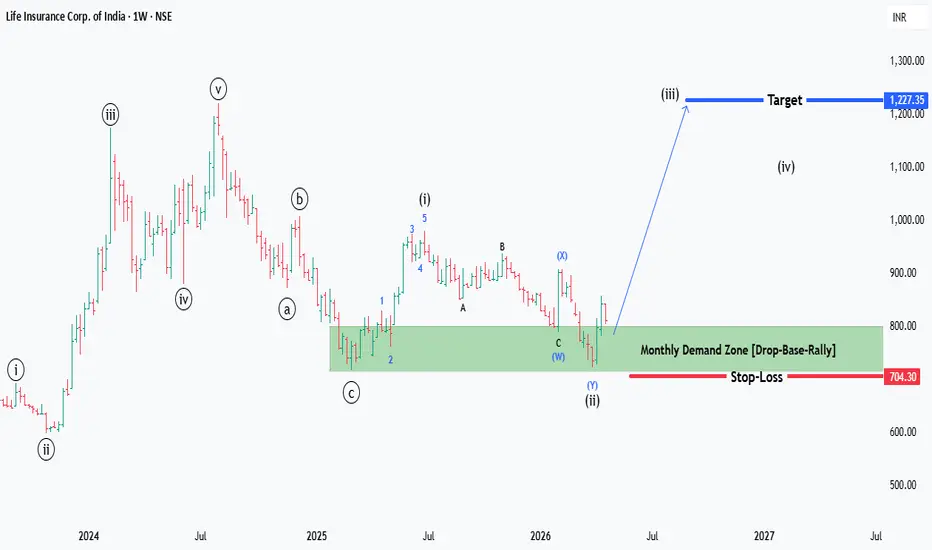
LIC OF INDIA : 3rd of 3rd Elliot Wave started ??Note : This idea is only for Learning and educational purpose and It's not a buy or sell signal.
LIC of India completed one big Elliot wave Cycle (1-2-3-4-5 & A-B-C) and also Completed one Subwave (1-2-3-4-5 & a-b-c) and now it's heading for 3rd of 3rd Elliot wave.
Immediate target is new lifetime high and it can double from here.
It's taking support from Monthly Drop-Base-Rally Demand zone and there are no fresh supply zones available on higher side.
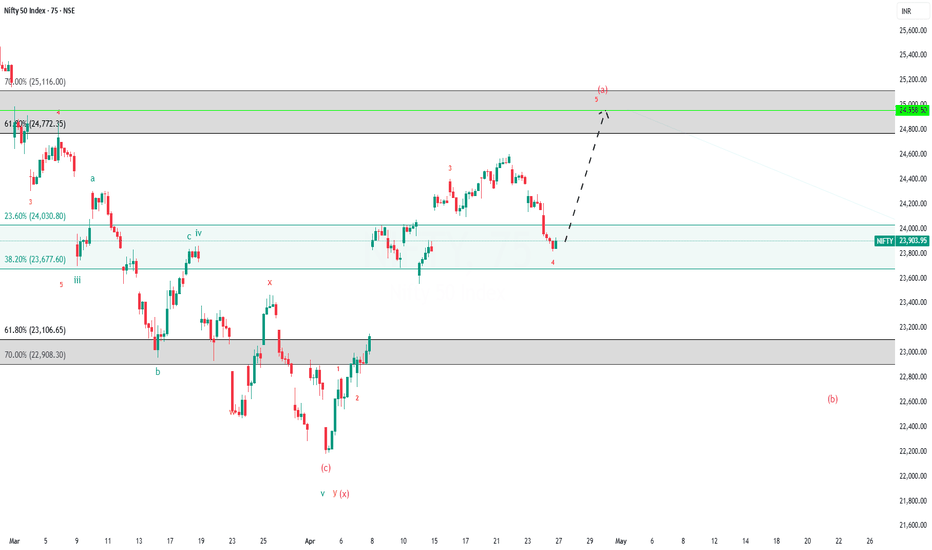
Nifty Analysis for the week 27 April to 01 May, 2026Wrap up:-
As mentioned earlier, we are in wave y of x of 4 of major wave 3.
In wave y, a lower degree impulse (i.e. wave a) is forming in which wave 1 was completed at 22782 and wave 2 at 22719.
Now, wave 3 is completed at 24400, wave 4 at 23813 and wave 5 is in progress which is expected to be completed in the range 24772-25116 (which is fresh next resistance level).
What I’m Watching for the week 27 April to 01 May, 2026🔍
As, fresh upside immediate resistance which lies in the zone 247
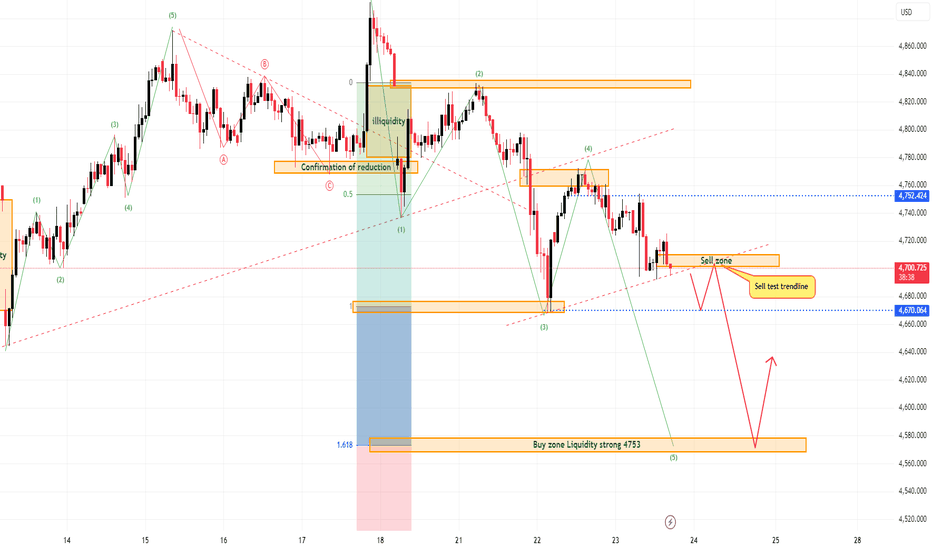
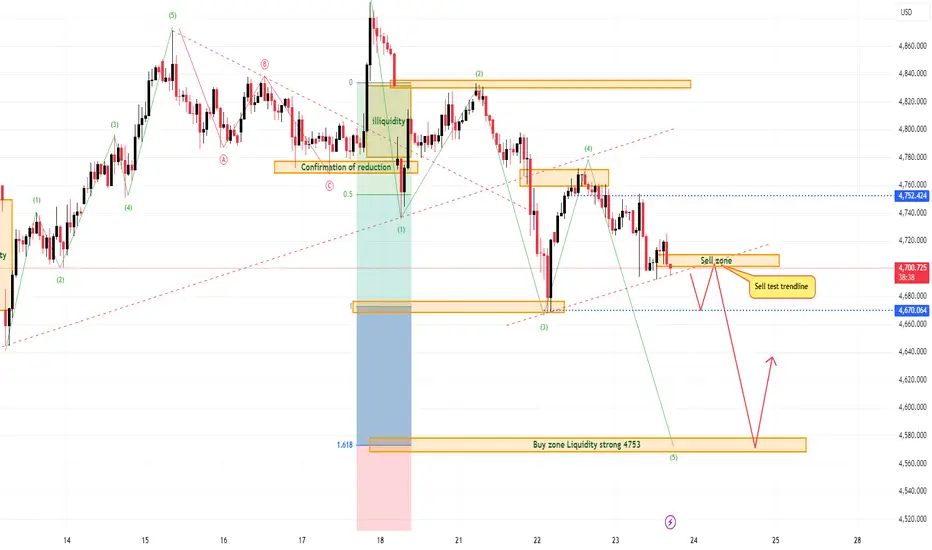
XAUUSD: Rebound Hits Sell ZoneGold is pushing back into a sensitive resistance area, but the rebound still does not look strong enough to shift the broader structure back into a bullish trend.
From Kelly’s view, this move still reads more like a corrective recovery than the start of a clean upside reversal. Price is now testing the 4695–4710 sell zone, while also reacting around a descending trendline. That combination makes this area important, because it is where the market may decide whether the rebound can extend furthe
Kelly’s Market Insights XAUUSDGold’s Elliott Wave Sequence – The Final Countdown to Support?
Hello everyone, it’s Kelly here. 🌹
Gold has been keeping us on our toes lately, hasn't it? If you’ve been following my charts, you know I’m a firm believer in the rhythm of the market. Right now, the H1 chart is dancing to a very specific tune—the Elliott Wave correction. We aren't just looking at candles; we’re looking at the exhaustion of momentum.
Decoding the Elliott Structure
Based on the current H1 wave count, we are
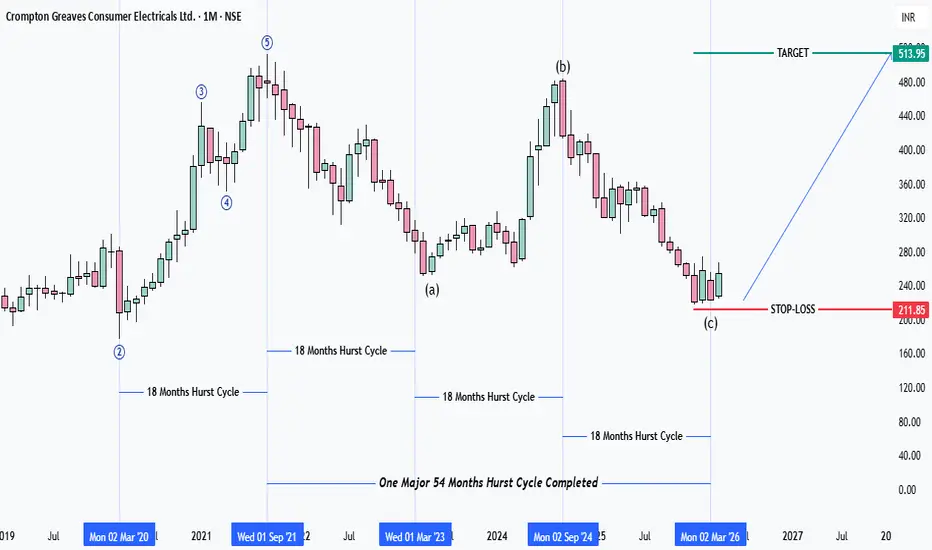
Crompton Greeves Ready for Next Bull Run ??Analysis done using Elliot Wave, Neo Wave and J.M.Hurst Cycle Theory.
Stock has completed one Major Elliot wave Cycle and Hurst 18 months and 54 Months cycle.
Fundamentals are goo with DII's holding more than 65% in stock.
Note : This idea is only for Educational and learning purpose and it's not buy or sell signal.
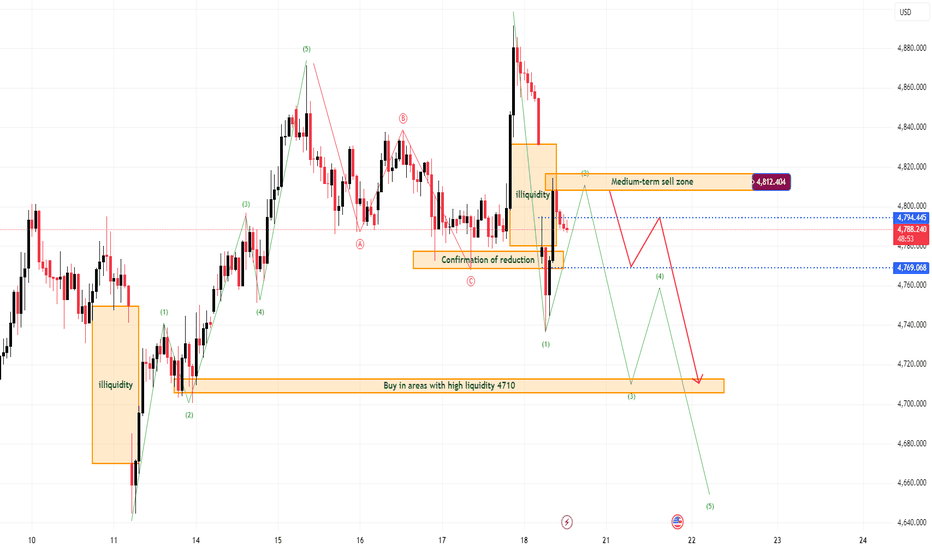
XAUUSD — Wave 2 meets resistanceWave 2 rebound is running into resistance again
Gold is moving into a very sensitive area where the current recovery still looks more corrective than impulsively bullish. For Kelly, this matters because the chart is not reclaiming trend yet — it is only pushing back into a medium-term sell zone, which keeps the downside scenario active unless buyers can prove much more above current levels.
The political backdrop is also adding another layer of uncertainty. Resistance to Trump’s Fed-chair plan
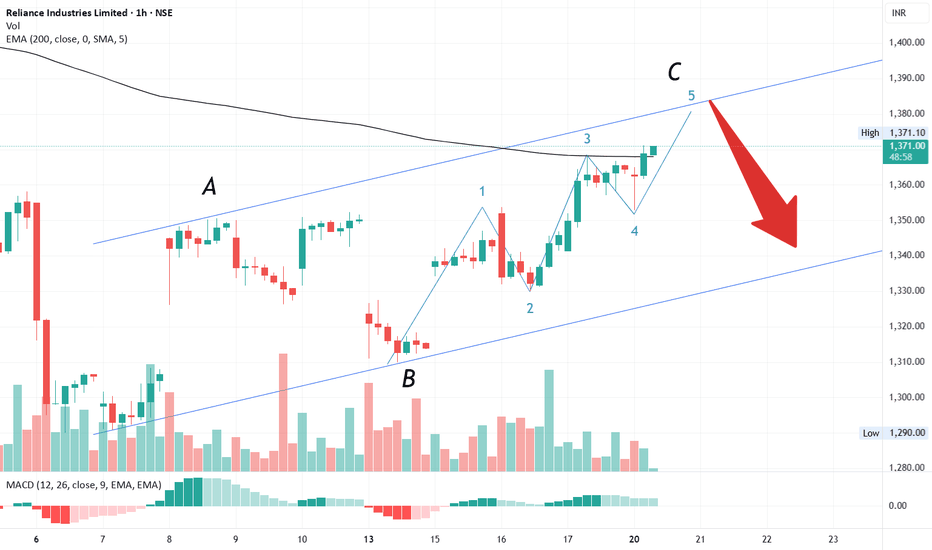
#RELIANCE selling is coming🔥 Reliance: Zig‑Zag Correction in Play ⚡️
Reliance is currently moving through a zig‑zag correction 🔄📊:
🔹 A wave: Dropped to 1350 📉
🔹 B wave: Retraced less than 61.8% 🔄
🔹 C wave: Now unfolding 📊⚡️
👉 Breaking down the C wave:
✅ Out of 5 subwaves, 4 are complete 🎯
⏳ Currently in the 5th subwave, which can push up to 1380 🚀💥
⚠️ Trading Insight: Wait for confirmation ✅ — once complete, price is likely to reverse sharply 📉 and retest 1280–1250 levels 🕳️💎
---
🔥 Takeaway for traders: Reliance’s z
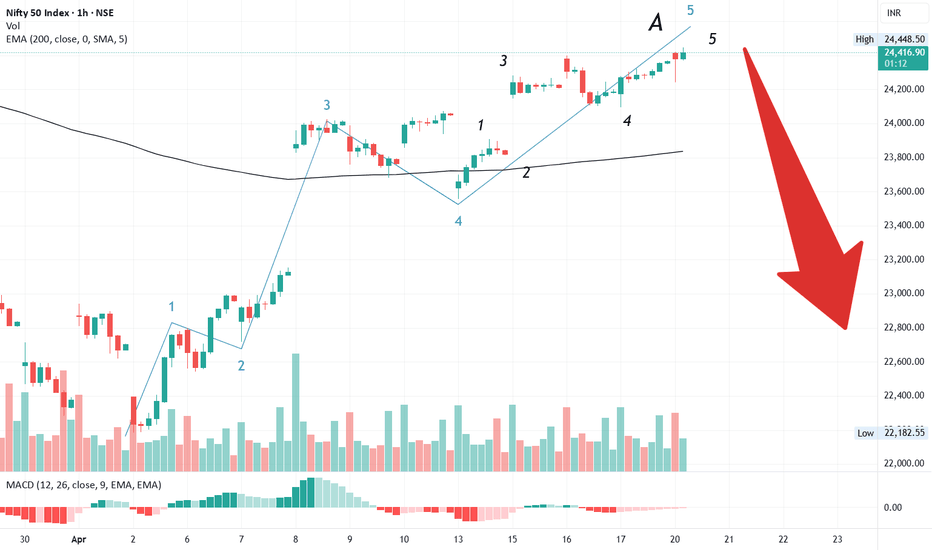
#NIFTY 5th wave complete ⚡️📉 Nifty: 5th Wave Finale – Big Move Loading! 🔥💥
After touching a low of 22,188 🕳️, Nifty kicked off its corrective bounce:
1️⃣ Wave 1 (2 Apr): High at 22,761 📈✨
2️⃣ Wave 2: Running flat correction 🔄📊
3️⃣ Wave 3: Explosive rally to 24,025 🚀💎🔥
4️⃣ Wave 4: Flat correction ending at 23,555 📉🌀
5️⃣ Wave 5: Now unfolding ⚠️⚡️ — currently in its final subwave 🎯⏳
👉 With the 5th subwave nearly complete, the chart is screaming:
📉💥 A sharp fall is likely, filling the gap from 8 Apr 🕳️📊
💡 Trading Insig
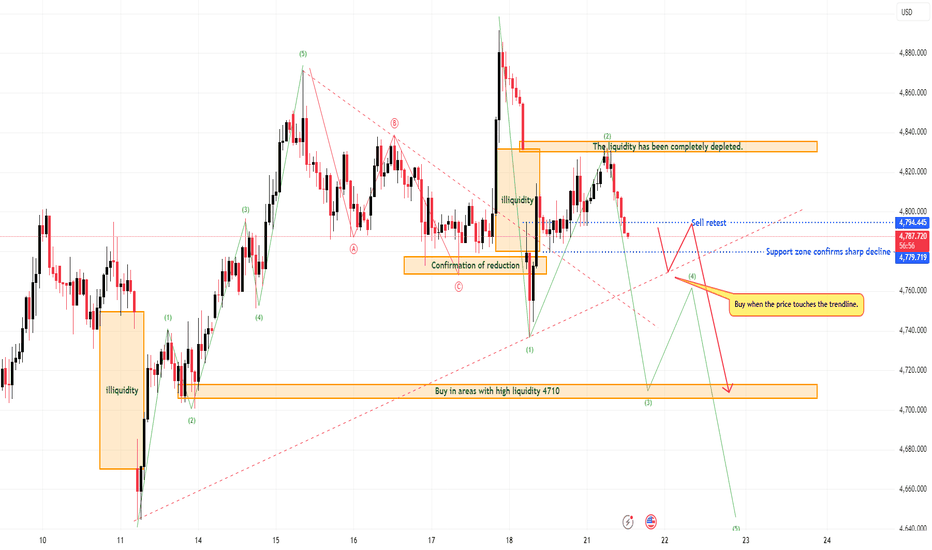
XAUUSD Wave 2 rebound hits resistanceXAUUSD — Wave 2 rebound is reaching resistance, and sell-side pressure may return soon
Gold is moving into a technically sensitive area where the current recovery no longer looks like the start of a fresh bullish trend. From Kelly’s view, this rebound is better read as a wave 2 corrective move, and the market is now approaching the zone where sellers may begin to step back in.
That distinction matters.
Because if this is truly a wave 2 recovery inside a broader bearish structure, then the nex
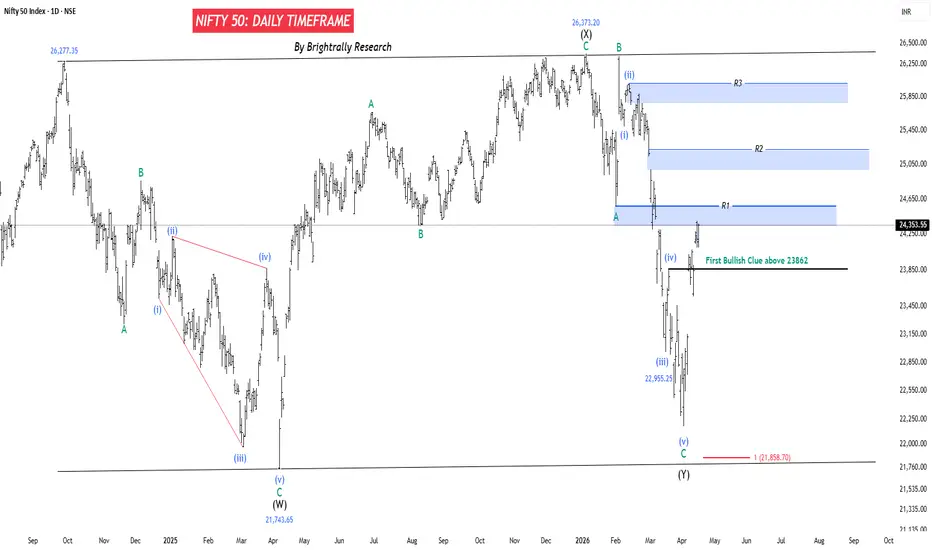
NIFTY 50 - Recovery Attempt but Trend Still Unclear
Nifty has fallen sharply, and that fall looks mostly complete. Now it is trying to bounce, but the bounce is still weak. For now, this is just a short-term recovery, not a clear uptrend. The market needs to go above 23,860 to show the first real sign of strength. Until that happens, upside moves can fail.
On the upside, there are clear resistance zones:
Around 24,350 (R1)
Around 25,100 (R2)
Around 25,900+ (R3)
On the downside, if the market fails to hold and falls again, it can
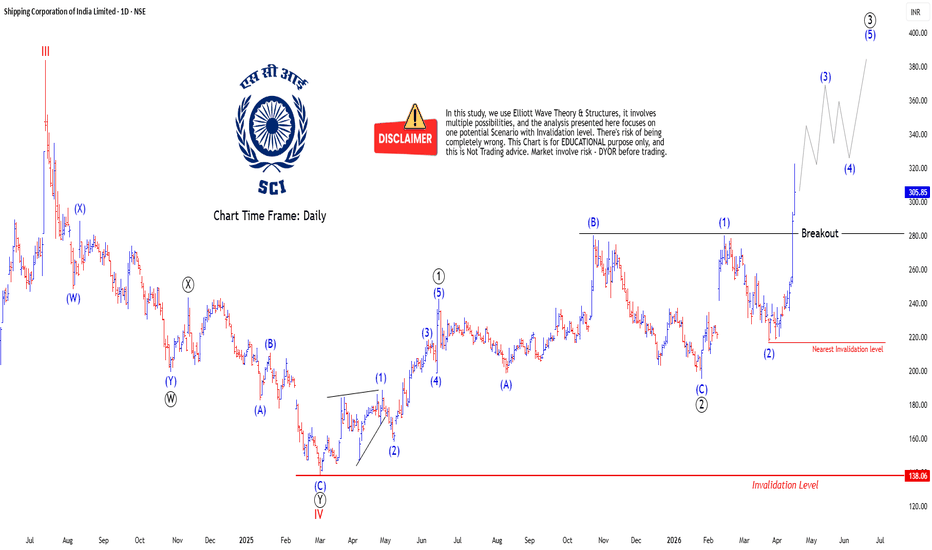
Elliott Waves: SCI Ltd Bullish Structure intactHello Friends, Welcome to RK_Chaarts,
Today we’re looking at the Shipping Corporation of India Ltd chart from an Elliott Wave perspective. The structure looks very clear.
Cycle degree Wave III ended at the July 2024 high, and Cycle degree Wave IV ended at the March 2025 bottom. After that, we started unfolding Cycle degree Wave V, which should have five subdivisions of Primary degree.
Out of those five, Wave ((1)) topped in June 2025. Then Wave ((2)) came as an expanded flat and bottomed in J
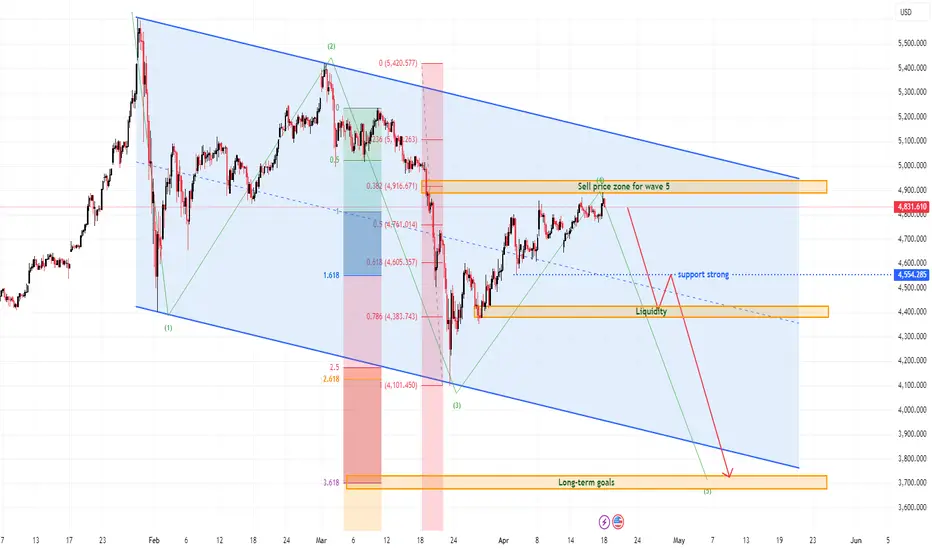
XAUUSD — Resistance now key focusXAUUSD — Wave 5 Sell Zone Now Becomes the Weekly Decision Point
Gold is moving into next week with a very sensitive structure on the chart. The broader trend is no longer in clean expansion mode, and price is now testing a zone where the market must decide whether this is only a temporary rebound inside weakness, or the start of a deeper selloff.
For Kelly, this is not the kind of chart to chase emotionally. This is the kind of chart where structure has to lead.
Technical structure
On the ch
PFC Ltd: Accumulation Building Below Supply – Breakout Ahead?After the sharp fall from 580 , the price appears to have completed a W-X-Y corrective structure near 329.90 . Since then, the stock is gradually moving higher within a descending channel .
A few early positive signs are visible:
RSI has reclaimed the 50 level and is holding above it, indicating improving momentum.
Volume shows quiet accumulation , suggesting gradual buying interest.
Price is approaching an important supply zone near 440 .
Trading Approach
Aggressive entry c
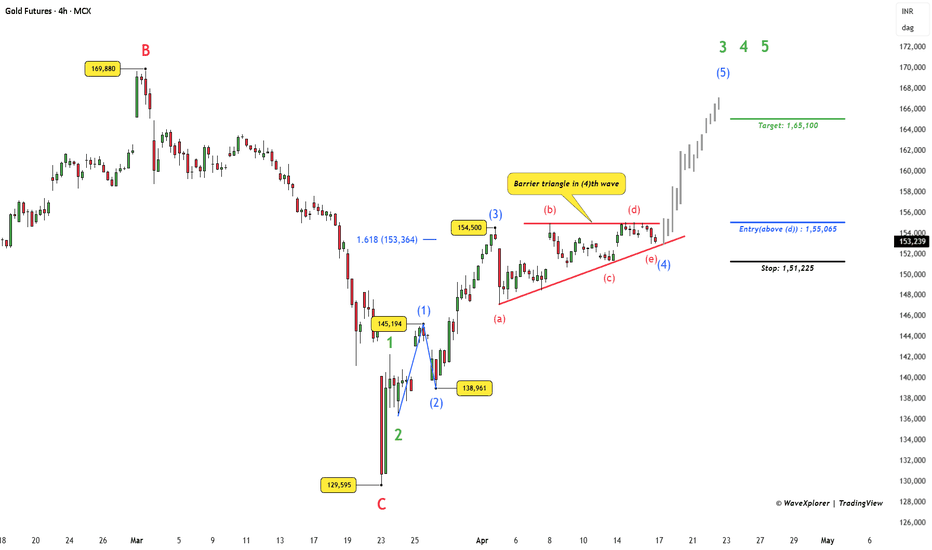
Gold (MCX): Trading the Barrier Triangle Compression BreakoutTechnical Context
Gold Futures (MCX) are currently displaying a powerful structural sequence on the 4-hour chart. Following a major market low at 129,595 , the asset has built a nested impulse. This indicates a primary uptrend is gaining heavy momentum through a sequence of higher highs and higher lows.
The most recent surge peaked at 154,500 , striking a key mathematical extension. Since that peak, price has entered a consolidation phase known as a Barrier Triangle . In this pattern, sell
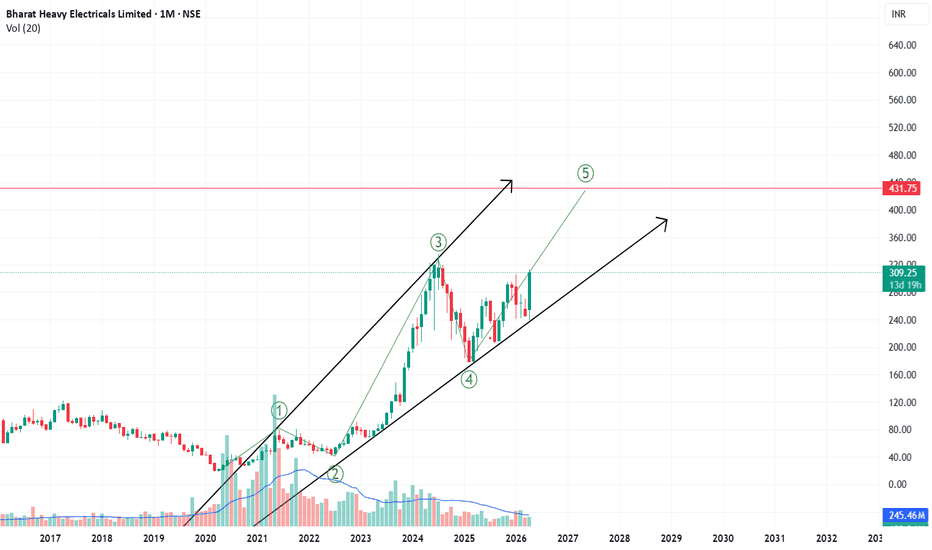
BHEL | Elliott Wave Setup – Wave 5 in Progress | Target ₹430
BHEL is showing a textbook structure based on Elliott Wave Theory, currently transitioning into Wave 5 after a healthy Wave 4 correction.
Structure Breakdown:
* Wave 1–2: Early accumulation and shakeout phase
* Wave 3: Strong impulsive rally with expansion in price and momentum
* Wave 4: Controlled pullback, respecting trendline support (no structural damage)
* Wave 5: Initiated – higher lows and breakout attempt visible
Technical Confluence:
* Price sustaining inside a rising channel
* Hig