Head and Shoulders
Inverted Head and Shoulders Bullish Pattern - "Gokaldas Exports"
✅ Small cap stock
✅ Above 20 moving average (blue line)
✅ Near Breakout Point
✅ Bullish Pattern (Inverted Head and Shoulders)
✅ High ADR
✅ Good Liquidity
⚠️ Earnings Release Date soon (6th August)
Note - Volumes on 11th July were extremely high 4.6M compared to ~300K average daily volume.
Symbol - NSE:GOKEX
Disclaimer - Sharing this for my own research and study. I am not SEBI certified.
Aarti Industries Ltd: Inverted H&S Pattern.Aarti Industries Ltd: Inverted H&S Pattern.
Breakout soon stock
75 % upside potential
Stock trading near the neckline and low volume activity in Right Shoulder.
Levels mentioned on chart & Given targets seems achievable.
Plan your trade accordingly.
Views are for ‘’EDUCATIONAL PURPOSE ONLY’’,trade at your own risk.
"Trade what you see, Not what You Think"
Happy Trading(:)
Jublfood has beautiful rising breakout from low levelsJubl food has beautiful breakout pattern. Looks like it’s ready for bigger moves. Follow the levels on the chart.
Keep this in mind. Options is a dangerous instrument to play. Please do not go wild on anything unless you know exactly what you doing. Even though your direction is right still you tend to loose in option buying. And market can always prove me wrong and i take that rights too. Experience traders also fail in this market. Only risk management will give you an edge. Don’t take any t
Hathway - Inverse/Reverse Head and ShoulderCMP - 23
TGT - 42
⚡️Disclaimer: Any of my posts should not be considered as a Buy/Sell/Hold recommendation. This analysis is for educational and learning purpose only⚡️
Description:
Reverse head and shoulders chart pattern is a bullish chart which signals a potential reversal of a downtrend. It is the opposite of the head and shoulders chart pattern (which is a bearish formation)
The reverse head and shoulders chart pattern consists of three (3) troughs (u-like chart formation):
1) The first
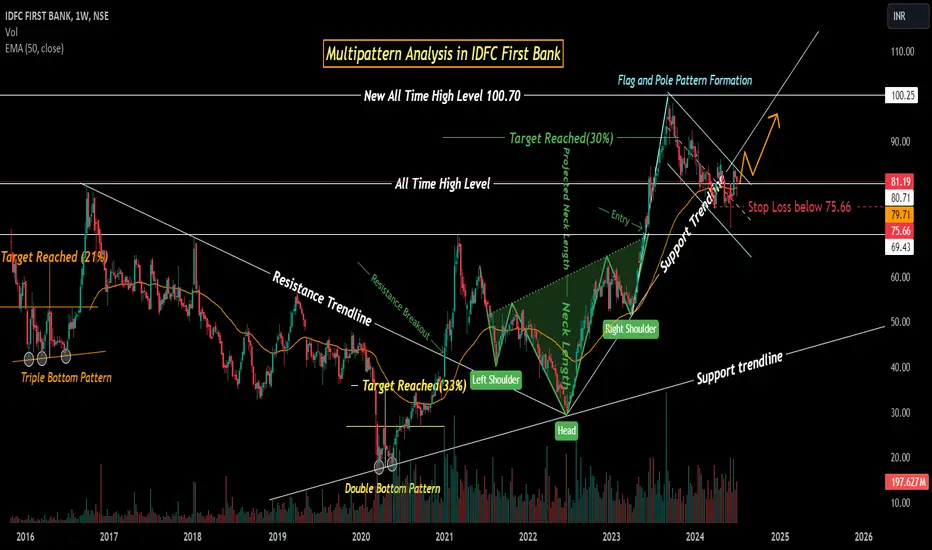
Multipattern Analysis on IDFC First Bank!NSE:IDFCFIRSTB Analysis!
Multipattern Analysis on $NSE:IDFCFIRSTB!
Analysis on a Weekly Timeframe!
Analysis:
I have done the overfall analysis of IDFCFIRSTB since its inception. It looks very complicated but if you know all the patterns it is just like anything. I have combined all the patterns with the Support and Resistance Trendline. Don't get confused. Read the chart thoroughly and you'll get a better idea of where to enter and where to exit. As you can see in Chart 3 most important re
Tata Steel (Educational Idea)Tata Steel in time correction
Will pass the time in between range of 150 - 176...
Swing traders can grab the swing between these levels..
Long termers can add this gem from current levels..
Price action::
============
Looks like Head & shoulders pattern
Multiple shoulders on the left side..
Now right side shoulder formation in cards ....
Testing these support 158 make this levels very weak and if it breaks this levels may lead to fall of another 10 to 15 pts ...
But my strong feeling stock
Kokuyo Camlin Ltd: Inverted H&S Pattern.Kokuyo Camlin Ltd: Inverted H&S Pattern.
36 % upside potential
Stock breaks out the neckline with huge volume and trading above it
Levels mentioned on chart & Given targets seems achievable.
Plan your trade accordingly.
Views are for ‘’EDUCATIONAL PURPOSE ONLY’’,trade at your own risk.
"Trade what you see, Not what You Think"
Happy Trading(:)
India Glycols - Inverse head and shoulder breakout India Glycols
Fundamentals
PEG Ratio - 3.4
PE 18 , less than Industry PE of 32
Int coverage ~3. D/E ~0.66
ROE, ROCE - Accepatable at 8-10%
Recent profit growth is very good
Technicals
Inverse head and shoulders pattern in weekly charts
Decent volumes in recent weeks
and CMP near ATH of 1088 and at 52WH
Target 1200>1300
TATA MOTORS at 15min - Inverted H&S PatternTATA MOTORS has made Inverted H&S Pattern at 15min chart. I found it little late, but still has potential.
This trade involves identifying a pattern, drawing the right trendline, and finding an opportunity during the market recovery immediately after a sharp fall caused by news.
For learning and education purposes only.
Power Finance Corp - Breaking OutInvestors, take note! Power Finance Corporation is currently showcasing a significant technical pattern that could influence your investment strategy:
Head and Shoulders Breakout: Power Finance Corp has exhibited a clear Head and Shoulders breakout. This classic chart pattern is often viewed as a reliable indicator of a potential major reversal.
Why This Pattern Is Important: The Head and Shoulders pattern is one of the most trustworthy technical indicators used by traders. A breakout from
IKIO Lighting Ltd: Inverted H&S Pattern.IKIO Lighting Ltd: Inverted H&S Pattern.
30 % upside potential
Levels mentioned on chart & Given targets seems achievable.
Plan your trade accordingly.
Views are for ‘’EDUCATIONAL PURPOSE ONLY’’,trade at your own risk.
"Trade what you see, Not what You Think"
Happy Trading(:)
Ideaforge Technology Ltd: Inverted H&S Pattern.Ideaforge Technology Ltd: Inverted H&S Pattern.
36 % upside potential
Levels mentioned on chart & Given targets seems achievable.
Plan your trade accordingly.
Views are for ‘’EDUCATIONAL PURPOSE ONLY’’,trade at your own risk.
"Trade what you see, Not what You Think"
Happy Trading(:)
Will ORDIUSDT Surge or Stumble? Yello, Paradisers! ORDIUSDT has taken liquidity and then shown a CHoCH (Change of Character) towards a bullish market structure, increasing the probability of an upward move.
💎ORDI has formed an inverse head and shoulders pattern, a classic bullish reversal indicator. For confirmation, we need a breakout above the resistance zone, which would signal a bullish move.
💎If there is a pullback, we might see a potential double bottom from the support zone. For confirmation, we need an I-CHoCH (Inter