🚀 Watch for Breakout Confirmation and Potential Upside Targets!💎Paradisers, #QNT has recently broken out of a trendline, exhibited CHoCH in its price action, and formed an inverse head and shoulders pattern, all indicating a potential bullish move.
💎If #QNTUSDT manages to break above the resistance area, it suggests a continuation of the bullish momentum, with potential targets towards the next resistance area.
💎In the event of a pullback, we can anticipate a bounce from the demand area, especially if accompanied by bullish candlestick patterns.
💎Howeve
Head and Shoulders
DOT Sparks Potential Bullish Reversal with Inverse H & S💎 #DOT is currently demonstrating a bullish market structure, notably forming an inverse head and shoulders pattern. This pattern typically signifies a potential bullish reversal.
💎If #DOTUSDT manages to break above the high , it would confirm the breakout and could lead to further upward movement, with potential targets being the next resistance levels.
💎In the event of a pullback, traders may anticipate a bounce from the bullish order block (OB) level, providing support to the bullish bias.
BAND: Inverse Head & Shoulders pattern spotted. 🚀💎BAND is exhibiting signs of CHoCH (Change of Character) and BOS (Break Of Structure) towards a bullish market structure. Additionally, it has formed an inverse head and shoulders pattern, which increases the probability of a reversal.
💎If BANDUSDT manages to break out above the neckline and resistant area of the inverse head and shoulders pattern, it could indicate a bullish move towards the next resistant levels.
💎In the event of a pullback, we can anticipate a bounce from the demand level.
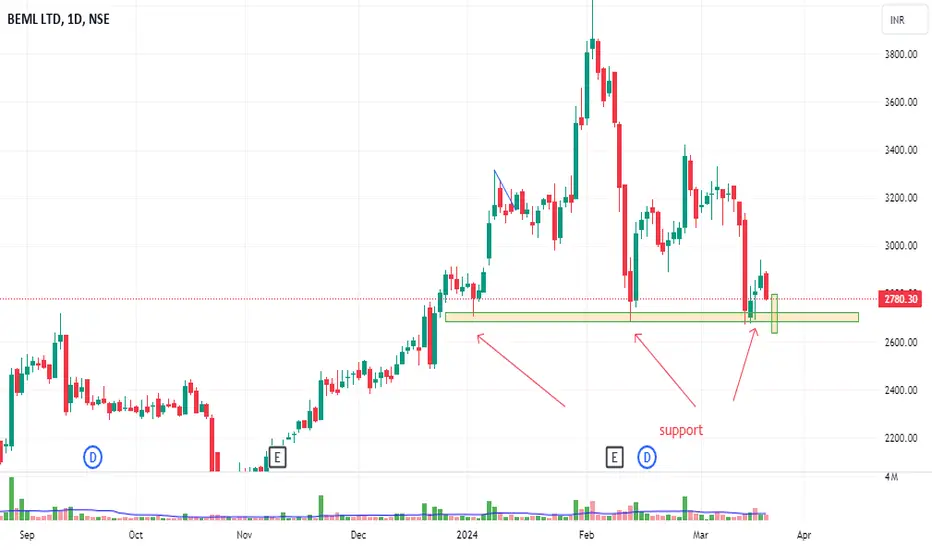
BEML stock made a bearish price action if many time bounce on support currently stock trying bounce but buyer unable to push price higher side 2700 level is more important if break 2700 we can see a sharp fall
NOTE: only for educational purpose
RULE: 1: always trade with stoploss
2: decide your risk per trade and per day
3: believe to your analysis
4: stay positive and keep patience
technical analysis + money management+ physicalogy = successful trader
pls like and share
🚀 Exciting Developments for $KSM! 💎 KSM has exhibited signs of Change of Character (CHoCH) and formed an inverse head and shoulders pattern, enhancing the likelihood of a bullish move.
💎If KSMUSDT breaks out above the resistant zone, it would confirm the inverse head and shoulders pattern, and we can anticipate targets till the next resistant levels. In the event of a pullback, a bounce from the bullish order block (OB) level can be expected.
💎However, if the price breaks down below the level of the bullish OB, which also corr
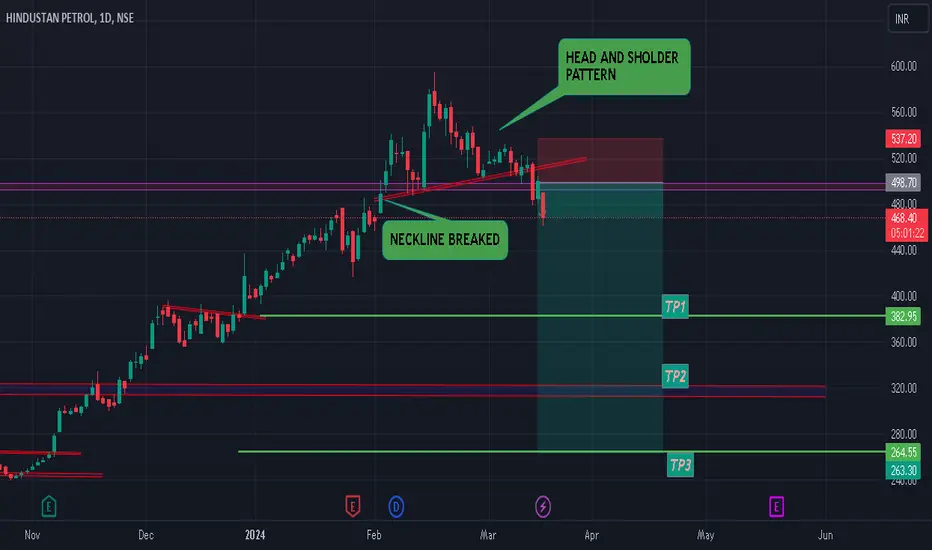
HEAD AND SHOULDERS PATTERN NECKLINE BREAKED IN HINDUSTAN PETROLHEAD AND SHOULDERS PATTERN BREAKED IN HINDUSTAN PETROL
You can see in the DAY chat Clearly showing a head and shoulders pattern
And it's entry point the neckline is also breaked
Meaning it's a goood opportunity for selling
For download side there is a good breakout occurred
It's clearly fall a lot in long-term
The target are also mentioned here
Tp 1 -382
Tp2- 320
Tp3- 264
And the entry point is. 480
Enjoy the opportunity
Stay connected
OPUSDT: Watch for Neckline Retest & Bullish OB Confirmation. 💎 OPUSDT has recently broken out of an inverse head and shoulders pattern, which typically signals a bullish move.
💎Additionally, OP has displayed CHoCH (Change Of Character) & BOS (Break Of Structure), further supporting the bullish market structure.
💎Currently, the price is approaching a retest of the neckline area of the inverse head and shoulders pattern, which coincides with a strong Bullish OB (Order Block) characterized by FVG (Fair Value Gap) above it. Any formation of a bullish candle
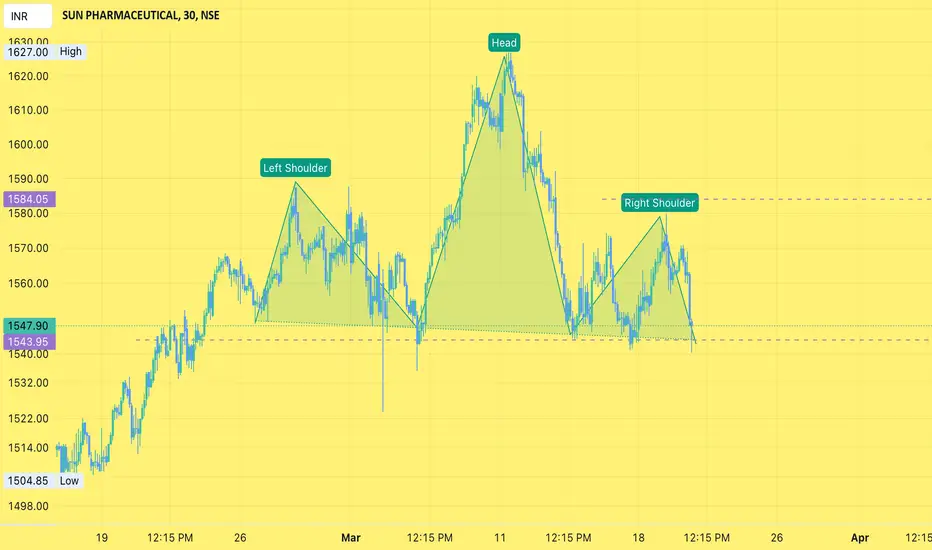
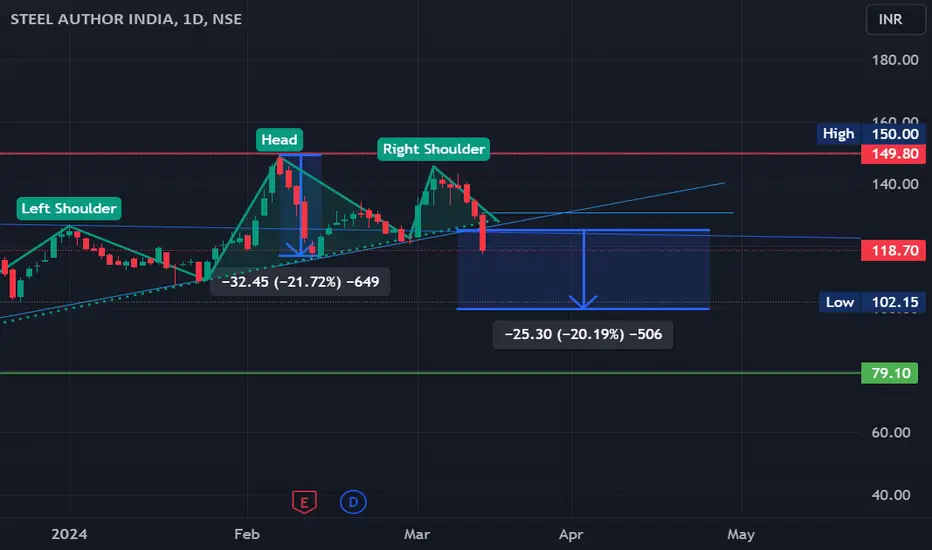
SAIL - SELL Head and shoulder pattern baseline broken SAIL has hit resistance at 150 and retraced back . It tried to hit 150 again but could not succeed. while going up and coming down, Head and Shoulder pattern is developed. Neckline was broken today. Today it has closed on 118.7. Probability of SAIL going down seems very high. My target would be 100. Appropriate entry would be at retracement till 124-126. SL would be at 131. With risk reward of 1:4, it seems a good bet. But, dont just enter. It is very volatile stock. Wait for right entry point
🚀 ORDI Ready to Soar! 📈 Bullish Momentum Building!
💎 ORDI has formed an inverse head and shoulders pattern, which can also be interpreted as a flag and pole formation when zooming out the chart, thus increasing the probability of a bullish move.
💎 To confirm the bullish scenario, we need to see a breakout above the resistant zone, followed by a candle closing and retest for confirmation. In case of a pullback, we can expect a bounce from the bullish OB level. After the bounce, we can set targets for the next resistant levels.
💎 However, if OR
INVERSE HEAD AND SHOULDER PATTERN SPOTTEDPATTERN- an inverse head and shoulder pattern is formed in macrotech developers which was in formation since november 21 and now it has come to it ' s final phase and potential breakout can be given from this level
TARGET- The stock can make lifetime high and enter into new terrorities which is the 1084 levels in coming year
IOTA Bulls on the Move! 🐂 Breakout Alert 🚀💎 IOTA has recently broken out of a resistive trendline and formed an inverse head and shoulders pattern, which increases the probability of a reversal.
💎If IOTAUSDT breaks out above the resistant zone, we can anticipate targets until the next resistant levels. In the event of a pullback, we can expect a bounce from the bullish OB, but confirmation via bullish candlestick patterns is essential.
💎However, if the bullish OB breaks down, it would be prudent to withhold action on IOTA and wait for
ALGO Breakout Alert! Bullish Momentum Detected 🚀💎ALGO has recently broken out of an inverse head and shoulders pattern, accompanied by CHoCH and BOS signals, indicating a shift towards a bullish market structure and increasing the probability of a reversal.
💎If ALGOUSDT breaks above the resistance level and neckline of the inverse head and shoulders pattern, it could suggest further upward momentum, with potential targets extending to the next resistance levels. In the event of a pullback, It will be better to look for a bounce from the bull