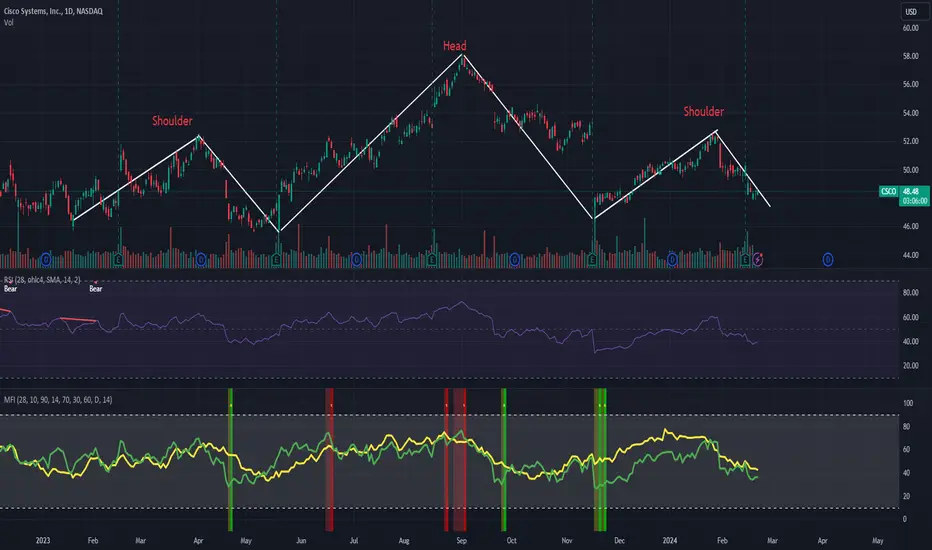
Head and Shoulders
CUP & HANDLE PATTERN WITH HEAD & SHOULDERSA few months have shown a cup and handle pattern BUT recently WEEKLY has shown an INVERSE HEAD & SHOULDERS pattern.
385-400 level is very important this level breaks the upside a good moment will be shown.
A
FLUX: Bullish Momentum Building! Breakout Potential Ahead💎 FLUX has recently broken out of a resistive trendline and formed an inverse head and shoulders pattern, which is a bullish reversal signal. Additionally, CHoCH in the price further reinforces the likelihood of a bullish move.
💎If FLUXUSDT manages to break above the resistance level along with the bearish Order Block (OB), it could signal a strong bullish movement. However, in case of a pullback, it's advisable to wait for a retracement to the bullish OB. A bullish candlestick pattern at this
WINK: Bullish Breakout Sparks Excitement! Keep an Eye on Support💎 WINK has broken out of a descending channel by forming an inverse head and shoulders pattern. Additionally, there's evidence of Change of Character (CHoCH) and Break of Structure (BOS), indicating a bullish market structure. The resistance level was also breached with a significant green candle, further increasing the probability of a bullish move.
💎If the price retraces, it would be prudent to wait for it to touch the level of the bullish Order Block (OB). From this level, we can expect a bo
FIL: Bullish Breakout Alert! Watch for Confirmation 💎 FIL has broken out of a resistive trendline and shown a Change of Character (CHoCH) in the price. Additionally, it has formed an inverse head and shoulders pattern, which is a reversal pattern that increases the probability of bullish moves in the upcoming days.
💎If the price breaks out above the neckline or the resistance zone, we can expect a bullish move. However, if the price pulls back, it would be prudent to wait for it to come near the demand area, as this could provide a more discount
H&S on higher time frame in Bajaj Finance.The stock is trading around the neckline of the pattern and on the daily charts it has closed below the zone.
The weekly charts are also showing some negativity and there are chances it may move below as there is a head and shoulder pattern on the higher charts.
Entry can be created in the stock once the weekly low is breached and a daily candle close below it.
Bajaj Finance is trading below the weekly 20 ema and pattern formation is there.
There are 2 scenarios in the stock.
First, it ca
Hindustan Unilever Ltd.Company:- Hindustan Unilever (HUL)
Sector:- FMCG
M Cap:- 5.58T
Purpose:- Educational
Analysis:- Due to over-extended the FMCG index stocks like HUL and many more have fallen from the top of almost 8% to 12%, For the last few days, bottoming out formation has been taking place in the FMCG index and its heavy-weight stocks. In my view, the FMCG index has bottomed out and its heavy-weight stocks are now preparing to go up and "HUL" is also one of them. So if you also want to become a professional
Centuryply Ltd: Inverted H&S PatternCenturyply Ltd: Inverted H&S Pattern
Stock breakout the neckline of Inverted H&S pattern and retested the breakout.
63% upside potential.
Levels mentioned on chart.
Plan your trade accordingly.
Views are for ‘’EDUCATIONAL PURPOSE ONLY’’,trade at your own risk.
"Trade what you see, Not what You Think"
Happy Trading(:)
Dr Reddy-A large cap investment multibagger!Dr Reddy has given a huge weekly breakout from Inverted head and shoulders pattern.
This stock is a blind buy for investment considering the pharma rally expected for next few years. Add on dips is the best way to accumulate such investment stock.
The company has one of the best fundamentals as of date. Stock is available at PE of 20 and PEG of 0.52. the return ratios are above 20%.
This stock has to be part of your portfolio if you prefer investing in large cap stocks.
I had seen such pattern i
EOS: Bullish Reversal Alert! Breakout Potential Ahead💎 EOS has recently broken out of the descending channels and formed an inverse head and shoulders pattern, which typically indicates a bullish reversal. Additionally, there has been a noticeable change of character (CHoCH) in the price action, suggesting a shift from a bearish to a bullish structure.
💎To confirm the bullish trend, it is essential for the price to break out above the first resistance level. This breakout would signal potential targets towards the subsequent resistance levels.
💎
E
Union Bank - Bullish Surge ExpectedUnion Bank of India has formed Inverted Head & Shoulders Pattern on monthly timeframe.
This bullish technical formation often signifies a potential trend reversal, hinting at a shift from a downward trajectory to an upward one.
Adding to this positive outlook, the Relative Strength Index (RSI) has climbed above 60, indicating a growing strength in the stock's momentum. As RSI measures the speed and change of price movements, this rise could be indicative of increasing buying interest and a pot