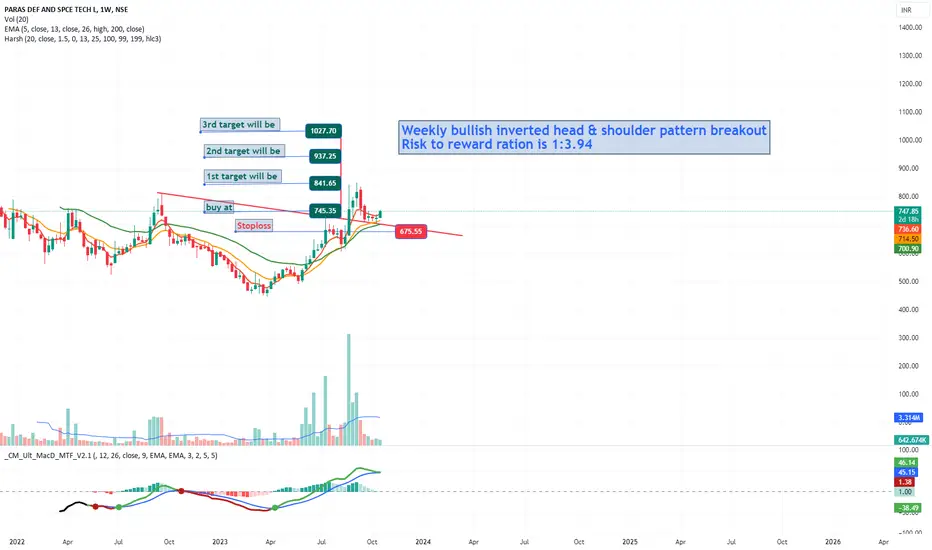
retested breakout in paras defenseA bullish Inverted Head & Shoulder Chart Pattern Breakout on the Weekly Time frame of NSE:PARAS
Price Action supported by very good volume.
The stock is currently in uptrend making higher highs and higher lows.
One can add this stock into their stocks to buy list and initiate the long trade as per the levels mentioned on the chart
Stop loss will be on a Weekly closing basis.
Trend Analysis :- UP Trend
Chart Pattern :- Bullish Inverted Head & Shoulder Pattern
Technical Indicator :- Posit
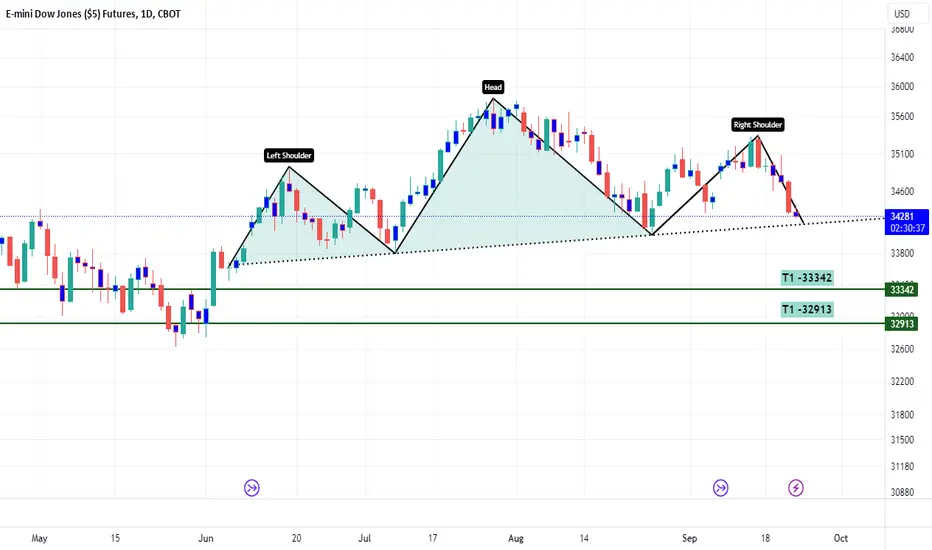
Head and Shoulders
ICICIBANK Long Opportunity (Inverted HnS formation)ICICIBANK is forming an Inverted Head and Shoulder pattern on hourly timeframe. The stock has bounced off it's lower longterm trendline and now has formed a range. We can expect the price to test the ATH Levels after breakout. Above this level, the stock will also cross above 50 MA on Daily timeframe so that gives more confidence.
Stop Loss: SL for this trade has to be 936
Entery: Entries can be made once the price crosses and closes above 962 at least on a 30 min TF. You can also wait for re
inverted head and shoulders on SBIN: State Bank of IndiaA slanting channel on 2 hr time frame, a break out of which can lead towards 620 area and drop from the channel can bring the price to the lower end of the channel or the buffer support area. Beyond which it can retest 550-555 levels.
but on the larger Daily Time Frame, its a head and shoulders in formation and a breakout of which will come above 620.
Do like and leave your thoughts behind.
#Sbi #StateBankofIndia #psubank
BERGERPAINT: Likely to form Reversed Head & Shoulder PatternBerger Paint likely to form Head & Shoulder Pattern.
Wait for breakout from 675 level if you are safe investor.
Risky investor can enter at current level 565 to get more gain.
#Current Price - 565
#Expected Target - 900
#Resistance Based Targets
- Target 1 - 712
- Target 2 - 900
#Support Based Targets (Can be used as Stoploss)
- Target 1 - 563
- Target 2 - 524
Pattern is forming on weekly chart.
Disclaimer:
This idea is only for education purpose, Please consult your financial advisor.
I
Union Bank Cmp 99.60 H&S Pattern 5 years BOUnion Bank Cmp 99.60 dated 20-9-2023
Weekly Chart (Positional Call)
1. Inverted Head & Shoulder Pattern.
2. Rounding Pattern
3. 5 years of consolidation BO @ 100
4. Price Rise with Volumes
Buy above 100 target 115-130-140-150-160-175
SL 85
It is just a view, please trade at your own risk.
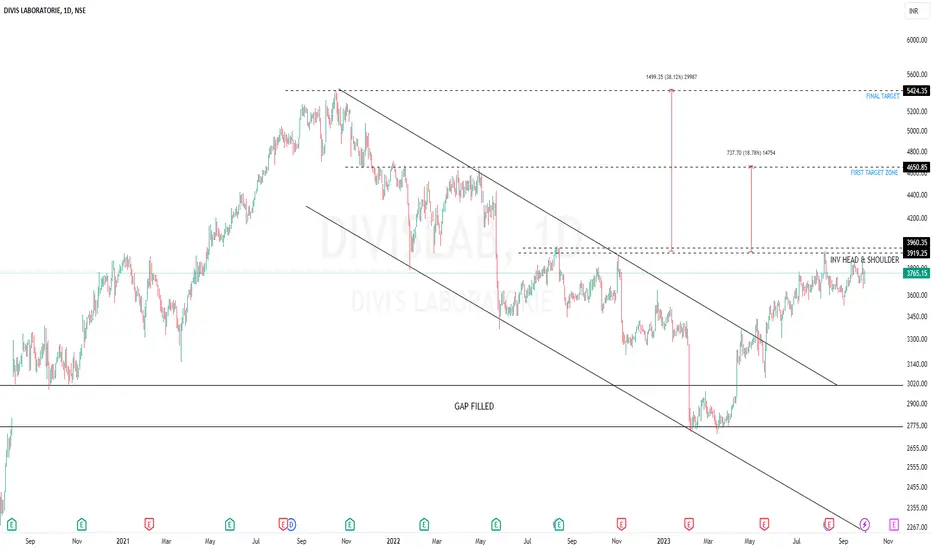
DIVIS LAB ANOTHER QUALITY GEMA beautiful formation in the making at the base
it has given breakout of the channel and sustained the level
now going forward
the setup looks very promising in coming days
one can simply go long with the Sl of closing below 20ema in weekly tf
always analyse. before go into the trade
this is just for learning purpose
m not a sebi register advisor
Decoding Westlife: Market Rally and Anticipating the Next MoveHello Traders! Today we're revisiting our analysis of Westlife from June 6, where we discussed the breakout of a Head & Shoulder pattern. Let's dive in!
On June 9, our suggested entry triggered at a retest of the H&S breakout at 825 .
From that entry point, the stock rose to a level of 1024 by September 8 — a gain of nearly 27% .
This movement aligns perfectly with the Head & Shoulder target method. This method measures the vertical distance from the head to the neckline of th
Forming Head and Shoulder PatternNSE:MINDTECK - Daily Chart analysis.
It seems the stock will form bottom head and shoulder pattern.
The chart is self explanatory with Intermediate-Term Bullish.
PLEASE NOTE THAT:
This chart analysis is only for reference purpose.
This is not buying or selling recommendations.
I am not SEBI registered.
Please consult your financial advisor before taking any trade.