Head and Shoulders
NIFTY50 - Head & Shoulders Pattern Signals Bearish RiskIn the 30-minute chart of NIFTY 50, a classic Head & Shoulders pattern has clearly emerged, which could act as a potential trend reversal signal. This pattern often appears near the end of a bullish phase and can warn traders of a short-term or medium-term top.
The Left Shoulder formed around 20th August, followed by a sharp rally into the Head near 25,150 levels on 22nd August. The price then retraced to the neckline support zone around 24,850, bounced to create the Right Shoulder, and is now
“Nifty 1H Analysis: Head & Shoulders Setup + Unfilled Gap”Nifty on the 1H timeframe is showing signs of a possible Head & Shoulders formation, which could indicate a short-term reversal if the neckline breaks. Currently, price action is between neckline and the right shoulder. Traders should watch the neckline level closely for confirmation.
📌 Key Note: There’s also an unfilled gap left around the 22,660–24,850 zone, which may act as a magnet for price action after H&S neckline breakout.
⚠️ This is not financial advice — just my personal market obser
NIFTY About to crash? H&S Breakdown?After buying rallying from 21743 to 25669 Nifty 50 is showing LL LH formation.
A Head & Shoulders (H&S) pattern on the daily charts is being formed. The right shoulder just got rejected at the same zone where the left shoulder was formed.
Lower High formation: The Previous high of 25250 is not breached, and a new lower high formed at 25150.
H&S Pattern visible: Head at ~25669, shoulders around ~25200. Base of H&S can be considered at 24450.
H&S Target: Possible downmove of 1200 points (dist
ESCORTS Potential Breakout Alert: Inverted Head & ShoulderThe chart of ESCORTS KUBOTA LTD (daily timeframe) is currently displaying a well-formed Inverted Head and Shoulder pattern, a powerful reversal setup often seen at the end of prolonged downtrends. This pattern suggests a shift in momentum from bearish to bullish—but the key breakout level still remains unconfirmed.
The left shoulder formed around November 2024, the head during March 2025, and the right shoulder recently shaped up through June and July 2025. The neckline resistance, drawn near t
Head and shoulders pattern in NiftyThe head and shoulders pattern is a technical analysis chart pattern used in trading to predict potential reversals in price trends. It’s primarily a bearish reversal pattern that appears after an uptrend, signaling that the price may soon decline.
In the NIFTY
The pattern forms during an established uptrend, where prices are consistently making higher highs and higher lows from 07 April,2025
Left Shoulder: The price rises to a peak (a high) and then declines to a support level (a low), for
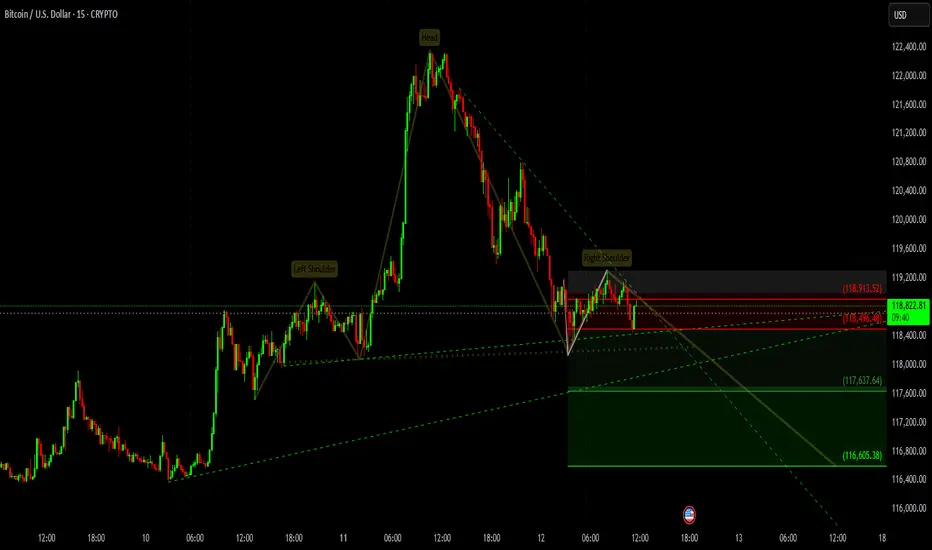
BTC Head & Shoulders Alert – Possible Breakdown!🚨 BTC Head & Shoulders Alert – Possible Breakdown! 🚨
Bitcoin is showing a clear Head & Shoulders pattern on the 15m chart.
Price is hovering near the $118,500 neckline, with sellers trying to push lower.
🔹 Key Levels:
Pattern: Head & Shoulders – bearish reversal setup
Breakdown Zone: Around $118,500
Immediate Support: $117,637
Major Target: $116,605 (measured move from pattern)
Invalidation: A close above $118,913 could flip bias bullish
📌 Plan:
Watch if BTC sustains
EID Parry - Inverted Head and Shoulder - BullishEID Parry is one of the top fundamental company in sugar industry. And EID parry is among the Murugappa group of companies. One should watch Murugappa group of companies. They are all very good.
Seeking to curb carbon emissions, India aims to increase the share of ethanol in gasoline to 20 percent by 2025-26, from 13 percent -14 percent now. Indian sugar mills such as E.I.D.-Parry Balrampur Chini Mills Shree Renuka Bajaj Hindusthan and Dwarikesh Sugar have increased their ethanol production cap
Bearish patterns in Nifty ITOn monthly we see multiple bearish patterns in IT index.
Over long term we can see that this index takes support near 100 SMA on monthly.
Currently this index is in down trend and in worst case can see support nr 29000 levels. Which also coincides with earlier buying zone.
I would avoid IT till I find some good bottoming out pattern.
PNB Breakdown Alert: Further Downside Likely📊 TECHNICAL INDICATOR ANALYSIS – PNB BEARISH OUTLOOK
🔻 1. HEAD & SHOULDERS PATTERN FORMATION
PNB has formed a CLASSIC HEAD AND SHOULDERS PATTERN, a strong bearish reversal signal. The breakdown below the neckline confirms the end of the previous uptrend and suggests a shift in sentiment toward the downside.
📉 2. VOLUME SURGE ON BREAKDOWN :
A SIGNIFICANT SPIKE IN VOLUME was observed during the breakdown, reinforcing the bearish pattern. Volume confirmation is crucial, and in this case, it sh
Nifty 50 Weekly: Inverted H&S Breakout Confirmation Awaited!Pattern & Breakout:
Inverted Head & Shoulders formed on the weekly chart (bullish reversal pattern). ✅
Neckline breakout occurred last week, but confirmation pending! This week failed to close above breakout level.
Confluence Alert: Weekly close above breakout level = Trendline resistance (red) breakout! 🚀
Targets (If Confirmed):
50% Fib extension: 26,333 📈
61.8% Fib extension: 26,768 🎯
(Fib drawn from 3rd March 2025 swing)
Key Invalidation:
Right Shoulder Low: 24,473 (blue line). Break
RBL BANK CUP AND HANDLEThe Stock Has Formed Cup And Handle. It is near its major resistance, its consolidating below it,so waiting for the breakout. Once the breakout is done, it may see its first target as marked, rest targets will be marked as the charts unfold. so its awaited for the breakout. Hoping the best.
Also Inverse Head & Shoulder forming,which will be completed at the first target.good luck. ty. JMK
HEROMOTOCO Breakout Alert: Inverted Head & Shoulder PatternHero MotoCorp Ltd has formed a classic Inverted Head and Shoulders pattern on the daily timeframe, a strong indication of a potential bullish trend reversal. This pattern, combined with a breakout above the neckline and support from the 200 EMA, presents a high-probability long setup. This post details the trade plan, key levels, and conditions to validate or invalidate the move.
Chart Analysis Summary:
The stock closed at ₹4,535.90 with a powerful bullish candle, up by 5.20% for the day. Thi
BATAINDIA LONGThe Elliott Wave Theory's description of the structure and pattern of price movements in financial markets is known as the Elliott Wave Structure.
The Elliott Wave analysis indicates that the stock has completed waves (i) and (ii), which are shown as blue numbers on the daily chart. Wave (iii) appears to be underway at this time.
Wave (iii), also known as the impulse wave, unfolded into five waves, which are illustrated in red.
Wave levels are depicted on the chart.
An inverted Head and Shou
Automotive Axles Ltd (Weekly Timeframe) - Potential Reversal ??After the Double Top formation (May 15, 2023) in weekly timeframe, the stock has been in a downtrend. With this week's price action, the stock seems to BreakOut of a Weekly resistance zone with good volume. EMAs are also in positive state.
A Long-term angular resistance BreakOut along with Short-term resistance BreakOut makes this more significant to consider as a reversal sign. Watchout for next week's price action to determine if the reversal signs are intact or not. If it does, then the next
TATVA-- BULLISH VIEW (EDUCATIONAL PURPOSE)-- PRICE PATTERNTATVA -- BULLISH VIEW (EDUCATIONAL PURPOSE)
Inverted head and shoulder pattern formed after long downtrend of around 4 years
This indicates probable reversal
Increase in volumes is also seen along with the Inv head and shoulder pattern formation which adds more strength to the pattern
Long position can be initiated at around 1080-1085 levels (on slight correction) CMP 1146
Stop loss : below 886 on weekly closing basis (-20%)
Target 1 : 2820 (160%) {Time horizon : 40-48 months (till July 2029)}
T
ZYDUSWELL : Inverse Head & Shoulder chart pattern#ZYDUSWELL #patterntrading #chartpattern #breakouttrading #inverseheadandshoulder #trendingstock
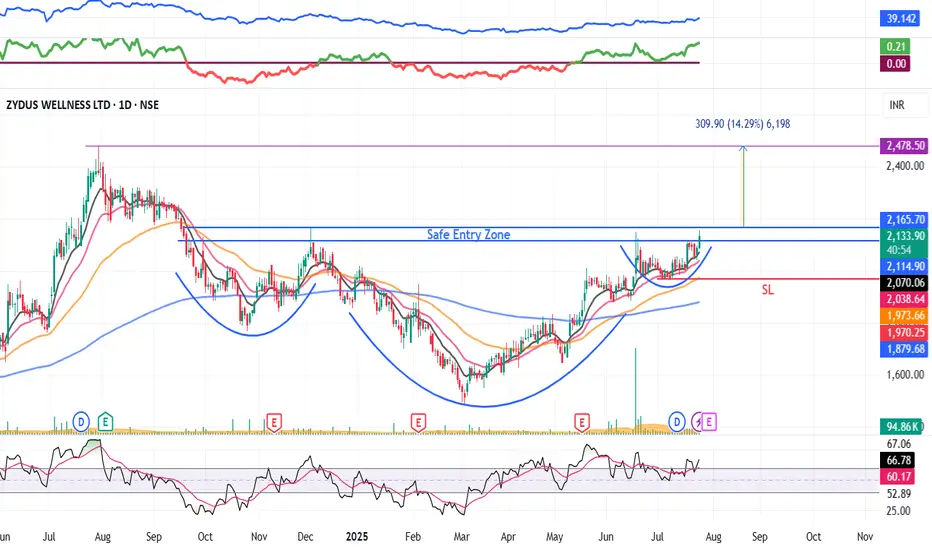
ZYDUSWELL : Swing Trade
>> Breakout candidate
>> Inverse Head & shoulder pattern
>> Trending stock
>> Good Strength & Volume
Swing Traders can lock profit at 10% and keep trailing
Pls comment, Boost & follow for more such Analysis
Disc : Charts shared are for Learning purpose and not a Trade recommendation. Consult a SEBI Registered advisor before taking position in it
JINDALSTEL : pattern breakout#JINDALSTEL #patterntrading #chartpatternbreakout #swingtrading
JINDALSTEL : Swing Trading
>> Breakout soon
>> Inverse Head & Shoulder pattern
>> Good Strength & Volumes Buildup
>> Trending setup
Swing Traders can lock profits at 10% and keep Trailing
Pls boost, Comment & Follow for more Analysis
Disc : Charts shared are for Learning purpose and not a Trade recommendation. Pls consult your Financial Advisor or a SEBI Registered Advisor before taking position in it