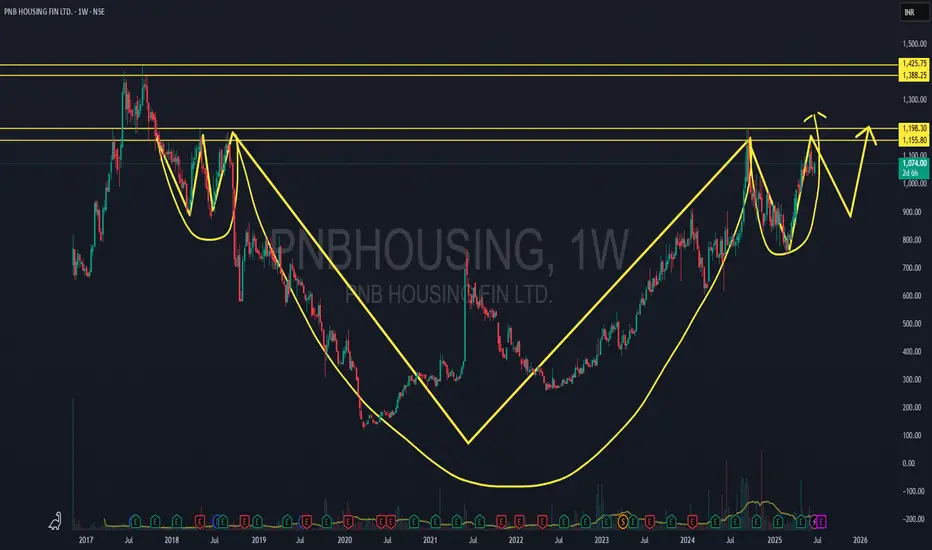
Head and Shoulders
3MIndia Accumulate Range - 24500 - 22000 - Target - 51000View is Long term and patience is the KEY.
3M India is bearish currently on Monthly chart and seems will be bearish till end of year. Currently making a harmonic pattern. Will turn bullish my start of 2026.
Accumulation Range - 21000 to 24500
Long term Final Target - 51000+
Intermediate targets marked on the chart.
IOC - Fascinated by the Fibonacci!
Unveil the mesmerizing journey of Indian Oil Corp Ltd (IOC) on this captivating chart!
Behold the Fibonacci levels, meticulously drawn two months ago, revealing a fascinating truth.
Witness the price action align flawlessly with these golden ratios, a trader's dream come true.
Marvel at the emerging head and shoulder pattern, hinting at a potential trend reversal.
Anticipate an exhilarating uptrend as the pattern nears completion, sparking excitement.
Strategize with a trailing stop fro
BPCL Gains Momentum After Key Support, Faces Resistance AheadTopic Statement:
BPCL has made a strong upward move in the recent rally, though key resistance levels and chart patterns suggest caution.
Key Points:
* A head and shoulders candlestick pattern is visible, indicating potential reversal signals to watch
* The stock took heavy support at the 50% Fibonacci retracement level, where it also briefly dipped below the 180-day EMA
* Price is currently facing resistance at the 23.6% Fibonacci level near 317, which may act as a short-term cap on further ga
TEXRAIL: Breakout FocusTEXRAIL has recently exhibited a notable technical development on the daily chart. On Friday, 16 May , the stock completed a breakout from an inverted head and shoulders pattern, a formation often associated with potential trend reversals. The breakout occurred with a decisive close above the neckline, which had previously acted as a key level of resistance and had been tested multiple times, reinforcing its technical significance.
Following the breakout, the price action has respected the ne
Wockhardt-Bad fundamentals, Strong technicals!Wockhardt is an age old Indian pharma company which has been in loss since few years.
Stock has bounced from strong support and also gave inverted head & shoulders breakout.
Stock is consolidating post breakout.Not my usual technofunda pick but a very attractive technical breakout. Please know that risk is more with such ideas.
MAXHEALTH | Inverted Head and Shoulder | Breakout | ATH
## 🩺 **MAXHEALTH – Inverted Head and Shoulder Breakout Analysis**
### 📊 **Pattern**:
✅ **Inverted Head and Shoulder** formation confirmed
* Base support near: ₹936
* Breakout zone: ₹1,200
* Current price: ₹1,232.80
* **Volume spike** on breakout = bullish confirmation
---
### 📐 **Breakout Target Calculation**
* Depth of Cup: **₹255.20**
* Target = ₹1,200 + ₹255.20 = **₹1,455.20**
📌 **Target Area marked** on chart near ₹1,455
---
### 🔍 **Key Technical Insights**
* **Resistance turned
ARVINDFASNARVINDFASN showing very good strength on this negative days as well and currently trying to coming out of consolidation. As long as it is closing above 440 then dips are good to accumulate. Positive momentum may fetch the stock up to 600 in near term. And next trigger level can b above 485. Wait for the perfect entry point.
PAYTM KARO PAYTM CMP - 975. If it cross and closs above 1050, chances of 1350 to 1700++ 900 strong support - Making inverse head and shoulder pattern so upside chances are higher...
One 97 Communications Ltd
About
Incorporated in 2000, One 97 Communications Ltd is India's leading digital ecosystem for consumers as well as merchants. As of March 31, 2021, the company has a 333 million+ client base and 21 million+ registered merchants to whom it offers payment services, financial services, and commerce
Inverse Head & Shoulders Breakout – SHAREIND Poised for a 22% RaAfter a sustained downtrend, SHAREIND (SESHIND) has formed a clear Inverse Head & Shoulders on the daily chart:
Left Shoulder around ₹180
Head around ₹138
Right Shoulder around ₹180
Neckline near ₹190
With the neckline successfully cleared, the measured move (~42 points or 22%) projects targets of:
1️⃣ Target 1: ₹217
2️⃣ Target 2: ₹232
Risk Management:
Entry: On daily close above ₹190 (neckline)
Stop Loss: ₹169.50 (just below the neckline swing low)
Risk–Reward: ≈1 : 2.2 (SL ~₹20 vs.
MAXHEALTH | Inv HEAD AND SHOULDER | WACHLISTChart patterns shown for MAX Healthcare (NSE: MAXHEALTH):
---
🔍 **Pattern Observed:**
The chart showcases an INV HEAD AND SHOULDER pattern in progress, which is a bullish continuation pattern.
---
🔹 **Key Levels:**
* **resistance (neckline breakout)**: \~₹1,195–₹1,227 zone
* **Current price:** \~₹1,194.60
BANKINDIABANKINDIA is currently trading above resistance breakout and also recently has shown Inverted H&S breakout as well. Volume in recent session has been increased. If we check pattern target then it has a potential to go up to 160-70 level. I may change my view if it closes below 120. In recent time I have observed traction in all PSU banking stock. Is it something that we don't know!! Chart is indicating something to be watched very closely. Keep it on radar.
CNXITThe CNX IT index is currently forming an inverse Head & Shoulders pattern, a bullish reversal formation. The index made a bottom at 30918 on 7th April 2024, which aligns with a prior support zone tested on 4th June 2024, followed by a strong upward move. This double test of support indicates a solid base formation.
If the pattern plays out, a breakout above the neckline could open the way toward the supply zone of 41600–43430, where previous selling pressure was observed.