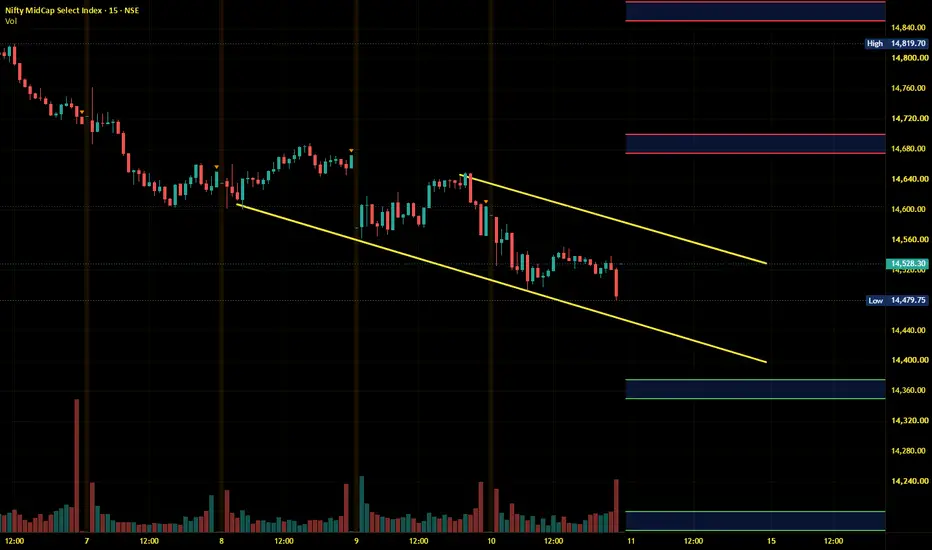
Midnifty Intraday Analysis for 11th September 2026NSE:NIFTY_MID_SELECT
Index is near 14500 support level and bounce from the support level is expected as long as the support is not broken. However, the range bound moment is expected between 14500 - 14800 range.
The upward movement may lead the Index near 14675 – 14700 resistance range and if the index crosses and sustains above this level then may reach 14850 – 14875 range.
On the contrary, The downward moment may drag the index to 14375 – 14350 support range and if this support is bro
Ichimoku Cloud
XAUUSD 30m: Intraday Consolidation & Key Rejection LevelsGold (XAUUSD) is currently moving in a tight consolidation range around the 4,334 mark on the 30-minute timeframe, following a recent downward push. Here are the key levels I am watching for the next intraday move:
Upside Resistance (Red Zones):
I have marked a series of distinct resistance hurdles above the current price action at 4,363.19, 4,376.33, 4,391.73, and 4,411.94 . If buyers can force a breakout above the immediate local resistance, these levels will act as primary targets and pot
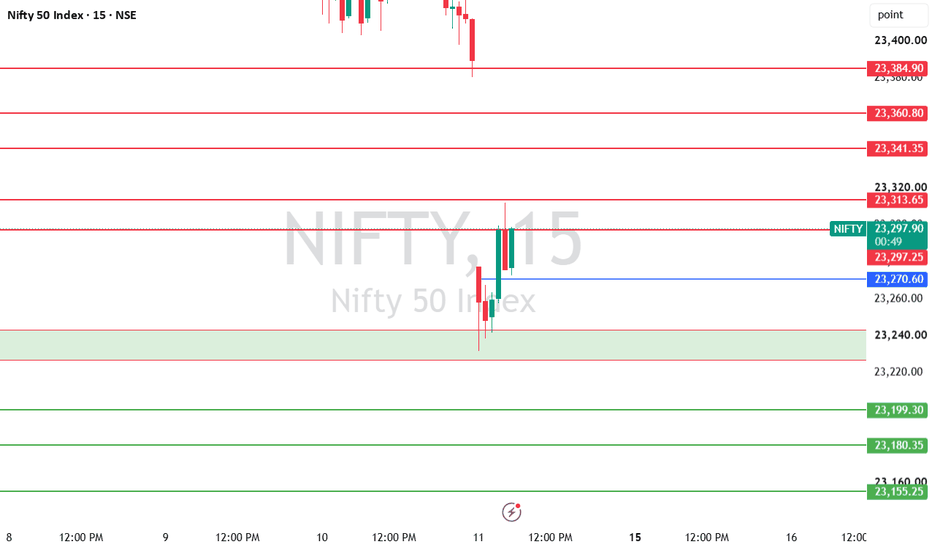
Intraday Levels Nifty 50 levels for September 11, 2026Intraday Levels
With the current price hovering around 23,280, here are the immediate horizontal levels marked on your 5-minute timeframe:
Resistance Levels (Upside)
23,297.25
23,313.65
23,341.35
23,360.80
23,384.90
Support Levels (Downside)
23,270.60 (Immediate pivot below current price)
23,240.00 (Upper edge of the green support zone)
23,199.30
23,180.35
23,155.25
Broader Market Technical Levels
Following a gap-down opening driven by weak global cues and elevated cr
Gold Aiming Bullish setup towards 4639 and 4840
PEPPERSTONE:XAUUSD is currently consolidating beneath a descending trendline resistance, while a strong horizontal resistance is also sitting around 4,443.77 .
The price is approaching a critical decision zone. A confirmed breakout above 4,443.77 , together with a break of the descending trendline, could open the way for a larger bullish move.
I am bullish on Gold because of:
Descending trendline has been acting as dynamic resistance.
4,443.77 is the key horizontal resistance.
Pr
AUDUSD Bullish Move expectedDaily TF is strongly bullish.
4H is also bullish enough to be traded.
Bullish Triggers
4H Trendline respected multiple times
Nice HH and LH on both Daily and 4H Time frames.
Price above 50 EMA and 89 EMA
Bearish Triggers
RSI on 4H time frame.
Trade
Time frame: 1H
Buy Stop: 0.72177
SL: 0.71551
TP 1: 0.72939
TP 2: 0.7400
H2 Bullish Reclaim Toward Major Supply
XAUUSD is trading around 4,413 after recovering from the recent 4,350 area and compressing between the descending resistance trendline and rising short-term support. Price is now approaching the first resistance zone, making the next reclaim especially important.
Gold gained more than 1% on Wednesday as the U.S. dollar remained soft, while escalating Middle East tensions pushed Brent above $100. However, the U.S. 10-year Treasury yield climbed toward 4.84%, and markets are pricing roughly a 6
SIGNS of REVERSAL?As we can see NIFTY reversed from our trendline support, exactly as analysed. Though the trendline is not yet touched and a minor space is still left which means NIFTY could fill in this gap. So we must wait for NIFTY to break the high of today’s candle for confirmation. So plan your trades accordingly and keep watching everyone.
One Chart. Six Tools. Multiple PatternsEducational price-action Post. No forecast or trade recommendation. Price Action used is older than 3 months
Here’s how I’ve mapped this chart from A to F 👇
A — Fibonacci Retracement 📐
The Fibonacci tool is drawn from the swing low to the swing high. Price breaks below my marked Golden Retracement level. While many traders interpret this as a sign of bearish continuation, my setup looks at what happens after the breakdown. If price recovers back above the level, I consider the possibilit
XAG/USD: High-Probability Demand Retest — Bulls Eyeing Range ExpSilver (4H): Liquidity Sweep at Key Support & Trendline Confluence Setup
XAGUSD Long Idea: Discount Zone Defense with High R:R Target
"CAN BUY SILVER ETF eg. (Nippon Silver, TATA silver ETF etc)
Instrument: Silver / U.S. Dollar (XAGUSD / OANDA)
Timeframe: 4-Hour (4h)
Bias: Bullish
Market Overview & Setup Logic
Silver has printed an impulsive upward structure and is now completing a healthy corrective retracement back into a critical multi-confluence demand zone. Following the initial impu
Hindustan Zinc: Correction or Breakdown?Hindustan Zinc rallied from its major low of ₹514.95 to ₹608.40 (Wave 1), pulled back (Wave 2), then surged again to ₹632.00 in an impulsive move.
Since that peak, it's been correcting in an (a)-(b)-(c) pattern — and wave (c) is still unfolding.
Key signal: Wave (a) bottomed near the lower boundary of the rising channel, and wave (b) bounced back up inside that same channel (₹581.30 → ₹610.90). Once (b) topped out, price broke straight through the channel's lower line — confirming
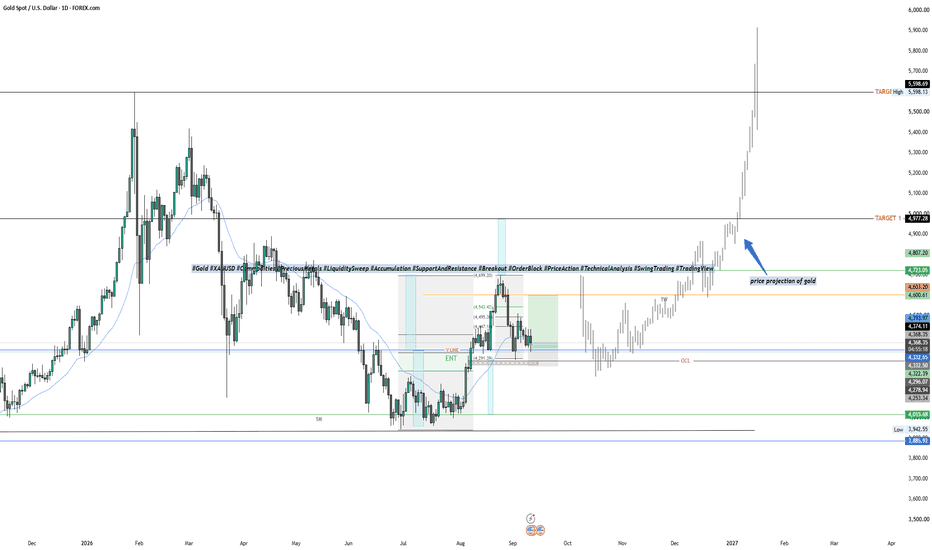
XAU/USD: Liquidity Sweep & Accumulation — The Path Toward Fresh Gold Spot (1D): Base Formed at Multi-Month Support | Bullish Expansion Ahead
XAUUSD Macro Setup: Order Block Defense and Projected Parabolic Run
Instrument: Gold Spot / U.S. Dollar (XAUUSD / FOREX.COM)
Timeframe: Daily (1D)
Bias: Bullish
Market Overview & Setup Logic
Gold has completed a classic accumulation phase following an extended correction into major monthly support (1M). The engineered downside sweep successfully purged sell-side liquidity before price reclaimed the short-term base
Nifty Intraday Analysis for 09th September 2026NSE:NIFTY
The 23500 support is broken and as long as the index is below this level downside moment upto 23000 level is expected.
The upward movement may lead to 23650 – 23700 resistance range and if the index crosses and sustains above this level then may reach near 23900 – 23950 range.
On the contrary, The downward moment may drag the Index to 23200 – 23150 support range in downward momentum and if this support is broken then index may tank near 22950 – 22900 range.
Banknifty Intraday Analysis for 10th September 2026NSE:BANKNIFTY
Index is near 56100 - 56000 range support and if this support is broken then further downside moment is expected. On the upside index has strong resistance at the 56800 level and as long as the index is below this level downside risk persists.
The upward moment may lead the Index to 57000 – 57100 resistance range in upward momentum and if the index crosses and sustains above this level then may reach near 57700 – 57800 range.
On the contrary, The downward moment may drag the
Finnifty Intraday Analysis for 10th September 2026NSE:CNXFINANCE
The 25500 support is broken and the next support is 25000 and range bound moment is expected between 25000 - 25500 range as long as index on either side of the range is not broken.
The upward movement may lead the Index to 25650 - 25700 resistance range and if the index crosses and sustains above this level then may reach near 25950 - 26000 range.
On the contrary, The downward moment may drag the to 25100 – 25050 support range and if this support too is broken then index m
Midnifty Intraday Analysis for 10th September 2026NSE:NIFTY_MID_SELECT
Index is near 14500 support level and bounce from the support level is expected as long as the support is not broken. However, the range bound moment is expected between 14500 - 14800 range.
The upward movement may lead the Index near 14750 – 14775 resistance range and if the index crosses and sustains above this level then may reach 14925 – 14950 range.
On the contrary, The downward moment may drag the index to 14450 – 14425 support range and if this support is bro
Bharti AirtelPlan to watch/trade: Wait for the pullback and bearish strength at 1880 - 1900.
If there is bearish strength, then sell below 1870 with a stop-loss at 1886 for the targets 1866, 1852, 1838, 1820, 1802, 1786 and 1772.
These levels will become invalid if the price shows bullish strength at 1880 - 1900.
Always do your analysis before taking any trade.
Nifty - Expiry day analysis Sep 8The price broke the important zone 23800. The important levels are 23600, 23800 and 24000, where we can expect movement in price when it tests the levels.
Buy above 23840 with the stop loss of 23780 for targets 23880, 23920, 23980, 24020, 24060 and 24120.
Sell below 23720 with the stop loss of 23780 for targets 23680, 23640, 23580 and 23540.
The expected expiry day range is 23500 to 24000.
Always do your analysis before taking any trade.
Nifty - Weekly Review Sep 7 to Sep 11Buy above 24020 with a stop-loss of 23960 for the targets 24060, 24100, 24160, 24220, 24280, 24360 and 24420.
Sell below 23860 with the stop loss of 23920 for the targets 23820, 23780, 23720, 23660, 23620 and 23560.
Important levels to watch are 24120, 24000 and 23780.
Always do your analysis before taking any trade.
XAUUSD SUPPORT & RESISTANCE | 10-09-2026With the current price hovering around 4,408.10, you have well-defined resistance (red) and support (green) zones. Here are two common ways to approach a short based on your mapped levels:
Scenario 1: Sell on Resistance Rejection (Pullback Short)
Entry Zone: Wait for a push higher into your immediate red resistance levels at 4,423.02 or the heavier supply zone between 4,430.20 and 4,436.60. If price action shows weakness (like a bearish engulfing candle or long upper wicks) in this area, it
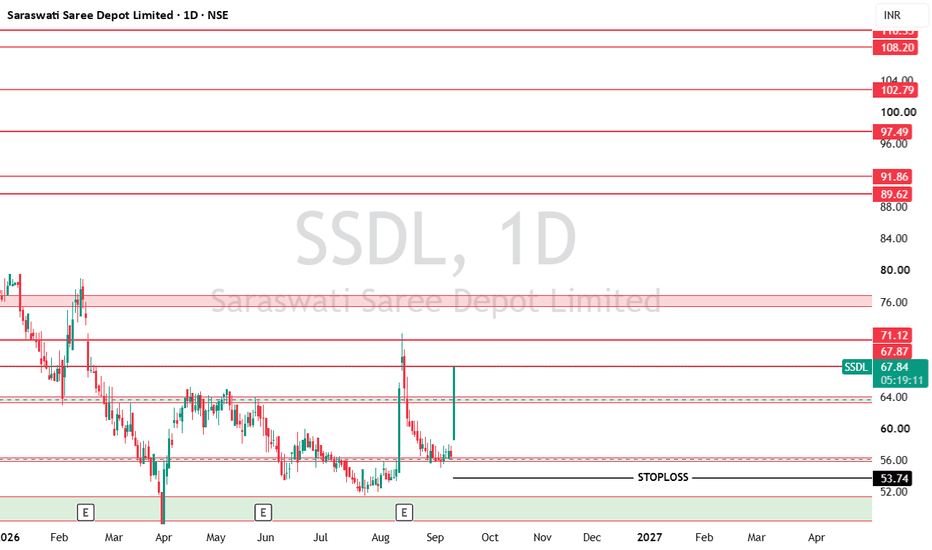
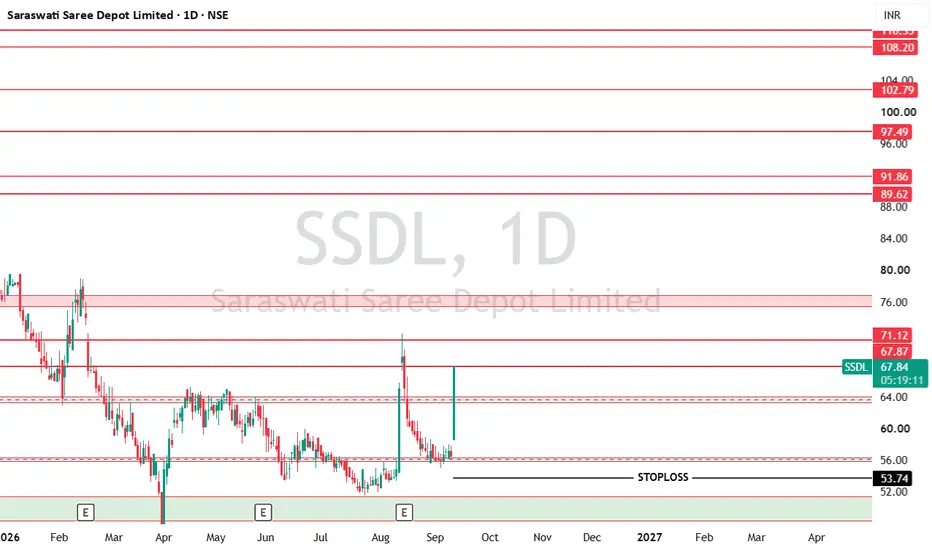
SWING TRADE ALERT: $SSDL (1D Timeframe)Massive momentum today on Saraswati Saree Depot Limited! The stock has fired up a phenomenal +19.99%, locking in at 67.84 with a huge bullish candle off the base. We are looking at a powerful momentum buy right here.
Here are the mapped levels straight from the chart:
🟢 ENTRY: Immediate BUY at 67.84 (Momentum play)
🔴 STOP LOSS: 53.74 (Strict daily close basis)
🎯 TARGET 1: 71.12
🎯 TARGET 2: 76.00 (Watch for reaction at this red supply zone)
🚀 EXTENDED TGs: 89.62 | 91.86 | 97.49 | 102.79
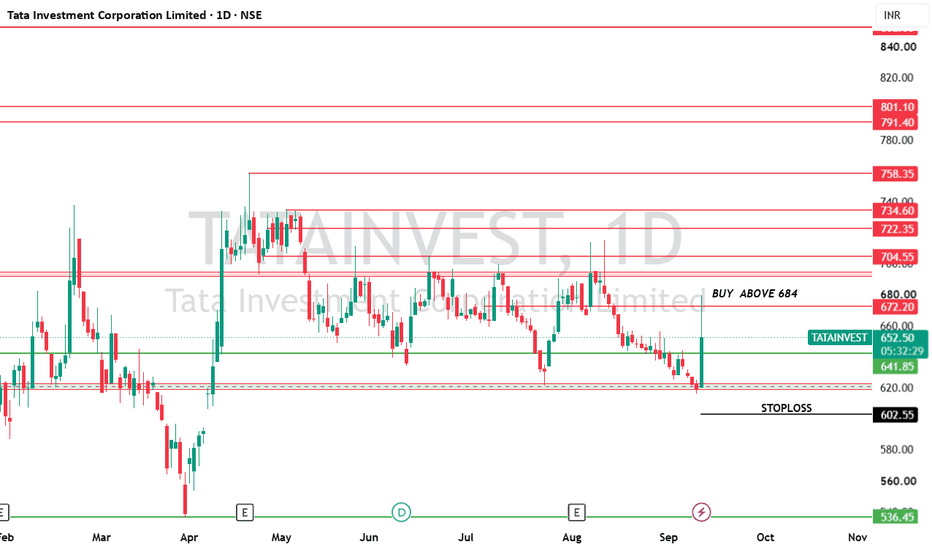
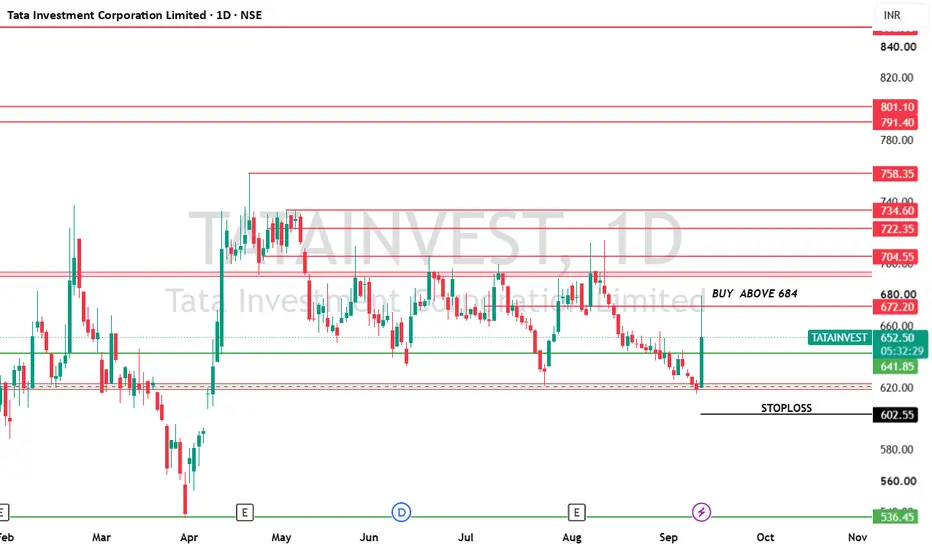
SWING TRADE WATCH: $TATAINVEST (1D Timeframe)Strong bullish momentum today, currently up +6.60% and showing great relative strength. We are keeping this on radar for a solid breakout setup. Here are the mapped levels:
🟢 ENTRY: BUY ABOVE 684 (Wait for a decisive breakout/close above this level)
🔴 STOP LOSS: 602.55
🎯 TARGETS: 704.55 | 722.35 | 758.35
🚀 EXTENDED TGs: 791.40 | 801.10
💡 Setup Notes:
The chart has established a strong base and is pushing upward. A confirmed cross above 684 gives us a great risk-to-reward ratio headin
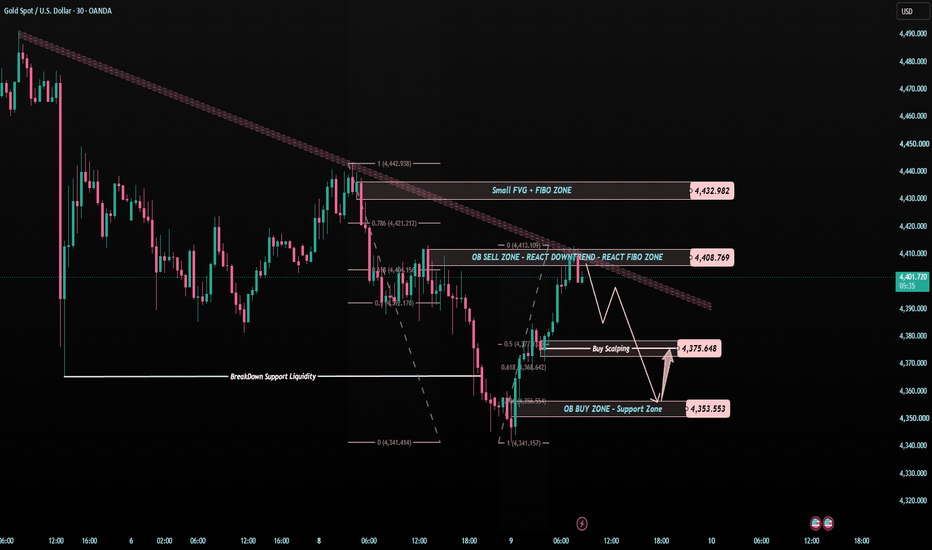
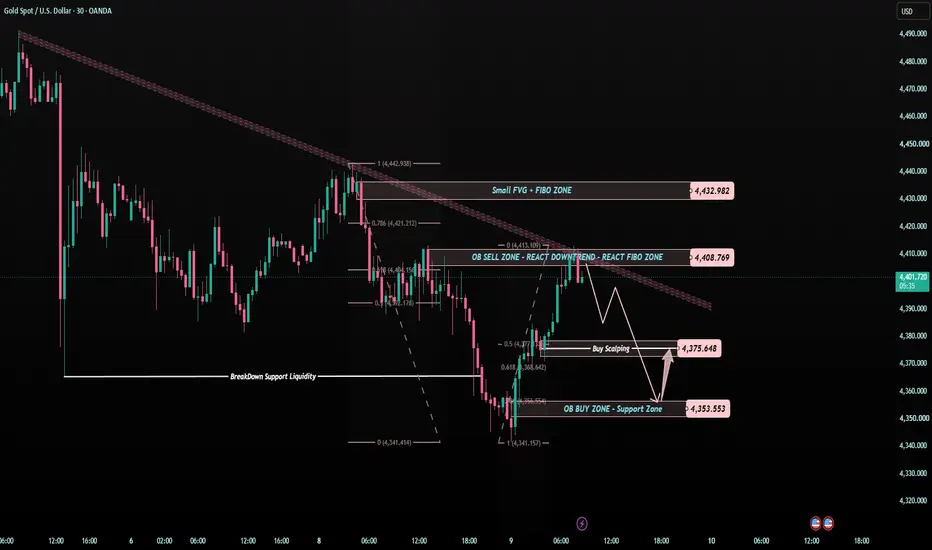
XAUUSD — 4,408 Breakout or Bull Trap?Gold is recovering strongly from the lower support area, but the chart is now testing a very important resistance zone.
Price is trading around 4,400 - 4,405, right below the OB Sell Zone, downtrend retest, and Fibo reaction area near 4,408.
This is where traders need to slow down.
A strong bounce does not always mean the trend has fully changed.
Sometimes, the market only returns to resistance before choosing the next direction.
The simple read
4,408 is the key decision zone today.
If go
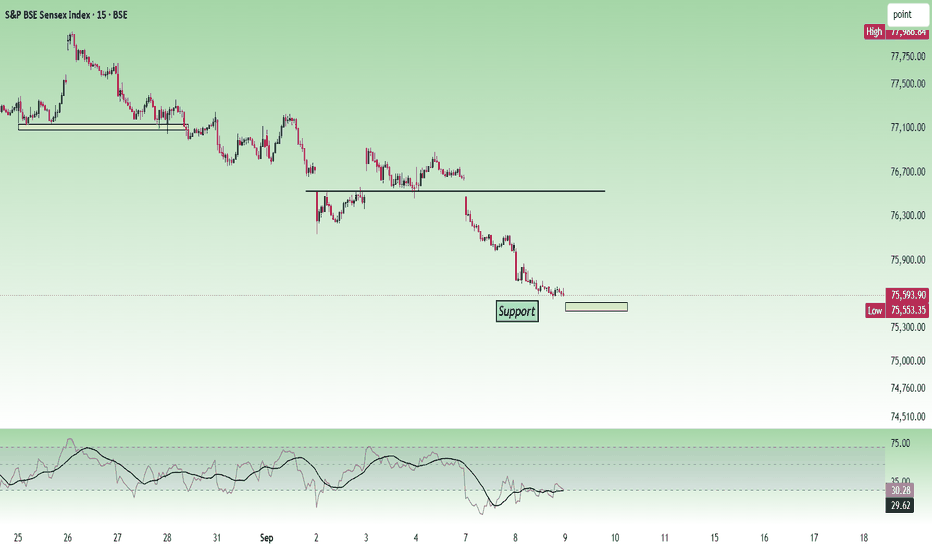
Important demand zone coming up!As we can see NIFTY had been falling unidirectionally after getting rejected from our important supply zone, as expected. Now we can see NIFTY heading towards an important demand zone followed by a trendline suppport. So, we can expect NIFTY to show some short covering after taking support at these levels. So, plan your trades accordingly and keep watching.