Inverse Head and Shoulders
TATAMOTORS-PV | Inverse Head & Shoulders —Right Shoulder FormingOverview
Tata Motors Passenger Vehicles is forming a textbook Inverse Head & Shoulders pattern on the Daily chart — one of the most reliable bullish reversal patterns in technical analysis. The pattern is currently in its final phase, with the Right Shoulder actively forming near current price levels. A breakout above the Neckline at ₹414 would confirm the pattern and signal a potential major trend reversal.
The Broader Context — Descending Channel
Since the highs of late 2025, TATAMOTORS-PV has been declining within a Descending Channel (green lines). The Inverse Head & Shoulders is forming within this channel — suggesting the stock may be building energy for a breakout from both the pattern and the channel simultaneously.
The Inverse Head & Shoulders — Three Phases
📉 Left Shoulder (February 2026)
Price declined to approximately ₹340 and recovered. This formed the left shoulder of the pattern.
📉 Head (March–April 2026)
Price made a deeper low at ₹294 — the lowest point of the entire pattern. This is the Head. The recovery from ₹294 was sharp and strong.
📉 Right Shoulder (June–July 2026 — Forming Now)
Price has declined again to approximately ₹340–345 — roughly symmetrical with the Left Shoulder. The Right Shoulder is currently forming at current price levels.
The Neckline — ₹414
The Neckline connects the peaks between the Left Shoulder and Head, and between the Head and Right Shoulder — sitting at approximately ₹414.
This is the most critical level on the chart. The pattern only confirms when price closes decisively above ₹414 on a daily basis. Until then, the Right Shoulder is still forming and the pattern is incomplete.
Key Levels
🟢 Right Shoulder Support — 340–345 (current area)
🔴 Neckline — 414 (pattern confirmation level)
🎯 Target if breakout — 500+ (measured move from Head to Neckline projected upward)
🔴 Head (Invalidation) — 294 (if broken, pattern fails)
Two Scenarios
🟢 Scenario A — Pattern Confirms
Price completes the Right Shoulder, bounces from current levels, and breaks above the Neckline at ₹414 on a daily close. This confirms the Inverse H&S and opens the path toward the measured move target of ₹500+.
🔴 Scenario B — Pattern Fails
Price breaks below the Head at ₹294 — this invalidates the Inverse H&S entirely and signals continued bearish pressure within the descending channel.
What the Inverse Head & Shoulders Teaches
The Inverse Head & Shoulders is a three-part story:
The Left Shoulder shows the first attempt at a low
The Head shows sellers making one final push to new lows
The Right Shoulder shows sellers failing to reach the Head's low — a sign of weakening bearish momentum
When the Right Shoulder forms at a higher level than the Head, it tells you sellers are losing strength. The Neckline breakout is the confirmation that buyers have taken control.
The pattern is only valid after Neckline confirmation — never before.
Conclusion
TATAMOTORS-PV is at a potentially significant turning point. The Inverse Head & Shoulders is forming with the Right Shoulder at current price levels. Watch for a daily close above ₹414 as the confirmation trigger.
Until then — observe, don't anticipate.
For educational purposes only. Not financial advice. Always manage your risk.
OLA Electric (Daily Chart) Analysis Inverse Head & ShouldersInverse Head & Shoulders Formation
The chart resembles a developing Inverse Head & Shoulders.
Fair Value Gap (FVG) Retest Zone
Your marked zone:
₹41.8 – ₹39.5
This area is acting as:
Previous breakout zone
Demand area
Fair Value Gap retest
Potential support
In SMC terms, this is a logical area where institutions may defend positions.
Bullish Scenario
If price:
Holds above ₹39–41
Shows bullish rejection candles
Maintains volume
Then continuation toward higher levels becomes possible.
Investment Opportunity (1-3 Months)
Aggressive Entry
₹39 – ₹42
Stop Loss
Daily close below ₹37
Targets
Target 1: ₹48
Target 2: ₹58
Target 3: ₹60-61
Risk-Reward
Risk ≈ ₹4-5
Potential Reward ≈ ₹18-20
Risk-Reward > 1:4
TRENT: Inverse Head & Shoulders Breakout1. The Macro Perspective: The Bullish Reversal
I am taking a LONG bias on Trent Limited (TRENT) on the daily (1D) timeframe. Following a significant corrective downtrend, the stock has carved out a textbook "Inverse Head and Shoulders" pattern. This is one of the most reliable and widely recognized structural formations in technical analysis, signaling the exhaustion of selling pressure and a definitive trend reversal from bearish to bullish.
2. The Educational Setup: Defining the Structure
To understand the technical validity behind this launch, look closely at how the price structure formed its core boundaries:
The Three Troughs: The pattern is characterized by three distinct lows: the Left Shoulder, the Head (the absolute lowest point marking capitulation), and the Right Shoulder (a higher low showing buyers stepping in earlier).
The Neckline Resistance: The definitive ceiling was the horizontal/slightly angled resistance line connecting the swing highs between the shoulders. This "neckline" acted as the final barrier of supply that had to be conquered to initiate the next leg higher.
3. Current Price Action: Neckline Breakout
The structural pressure has officially resolved to the upside. The price has printed a powerful green expansion candle, decisively obliterating the neckline resistance, and is currently trading strong at 3,179.70. This confirms the completion of the Inverse Head and Shoulders pattern. The stock has officially transitioned out of its accumulation phase and into a fresh, highly explosive markup trend.
Note: Always verify your EOD data to ensure the breakout holds through the final market close without leaving a large upper wick.
4. The Trade Plan: Entries, Targets, and Risk Management
Entry Strategy: Momentum is currently exceptionally strong. For those who did not catch the initial breach, a high-probability strategy is to look for a "structural retest." Look to scale into long positions on any minor consolidation that pulls the price back toward the broken neckline zone. Letting the old resistance line act as a concrete new support floor creates a highly favorable risk-to-reward entry.
Take Profit (Targets): We use a classical measured move strategy for Inverse Head and Shoulders breakouts. By taking the full depth of the pattern (the distance from the Head's lowest point up to the Neckline) and projecting it upward from the breakout point, our primary structural target sits comfortably in the 3,650.00 to 3,750.00 zone over the medium term.
Risk Management: An explosive structural reversal thesis is invalidated if the price fails to hold its newly claimed structural floor and collapses back below the neckline. A hard stop loss should be placed safely below the Right Shoulder structure, specifically around the 2,650.00 to 2,750.00 level. A definitive daily close back inside the old pattern would act as a warning sign.
5. Time Horizon:
Because this technical setup captures a clean structural reversal pattern on the 1-Day chart, this is a high-alpha swing trade designed to capture the next sustained markup phase over the coming weeks and months. Let the trend run!
QUESS: Inverse Head and Shoulders Bullish Reversal1. The Macro Perspective: The Inverse Head and Shoulders Formation
I am taking a LONG bias on Quess Corp Ltd (QUESS) based on the daily structure . This is a classical technical formation signaling a potential bullish trend reversal following a prolonged downtrend. After a significant downward move characterized by lower highs and lower lows, the stock formed a Left Shoulder, a deeper Head, and a higher Right Shoulder, indicating that selling pressure has reached an exhaustion point and buyers are becoming more aggressive. Fundamentally, this reversal pattern aligns with the company's strong Q4 FY26 performance, where they reported a net profit of ₹64.35 crore—a 167.42% year-on-year growth.
2. The Educational Setup: The Neckline Resistance
To understand the technical validity behind this reversal, look closely at how the price structure interacts with the core boundary:
The Neckline: The definitive line in the sand for a bullish structural shift is the resistance level connecting the highs formed between the shoulders and the head. A decisive breakout above this line is the key signal that the pattern is complete and an uptrend may be underway.
3. Current Price Action: Breakout Potential
The structure is poised for a significant move, and the recent structural formation suggests a potential shift from a bearish to a bullish market sentiment. Institutional buyers stepping in with conviction during a breakout above the neckline, ideally accompanied by high volume, would confirm the trend reversal.
4. The Trade Plan: Entries, Targets, and Risk Management
Entry Strategy: Traders often look to buy either on a confirmed breakout above the neckline resistance or on a retest of the neckline as new support.
Targets: A classical approach for measuring targets in an Inverse Head and Shoulders pattern is to take the vertical distance from the neckline to the head (the lowest point of the pattern) and project that distance upward from the breakout point.
Risk Management: A stop-loss is typically placed below the breakout resistance (neckline) or below the right shoulder to protect against a failed breakout, which would negate the bullish pattern.
5. Time Horizon:
Because this technical setup captures a clear structural reversal pattern, this is a high-alpha swing trade designed to capture a potential momentum shift. Let the trend run!
OCCLLTD: Inverse Head and Shoulders Bullish Reversal1. The Macro Perspective: The Inverse Head and Shoulders Formation
I am taking a LONG bias on OCCL Limited (OCCLLTD) based on the daily (1D) timeframe
When analyzing market structure, the Inverse Head and Shoulders is a classic technical formation signaling a potential bullish trend reversal following a prolonged downtrend. After a significant downward move characterized by lower highs and lower lows, the stock formed a Left Shoulder, a deeper Head, and a higher Right Shoulder, indicating that selling pressure has reached an exhaustion point and buyers are becoming more aggressive. Fundamentally, this reversal pattern aligns with the company's recent Q4 FY26 performance, where they reported a net profit of ₹19.35 crore. Documenting these classical reversal patterns makes the charting workflow highly repeatable for anyone analyzing momentum shifts.
2. The Educational Setup: The Neckline Resistance
To understand the technical validity behind this reversal, look closely at how the price structure interacts with the core boundary:
The Neckline: The definitive line in the sand for a bullish structural shift is the resistance level connecting the highs formed between the shoulders and the head. A decisive breakout above this line is the key signal that the pattern is complete and an uptrend may be underway.
3. Current Price Action: Breakout Potential
As of June 5, 2026, the stock was trading at approximately ₹115.67. The structure is poised for a significant move, and the stock has shown a positive trend over the last six months with a return of approximately 21.54%. Institutional buyers stepping in with conviction during a breakout above the neckline, ideally accompanied by high volume, would confirm the trend reversal.
4. The Trade Plan: Entries, Targets, and Risk Management
Entry Strategy: The technical pattern formed is an Inverse Head and Shoulders, which acts as a bullish reversal signal. Traders often look to buy either on a confirmed breakout above the neckline resistance or on a retest of the neckline as new support.
Take Profit (Targets): A classical approach for measuring targets in an Inverse Head and Shoulders pattern is to take the vertical distance from the neckline to the head (the lowest point of the pattern) and project that distance upward from the breakout point. Based on the depth of this formation, an initial technical target for OCCLLTD sits in the 140.00 to 145.00 zone.
Invalidation (Stop Loss): A stop-loss is typically placed below the neckline or below the right shoulder to protect against a failed breakout, which would negate the bullish pattern. A defensive stop-loss level would be below the right shoulder, specifically around the 95.00 to 100.00 range.
5. Time Horizon:
Because this technical setup captures a clear structural reversal pattern, this is a high-alpha swing trade designed to capture a potential momentum shift. Let the trend run!
SUDARSCHEM: Daily Inverse H&S Breakout1. The Macro Perspective: The Reversal Structure
I am taking a LONG bias on Sudarshan Chemical Industries Limited (SUDARSCHEM) on the daily (1D) timeframe.
When analyzing pure market structure, reversal patterns are critical to identifying shifts in major trends. Look at the structural development displayed on this chart. Following a painful and persistent markdown phase throughout late 2025 and early 2026, the stock carved out a deep structural bottom. Instead of a random V-shaped recovery, the stock systematically built out a textbook Inverse Head and Shoulders (H&S) pattern. This classic reversal structure visually maps the exact process of institutional accumulation, successfully transitioning the asset from a sequence of lower lows into a fresh structural uptrend.
2. The Educational Setup: The Inverse H&S and the Moving Averages
To understand the absolute technical validity behind this setup, look at the key components forming the reversal base:
The Pattern Construction: The chart perfectly defines the three foundational pillars of the reversal: a 'Left Shoulder', a deeper washout 'Head' marking the absolute floor near 741.15, and a higher-low 'Right Shoulder'. This higher low forming the right shoulder is the first major structural clue that selling pressure has completely exhausted and buyers are stepping in aggressively.
The Dynamic Cushion and Neckline: Notice how the price action behaved during the formation of the Right Shoulder. The stock decisively reclaimed the daily 20 SMA (the middle blue line of the Bollinger Bands, currently near 923.79), utilizing it as a dynamic launchpad. This rising support compressed the price action tightly against the solid black horizontal neckline at 978.60, which marks the absolute ceiling of the reversal pattern.
3. Current Price Action: Neckline Breakout and Volatility Expansion
Look at the most recent daily candles on the far right of the chart. The structural pressure cooker has exploded. Institutional buyers have stepped in with undeniable conviction, printing a massive, full-bodied green expansion candle that has surged out of the base, currently trading around 1,004.50. This vertical thrust has decisively obliterated the 978.60 neckline on an unmistakable volume surge (visible in the towering cyan volume bar below). Furthermore, the price has violently pierced the upper Bollinger Band, confirming a textbook shift out of accumulation and into a highly explosive, high-volatility markup trend.
4. The Trade Plan: Entries, Targets, and Risk Management
Entry Strategy: Momentum is exceptionally strong with the stock trading out in the open above the neckline. Chasing a vertical move immediately carries a short-term, lower-timeframe mean-reversion risk. The highest-probability, lowest-risk entry strategy involves waiting for a minor structural cooling-off period. Look to scale into long positions or place limit orders to catch a potential pullback to perfectly retest the broken 960.00 to 980.00 neckline zone. Letting old historical resistance prove itself as a concrete new support floor offers a phenomenal risk-to-reward ratio.
Take Profit (Targets): We use a classical measured move strategy based on the structural depth of the Inverse Head and Shoulders pattern. By taking the depth of the 'Head' (roughly 237 points from the 741.15 floor up to the 978.60 neckline) and projecting it upward from the breakout point, our primary structural target sits comfortably in the 1,200.00 to 1,220.00 zone. Intermediate profit-taking milestones rest near the psychological round numbers of 1,100.00 and 1,150.00.
Invalidation (Stop Loss): A structural reversal breakout thesis is completely invalidated if the price fails to hold its newly claimed neckline support and collapses back into the right shoulder. A hard stop loss should be placed safely below the daily 20 SMA and the mid-level of the Right Shoulder, specifically around the 880.00 to 900.00 level. A definitive daily close completely back below 860.00 would act as a severe warning sign of a failed reversal and a major bull trap.
5. Time Horizon:
Because this technical setup is built on a 1-Day chart capturing a classic structural reversal phase and a clear neckline breakout, this is a high-alpha swing trade designed to capture a rapid momentum markup phase over the coming weeks. Let the trend run!
Hang Seng Index (HSI) – Inverse H&S Breakout WatchHSI | Daily TF
Hang Seng Index is showing a clean recovery structure on the daily timeframe with multiple higher lows forming after the March correction.
An inverse Head & Shoulders pattern is visible, and price is now reclaiming the neckline zone around 26,200–26,400. Bulls are slowly gaining control as dips are getting bought aggressively.
Key levels to watch:
Neckline support: 26,200
Immediate resistance: 27,000
Major breakout zone: 28,100
Sustaining above the neckline can trigger a momentum move towards 27k+ levels, while a breakout above 28,100 may open doors for a fresh bullish rally.
As long as price holds above the support zone, buy-on-dips structure remains intact. Volume expansion near breakout levels will be the key confirmation signal.
⚠️ This is a technical analysis idea for educational purposes only, not financial advice. Please do your own research before making any trading decision .
If you like my analysis, don’t forget to boost, share & follow for more global index setups and price action ideas.
Gold Long Possible This is an early pattern but if Gold holds 4414 levels it may try to make a Inverse Head n Shoulder on 1 hour timeframe as you can see on the chart. Hence we can look to go long here on gold.
Entry- 4430-4425.
SL- 4414
Target- 4470, 4500, 4550.
Disclaimer - This is just for educational purposes.
Jai Shree Ram.
YES BANK BY KRS Charts2nd Sept 2025 / 10:01 AM
Why Yes Bank ?
1. last few years YES BANK is making HH & HLs in Monthly & Weekly TFs . It has potential technically, but will check our patience.
2. Above Chart it fills up all the FVGs - Fair Value Gaps and bounced back in Month of April. As we can see in Chart mentioned recently also same FVG reversal is visible.
3. Also Potential of Reversal chart pattern at bottom of trend is also visible.🤞
4. Less than 2 Rs Risk and Almost 5 Rs Reward is making this trade Safe 👍
5. Point to be noted 20.25 Rs is nearest Resistance and Pattern Target of 28 Rs unlock After breakout of neckline at 22 Rs.
Yes Bank : Ready to reward you ~30% in a YearHi Friends,
Yes Bank looks promising now & ready for ~29% (Target ~30) upward journey.
I am anticipating the stock to start its upward journey.
Pattern : Beautiful inverse Head and shoulder is getting formed .
Entry point : Entry point is above YELLOW line.
Stoploss : Stoploss will be 10% below the YELLOW line
Timeline : ~01 Year
Targets, Stoploss & Entry are mentioned in the chart .
Please feel free to share your views regarding this chart & analysis .
Note : I am not a SEBI registered advisor . Please consider my analysis only for Education purpose .
Kalyan Jewellers – Elliott Wave analysis for breakout.Kalyan Jewellers – Elliott Wave Validation (Daily Chart, IST)
Big Picture Structure
• Primary trend: Bullish
• Current degree: Wave (5) in progress
• Wave (4): Completed near ₹440–445
• Market is now transitioning from early Wave (5) into impulsive expansion
________________________________________
Role of the Inverted Head & Shoulders (IH&S)
• IH&S has formed after Wave (4) → classic trend-resumption pattern
• This pattern is acting as:
o A reversal from correction
o A launchpad for Wave (5)
Key Pattern Levels
• Head: ~₹440–445 (Wave 4 low)
• Left Shoulder: ~₹495–505
• Right Shoulder: ~₹485–495
• Neckline: ~₹520–525
________________________________________
Breakout Condition (Critical Point)
If today’s candle closes 515 , it confirms breakout
More precisely:
• Daily close above ₹515 with volume
= Confirmed IH&S breakout
= Start of impulse inside Wave (5)
Projected Targets – Elliott-Compliant
Targets are valid Fibonacci expansions from Wave (4) low.
Reference Points
• Wave (4) low: ~₹445
• Breakout zone: ~₹525
🎯 Targets Explained
Target Basis
₹610 0.618 extension of Wave (5)
₹699 Equality with prior Wave (1) / mid expansion
₹799 1.618 extension → typical Wave (5) extreme
✔ All three targets are Elliott-legal and realistic
✔ ₹799 also aligns with previous Wave (3) high, which is common in Wave (5)
Bank of Maharashtra trade for 18-20% upside.**Bank of Maharashtra (Weekly Chart – NSE)**
The stock has **completed its Wave-4 corrective phase** and subsequently formed a **clear Inverse Head & Shoulders (iH&S) pattern**, signalling the start of a **fresh impulsive move (Wave-5)**.
**Technical Observations**
* Wave-4 correction has ended near ₹45–46, respecting Elliott Wave rules
* iH&S neckline breakout confirms trend reversal
* Momentum indicators (RSI & MACD) support bullish continuation
* Price is holding above the breakout zone with healthy structure
**Strategy**
* **Accumulation Zone:** ₹60 – ₹65
* **Upside Target:** ₹75 – ₹80
* **Potential Upside:** ~18–20% from current levels
As long as the price sustains above the accumulation range, the structure remains constructive for further upside in the ongoing **Wave-5**.
This setup favours **accumulate-on-dips** rather than chasing extended candles.
---
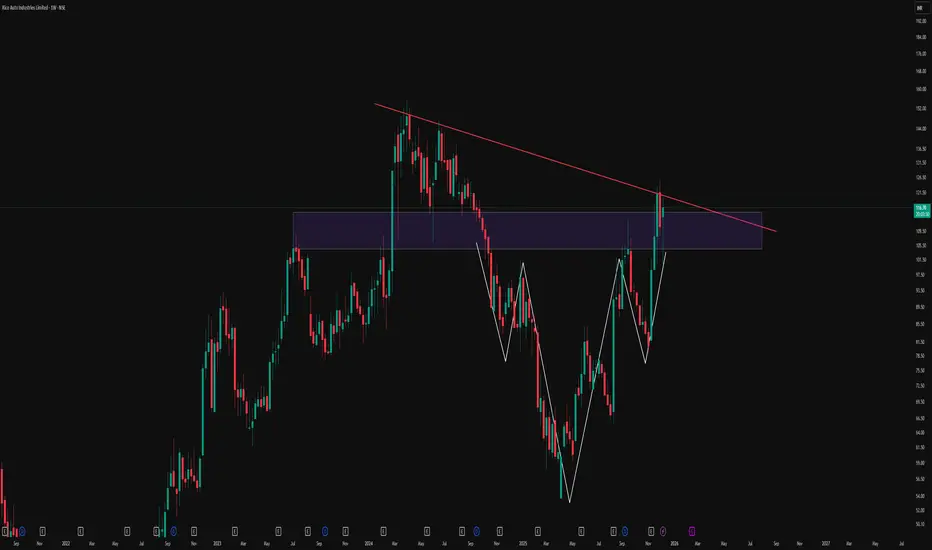
Reclaiming The Breakdown: Descending Triangle To Inverse HnSThis weekly chart of Rico Auto illustrates how structure can evolve over time and why rigid bias around a single pattern can be misleading. Price initially respected a clear descending trendline, forming a classic descending triangle and eventually breaking down below the support zone. Instead of continuing in a straight-line downtrend, the market absorbed that move and began to build a broader basing structure.
Over the following swings, price developed an inverted head and shoulders formation, highlighted here with the white structure, right inside and just below the prior breakdown area. As the pattern matured, price not only reclaimed the prior horizontal zone but also pushed back toward the original red counter-trendline that once acted as dynamic resistance. The same trendline that confirmed the initial triangle breakdown is now being revisited, showing how former breakdown structures can later turn into key decision zones rather than one-way signals.
This chart is shared purely to study how multiple patterns can co-exist and morph on higher timeframes:
-A descending triangle that initially breaks to the downside
-A subsequent inverse head and shoulders basing pattern
-A later reclaim of the old breakdown area and retest of the descending trendline
Disclaimer
This post is for educational and illustrative purposes only and is not investment, trading, or financial advice. Please do your own research and consult a registered financial professional before making any trading or investment decisions.
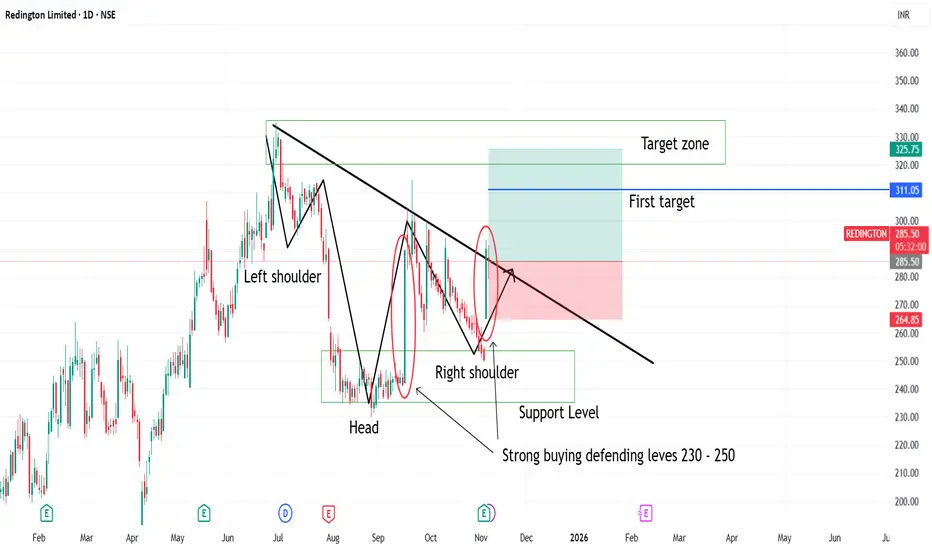
Inverse head and shoulder formed in reddington1. Inverse head and shoulder formation on Support levels showing buyers will take control from here
2. With minimum downside one can watch for long upside movement shown as target zone on charts
3. The strong movement has shown after result which tells us if movement continues then target may come soon
4. SL is strict as if move fails then not giving chance to get trapped
#Silver | Falling Wedge + Inverse H&S = Bullish Cocktail#XAGUSD | 4H Chart
Head & Shoulders completed its breakdown target ✅
Price found support at the demand zone, formed a falling wedge breakout, and built an Inverse H&S.
Now consolidating right below the neckline, watching Immediate Resistance @48.464 👀
Above this, potential retest of key resistance zone 49.459 – 50.475/50.897 (previous H&S breakdown area).
Bias: Bullish above 48.464; confirmation on 4H close 🔥
#Silver #XAGUSD #HeadnShoulders #FallingWedge #InverseHeadnShoulders #PriceAction
📌 Disclaimer: This analysis is shared for educational purposes only. It is not a buy/sell recommendation. Please do your own research before making any trading decisions.
BAJAJ HINDUSTANHello & welcome to this analysis
The daily time frame has formed an Inverse Head & Shoulder pattern suggesting upside levels of 24.50 & 26.50 as long as it does not breach 20.95
A healthy Risk : Reward ratio set up for short term trading in this small cap sugar sector stock
All the best
#MuhuratPick | #Kalamandir: Inverse Head & Shoulders in Play✨ #MuhuratPick 🪔
Celebrate this Diwali with a stock that could bring you festive returns!
CMP: 175
🔽 Supports: 163 - 164 / 152
🔼 Resistances: 193 - 202 / 241
❌ Invalidation Level: 149.50 (Weekly Close Below)
✴️ Breakout Point: Weekly close above the neckline (Pink dotted line)
🎯 Pattern Target: 290+ (+66% from CMP)
📈 All-Time High: 312
🚀 Can Go Big in the Long-Term
#InverseHeadAndShoulders | #ChartPatterns | #DiwaliPick | #Investing | #MuhuratTrading | #LongTerm | #PriceAction
📌 Disclaimer: This analysis is shared for educational purposes only. It is not a buy/sell recommendation. Please do your own research before making any trading decisions.
#PNB | Inverse Head & Shoulders Bullish SetupCMP: 113.70
🔼 Key Resistance Levels: 118 / 120 / 143
🔽 Key Support Levels: 113.30 - 110.50 / 107.30
❌ Invalidation Level: 100.60 (Weekly Close Below)
✴️ Breakout Point: Weekly close above the neckline (Pink dotted line) 👀
🎯 Pattern Target: 145 (+27% from CMP)
#PNB | #InverseHeadAndShoulders | #ChartPatterns | #PriceAction | #SwingTrading
📌 Disclaimer: This analysis is shared for educational purposes only. It is not a buy/sell recommendation. Please do your own research before making any trading decisions.