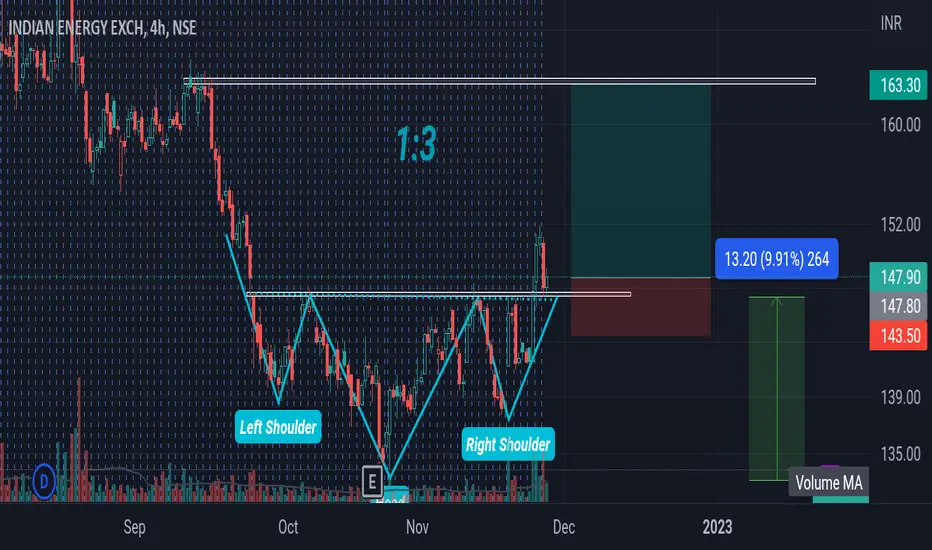
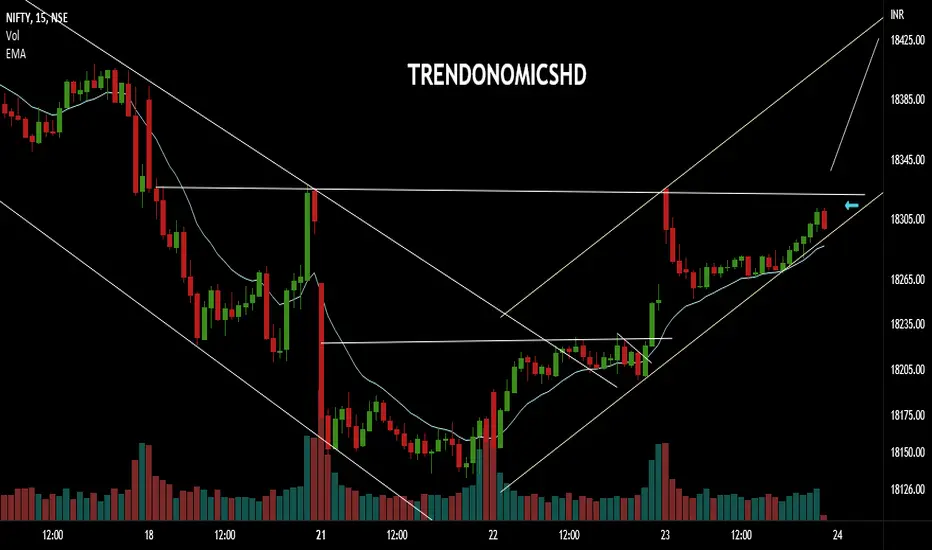
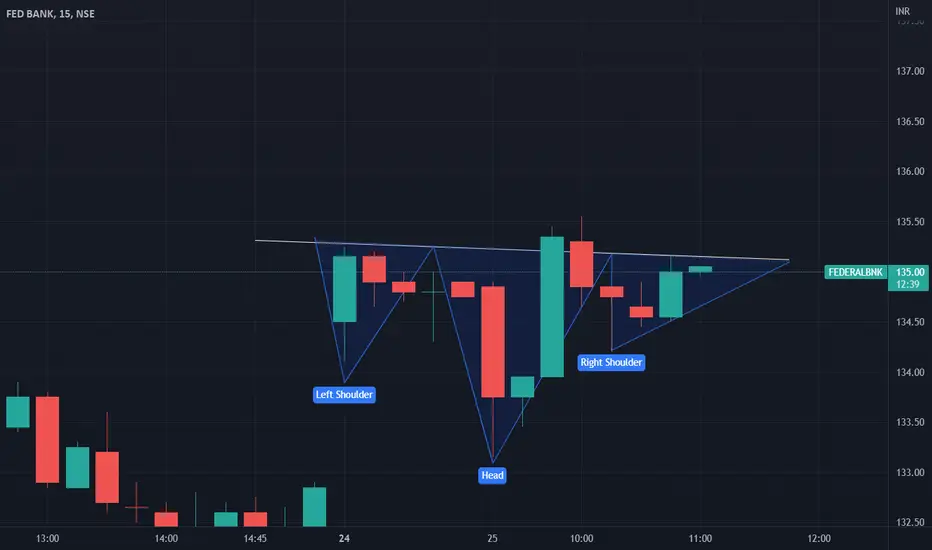
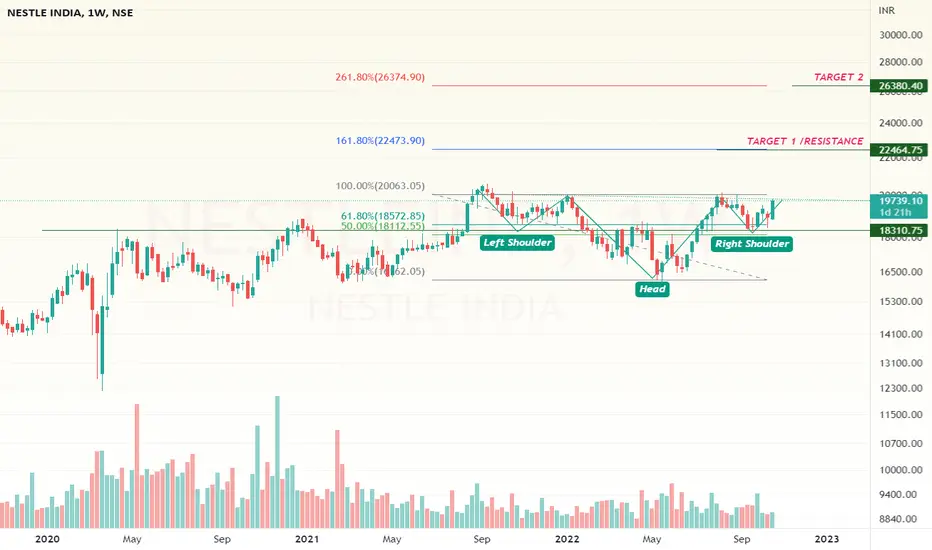
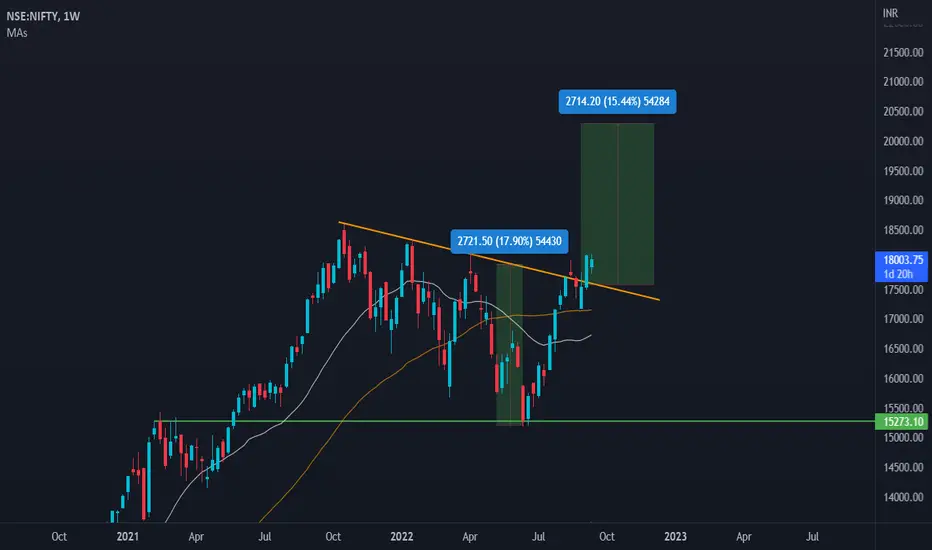
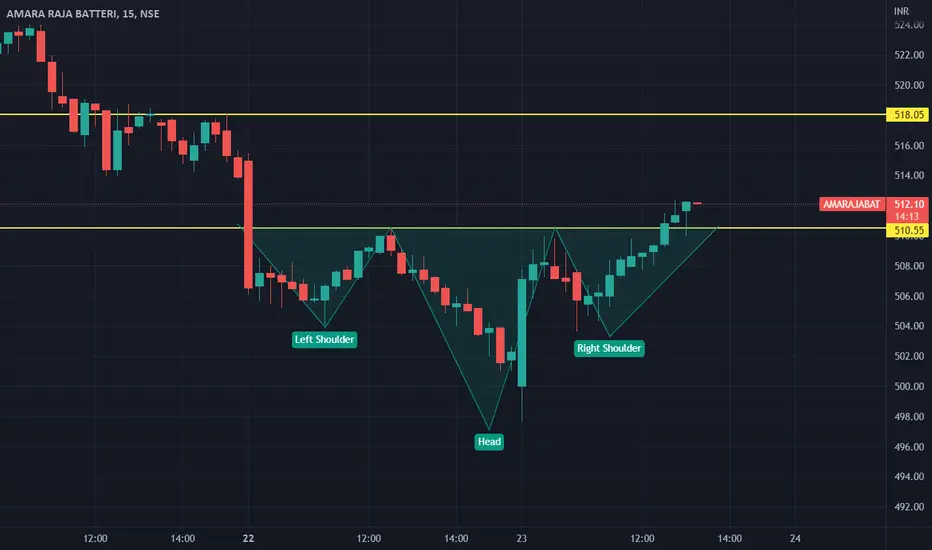
Inverse Head and Shoulders
HDFC Bank | Inverse H&S in formation | 35% upsideNSE:HDFCBANK
Inverse Head & Shoulder under formation whose BO neckline is at 1510
Triple Bottom on Weekly Chart made on multi-year support line
CMP @1450 is bouncing from Short Term EMAs. Upside from CMP ~35%
Based on Fibonacci Next Tgts : 1558 - 1720 - 1980
SL : 1260
Time Frame : 3 to 12 Months
For Learning Purpose
Chaukhambha_Charts
SUPREME INDUSTRIES LTD - Inverse Head & Shoulder + Cup & Handle 📊 Script: SUPREMEIND (SUPREME INDUSTRIES LIMITED)
📊 Nifty50 Stock: NO
📊 Sectoral Index: NIFTY 500 / NIFTY MIDCAP
📊 Sector: Industrials Capital Goods
📊 Industry: Plastic Products - Industrial
Key highlights: 💡⚡
📈 Script is trading at upper band of Bollinger Bands (BB) and giving breakout of it.
📈 MACD is giving crossover.
📈 Double Moving Averages also giving crossover.
📈 Volume is increasing along with price which is volume breakout.
📈 Script is giving breakout of Inverse Head & Shoulder + Cu
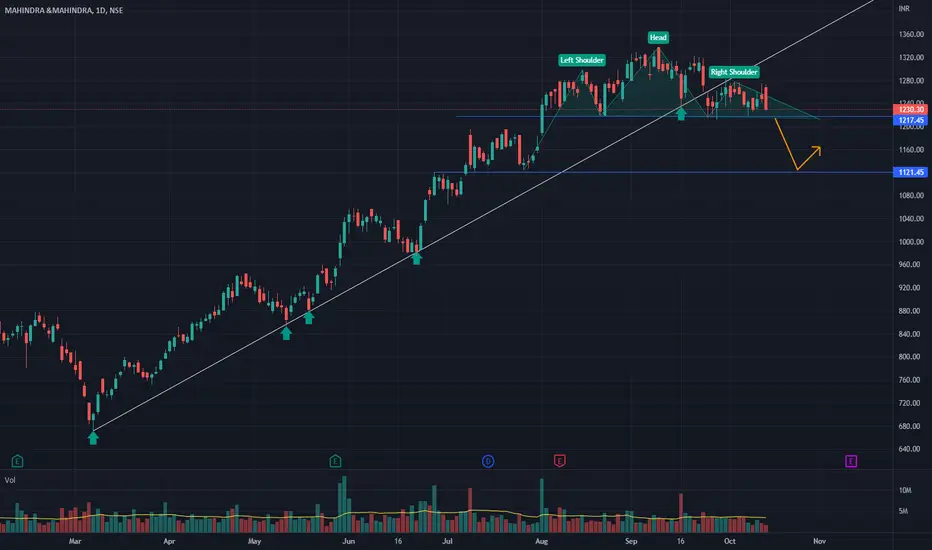
M&M M&M has formed a Head and shoulder pattern on top and its neckline is forming at 1217. A close below these levels might gave more immediate downside till 1120 levels. Also a break of long term trendline already broken shows some weakness at higher levels.
Happy Trading :)
Disc: Chart posted only for learning purpose.
Affordable Gold during Festive SeasonThangamayil Jewellery Ltd
Gold Chart is looking weak as attached below and I'm assuming that Gold would get even cheaper in days to come. Hence, I believe with this festive season being majorly Covid free, people may want to celebrate extravagantly after the low key past couple of years.
The only drawback here is that Pledged percentage is 14.8 %
Promoter holding 66.7 %
Market Cap 1,810 Cr.
Stock P/E 27.8
Industry P/E
Godrej Properties: Elliott Wave View (Update)Godrej Properties has shown good strength for its upside. It has also formed an interesting structure
at the bottom which is called inverse head and shoulder. The breakout of the neckline may further accelerate the move
towards our fist target of 1494 and breaking that will achieve our ultimate target of 1553 of our internal wave 3. Staying
with the stock may generated good returns in short term.
Wave counts internal waves for other wave count you can visit the last analysis of the Godrej p
btc inverse head and shoulders so yesterday morning i marked this symetrical triangle out traded a long as it was forming the head (which i didnt know at that time) knowing that this triangle would break to the up well have a better chance to break to the up rather then the down woke up this morning its smashed through the triangle giving a 3% gain/rise retraced back down to make a hl and use the traingle upper level as support at the same time made an inverse head and shoulders so if we play out the way that these patterns n
Inverse Head and Shoulder pattern in Natural gas -1hr time frameNatural gas is given the Inverse Head and Shoulder pattern. Price broke out from the neck line and has retraced. This pattern will become more sustainable and powerful if we see another rally on the upside thereby confirming the greater chances of successful completion of the pattern. Fundamentally, natural gas prices are bound to go up given the shortage of it in European Markets arising due to bottlenecks in production and supply of it from Russia. Hence, this could be a great opportunity to g
ALong
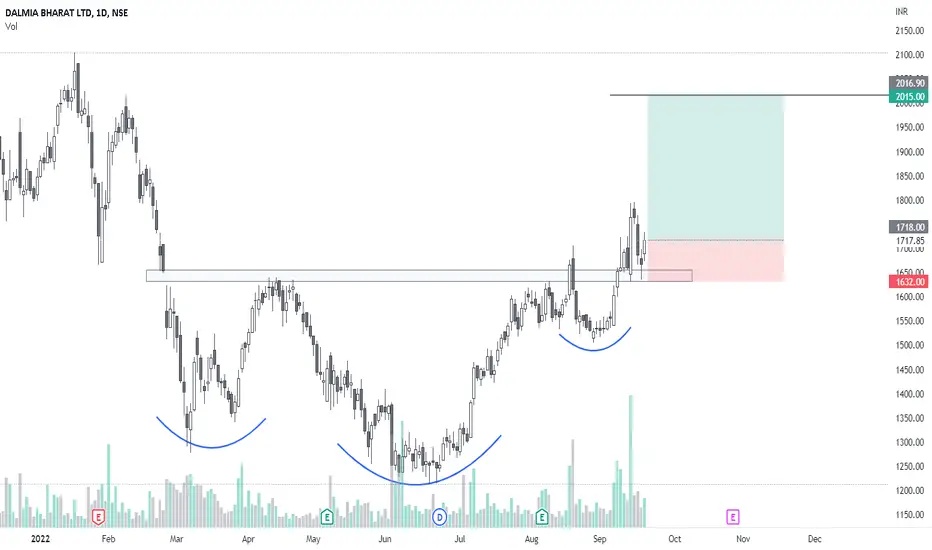
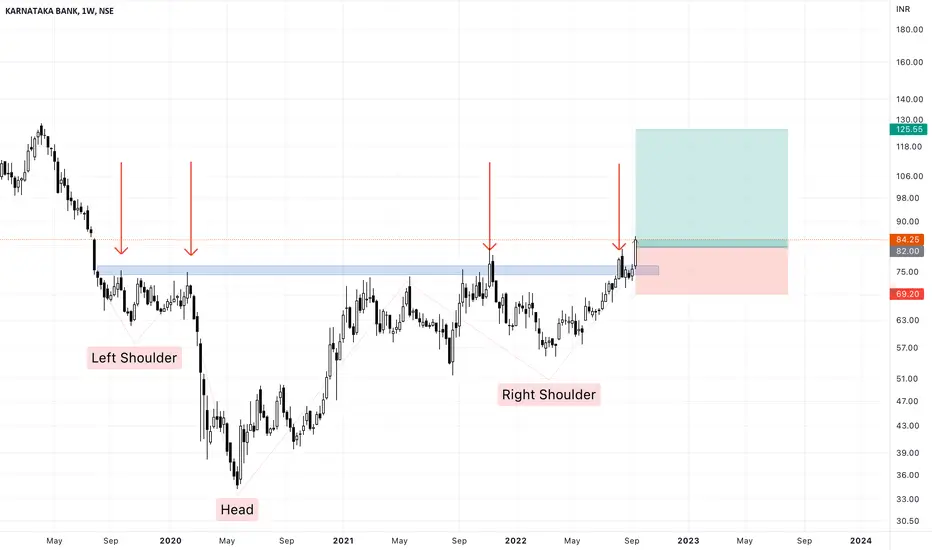
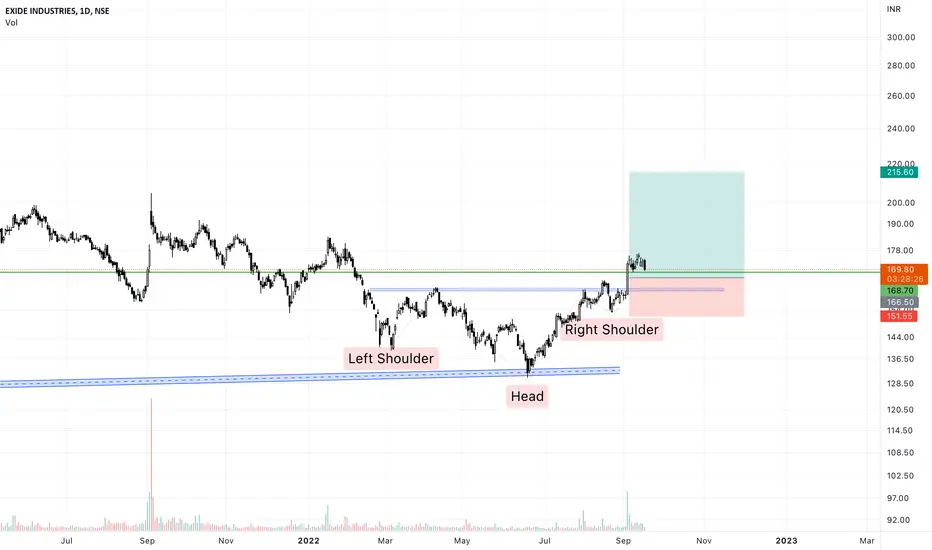
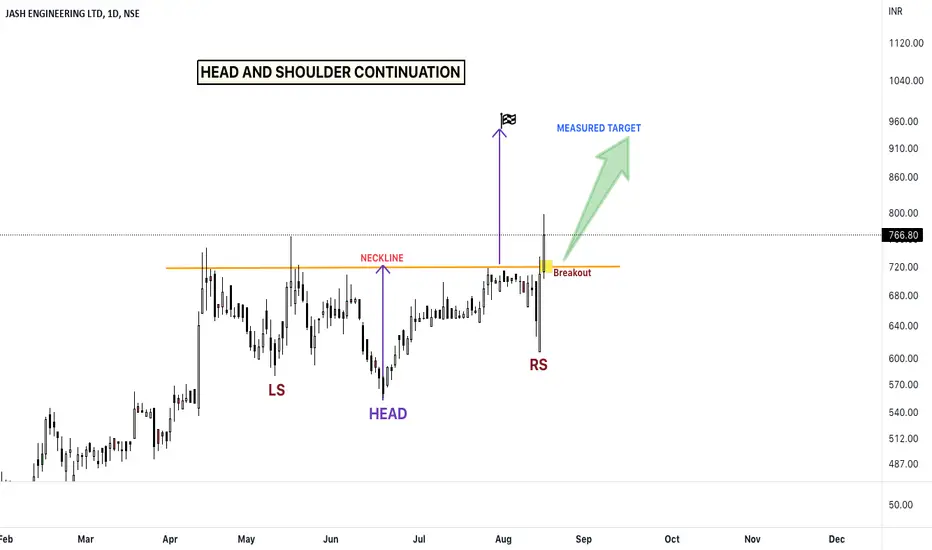
JASH: Inverse H&S Continuation Inverse Head and Shoulders Continuation:
This pattern forms in an extensive upside rally. It consists of a left shoulder, a head, and a right shoulder.
At the end of the left shoulder, a minor correction takes place on the upside which happens on the low volumes comparatively the starting of the left shoulder. After this again a down move can be seen on large volumes forming a head having its bottom is below the left shoulder following an upmove correction on lower volumes & completing the hea