Happiest Minds : Inverse H&S BreakoutInverse Head and Shoulders
This pattern forms after an extensive downside rally. It consists of a left shoulder, a head, and a right shoulder. The left shoulder is formed after a big bear rally in which the volumes are quite large.
At the end of the left shoulder, a minor correction takes place on the upside which happens on the low volumes comparatively the starting of the left shoulder. After this again a down move can be seen on large volumes forming a head having its bottom is below the le
Inverse Head and Shoulders
ANGEL ONE - Trend Analysis - Swing TradingANGEL ONE - Trend Analysis - Swing Trading
1. Forming Inverted head and shoulder patterns in the weekly timeframe.
2. First target will be 1450, it may hit in a week span... This should be a very quick swing trading... more than 10% return in a week...
3. If it crosses 1450 then it will complete the inverted head and shoulder patterns, the target will be 1800 to 1820... It may take several weeks.
4. If it crosses the all-time high of 2020 then the target will be more than 2500+.... this may tak
Multiple Reversal patterns in Nifty IT !!!As visible on charts CNXIT has given a breakout from multiple reversal patterns
which are Island Reversal, Double Bottom, Inverse Head & Shoulder.
CNXIT has formed double bottom around 26450 along with RSI divergence
and finally given its breakout at 28600.
The index fell with a gap and also reversed with a gap hence, leaving
behind an island and showing an island reversal pattern.
Along, with above two patterns, inverse head & shoulder are also visible
which further conforms to a reversal
BEML: Inverse Head and Shoulder BreakoutInverse Head and Shoulders
This pattern forms after an extensive downside rally. It consists of a left shoulder, a head, and a right shoulder. The left shoulder is formed after a big bear rally in which the volumes are quite large.
At the end of the left shoulder, a minor correction takes place on the upside which happens on the low volumes comparatively the starting of the left shoulder. After this again a down move can be seen on large volumes forming a head having its bottom is below the le
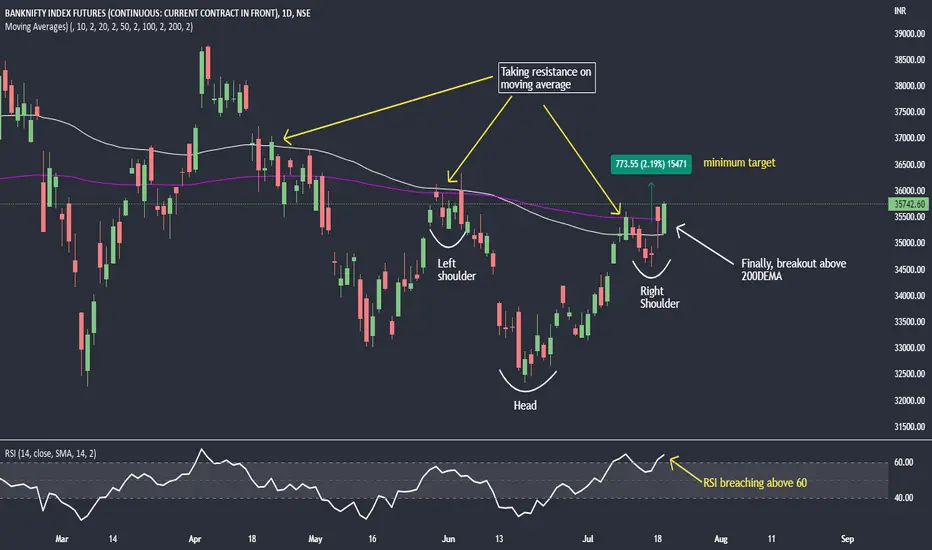
Dual breakout in Banknifty !!!!As, chart says banknifty have given breakout above 200DEMA where,
it has faced resistance 3 times earlier.
RSI above 60 indicating strength in breakout and confirms it's reliability.
Also, breakout from inverted head & shoulder pattern is visible.
Minimum target of this pattern comes to 36150 but it can move above this also.
I'll try to publish an elaborate idea on banknifty as it's PE stands on 17.71 below 1,3,5yrs average
and has strong buying interest at 15.54.
Watch for a massive move !!!Aster DM is standing at the door of breakout passing which, could
witness a massive move.
Inverse head & shoulder pattern which was under construction from
9 months is ready for a breakout.
Indications which are suggesting breakout is volume buzzing and RSI breaching
above 60.
After, breakout levels up to 236 is possible but till then, keep a keen watch on it.
INVERSE head and shoulder in HINDPETROWe can initiate a long swing trade in hpcl if it gives closing above the levels of 245 forming an inverted head and shoulder pattern.
It's a high dividend paying stock as well so one can think of adding some quantity in the portfolio. A trend reversa NSE:HINDPETRO l could happen.
Inverse hns in jubliant food works 1d chartThere could be a buying a signal when the price breaks the residence level shown in the chart and also we can see a inverse head and shoulders chart pattern on 1day time frame.
Note: i am not a professional or any financial advisor, just sharing my thoughts.
Trade at your own risk.
Inverse Head and Shoulder Price Pattern on Astrazeneca PharmaInverse Head and Shoulder Price Pattern on Astrazeneca Pharma with pullback happening and if breakout the level of 3130 with descent volume then we can look for the target of 3709 level. Keep the stop loss at 3098. Great reward risk ratio of 18:1.
NIFTY UPCOMING JOURNEY PREDICTION 20-07-22DRAWINGS IN THE CHART
Showing NIFTY CURRENT PICTURE, the Head and Shoulder Pattern.
NIFTY BIG PICTURE drawing is not shown, but dates are mentioned, so you can visualise or draw on your charts as per the dates and levels mentioned.
NIFTY BIG PICTURE
Since 05.05.2022, Nifty is in the process of forming Inverted Head and Shoulder pattern in the hourly chart.
From 05.05.2022 to 03-06-2022, formation of Left Shoulder with its peak placed at 15750.
Its Neckline has been placed at 16800. This l
Hindustan unilever should you pick it right nowNSE: HINDUNILVR
If Breaks Then The Targets could be Taken at 2551
Time Frame :- 1 Hour
Patterns Name :- Inverse Head and Shoulders
We are not responsible for any profit or loss
Based on Your Own Risk this is only to Show you the Current Pattern
Comment Below If You want to ask me questions on this on any other idea
BTW Like and Follow if you like this awesome content
Made By MAYANKTECHRESEARCHING
Maruti The Reason of going up NSE: MARUTI
Time Frame :- 1 Month
Patterns Name :- Inverse Head and Shoulders
Conclusion :-
A Inverse Head and Shoulders pattern which is a Bullish Pattern and a signal before the Uptrend which most probably shows up a down trend .
We are not responsible for any profit or loss
Based on Your Own Risk this is only to Show you the Current Pattern
Comment Below If You want to ask me questions on this on any other idea
BTW Like and Follow if you like this awesome content
Made By MAYANKTECHRESEARCH
Should you buy it or notNSE: AMBUJACEM
If Breaks Then The Targets could be Taken at 378
Time Frame :- 1 Hour
Patterns Name :- Inverse Head and Shoulders
We are not responsible for any profit or loss
Based on Your Own Risk this is only to Show you the Current Pattern
Comment Below If You want to ask me questions on this on any other idea
BTW Like and Follow if you like this awesome content
Made By MAYANKTECHRESEARCHING
Asian paints can be up NSE: ASIANPAINT
If Breaks Then The Targets could be Taken at 3074
Time Frame :- 1 Day
Patterns Name :- Inverse Head and Shoulders
We are not responsible for any profit or loss
Based on Your Own Risk this is only to Show you the Current Pattern
Comment Below If You want to ask me questions on this on any other idea
BTW Like and Follow if you like this awesome content
Made By MAYANKTECHRESEARCHING
Shree Cement Should you take itNSE: SHREECEM
If Breaks Then The Targets could be Taken at 21080
Time Frame :- 1 Hour
Patterns Name :- Inverse Head and Shoulders
We are not responsible for any profit or loss
Based on Your Own Risk this is only to Show you the Current Pattern
Comment Below If You want to ask me questions on this on any other idea
BTW Like and Follow if you like this awesome content
Made By MAYANKTECHRESEARCHING
GOdrej Consumer will you take it ?NSE: GODREJCP
If Breaks Then The Targets could be Taken at 892
Time Frame :- 1 Hour
Patterns Name :- Inverse Head and Shoulders
We are not responsible for any profit or loss
Based on Your Own Risk this is only to Show you the Current Pattern
Comment Below If You want to ask me questions on this on any other idea
BTW Like and Follow if you like this awesome content
Made By MAYANKTECHRESEARCHING
Acc is this a good oppurtunityNSE: ACC
If Breaks Then The Targets could be Taken at 2265
Time Frame :- 1 Hour
Patterns Name :- Inverse Head and Shoulders
We are not responsible for any profit or loss
Based on Your Own Risk this is only to Show you the Current Pattern
Comment Below If You want to ask me questions on this on any other idea
BTW Like and Follow if you like this awesome content
Made By MAYANKTECHRESEARCHING