#Silver | Falling Wedge + Inverse H&S = Bullish Cocktail#XAGUSD | 4H Chart
Head & Shoulders completed its breakdown target ✅
Price found support at the demand zone, formed a falling wedge breakout, and built an Inverse H&S.
Now consolidating right below the neckline, watching Immediate Resistance @48.464 👀
Above this, potential retest of key resistance zone 49.459 – 50.475/50.897 (previous H&S breakdown area).
Bias: Bullish above 48.464; confirmation on 4H close 🔥
#Silver #XAGUSD #HeadnShoulders #FallingWedge #InverseHeadnShoulders #PriceActi
Inverse Head and Shoulders
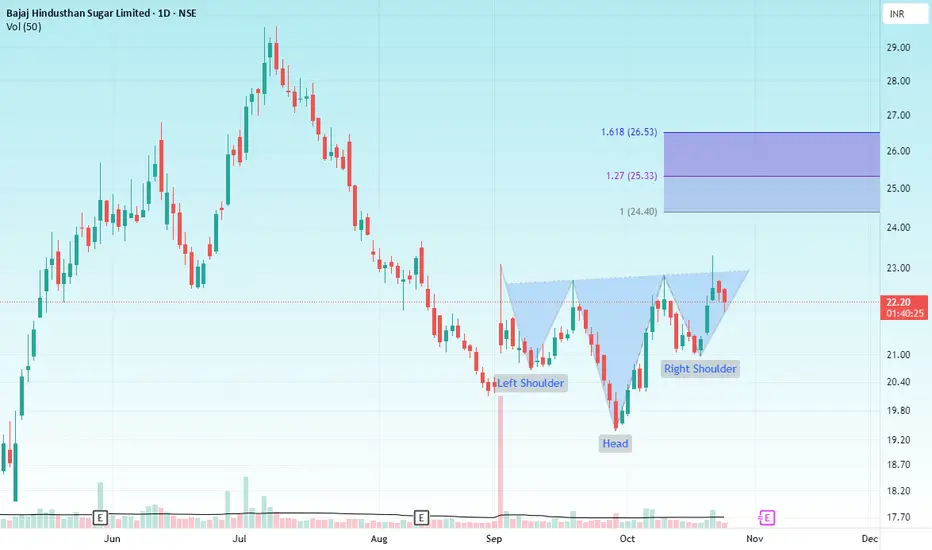
BAJAJ HINDUSTANHello & welcome to this analysis
The daily time frame has formed an Inverse Head & Shoulder pattern suggesting upside levels of 24.50 & 26.50 as long as it does not breach 20.95
A healthy Risk : Reward ratio set up for short term trading in this small cap sugar sector stock
All the best
#MuhuratPick | #Kalamandir: Inverse Head & Shoulders in Play✨ #MuhuratPick 🪔
Celebrate this Diwali with a stock that could bring you festive returns!
CMP: 175
🔽 Supports: 163 - 164 / 152
🔼 Resistances: 193 - 202 / 241
❌ Invalidation Level: 149.50 (Weekly Close Below)
✴️ Breakout Point: Weekly close above the neckline (Pink dotted line)
🎯 Pattern Target: 290+ (+66% from CMP)
📈 All-Time High: 312
🚀 Can Go Big in the Long-Term
#InverseHeadAndShoulders | #ChartPatterns | #DiwaliPick | #Investing | #MuhuratTrading | #LongTerm | #
#PNB | Inverse Head & Shoulders Bullish SetupCMP: 113.70
🔼 Key Resistance Levels: 118 / 120 / 143
🔽 Key Support Levels: 113.30 - 110.50 / 107.30
❌ Invalidation Level: 100.60 (Weekly Close Below)
✴️ Breakout Point: Weekly close above the neckline (Pink dotted line) 👀
🎯 Pattern Target: 145 (+27% from CMP)
#PNB | #InverseHeadAndShoulders | #ChartPatterns | #PriceAction | #SwingTrading
📌 Disclaimer: This analysis is shared for educational purposes only. It is not a buy/sell recommendation. Please do your own research before m
Missed the PSU Bank Rally? #PSUBNKBEES Still Has 24% Upside!CMP: 85.83
PSUBNKBEES has confirmed a classic Inverse Head & Shoulders breakout on the weekly chart , with two consecutive weekly closes above the neckline , a strong technical validation of the pattern.
🔹 Key Levels:
📌 Breakout Level: 84
🔽 Support Zone: 83.45 – 79.50
🔼 Overhead Resistance: 90.30
🎯 Pattern Target: 104 ( ~24% upside from breakout)
This ETF gives broad exposure to PSU banks , making it a lower-risk, sector-wide play for positional investors.
💡 If you are
#CNXPSUBANK | Breakout Alert – Inverse Head & Shoulders in Play!CMP: 7,698
PSU BANK index has confirmed a classic Inverse Head & Shoulders breakout on the weekly chart, signaling a strong bullish reversal !
🔹 Neckline Breakout: Weekly close confirmed above 7,324
🔹 Overhead Resistance: 8,053
🔹 Support Zones:
▫️ 7,305 – 7,248
▫️ 7,163 – 7,025
🔹 Pattern Target: 9,000+ (1,740 pts move → +23% upside )
🔹 Invalidation Level: Below 6,730 WCB (Weekly Closing Basis)
✅ Pattern indicates a powerful trend shift — bulls are stepping up aggressive
TATA MOTORS Hello & welcome to this analysis
The stock in daily time frame has given a double breakout
Inverse Head & Shoulder
Bullish Harmonic Seahorse
The upside levels as per IHS are 740 & 790 while the Seahorse pattern is indicating 775.
Both patterns have strong support at 690-700 and both would be considered invalid below 665
All the best
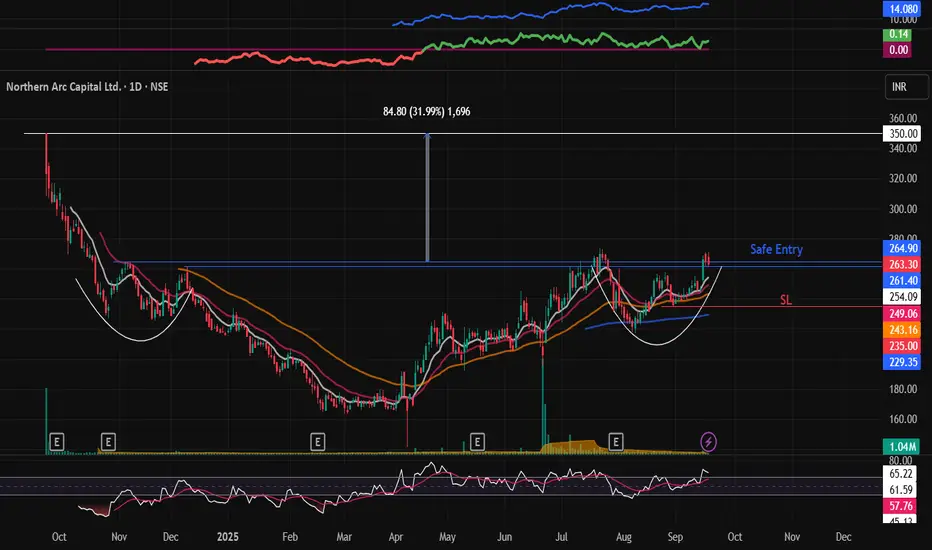
NORTHARC : Swing pick#NORTHARC #patterntrading #chartpattern #inverseheadandshoulder #breakoutstock #swingtrade #trendingstock
NORTHARC :
>> Low PE Stock
>> Chart pattern Trading
>> Inverse Head & Shoulder pattern
>> Volumes Building up
>> Stock showing strength
Swing Traders can lock profit at 10% and keep Trailing
Please Boost, comment and follow us for more Learnings.
Disc : Charts shared are for learning purpose only, not a Trade recommendation. Do your own research and consult your financial advisor before
CHENNAI PETRO-BLEND OF TECHNOFUNDABuy CHENNAI PETRO 680 TILL 610 FOR target of 740 and 850. Classic blend of fundamental a technical analysis. Bullish flag and inverse head & shoulder breakout happening at 630 levels.
Also available near P to B/V with dividend yield above 8%.
view invalid below 580.
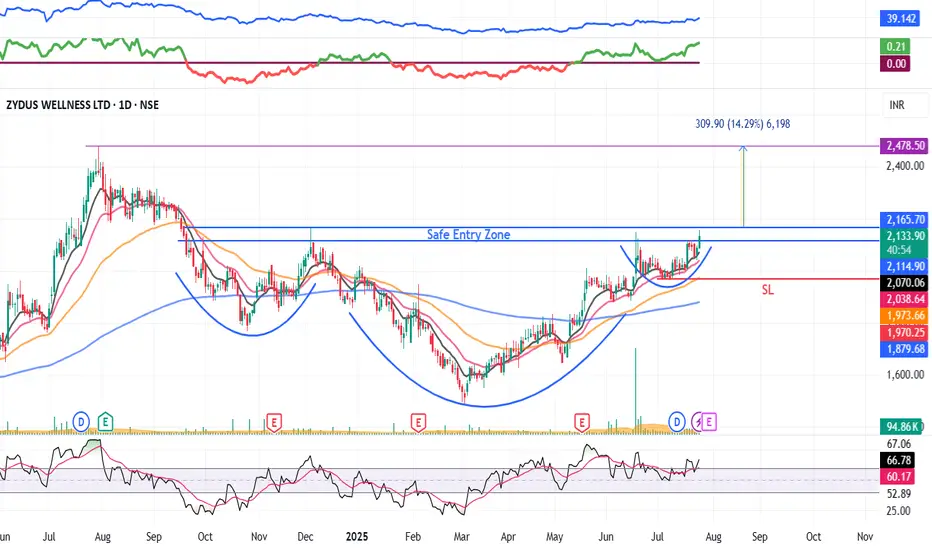
ZYDUSWELL : Inverse Head & Shoulder chart pattern#ZYDUSWELL #patterntrading #chartpattern #breakouttrading #inverseheadandshoulder #trendingstock
ZYDUSWELL : Swing Trade
>> Breakout candidate
>> Inverse Head & shoulder pattern
>> Trending stock
>> Good Strength & Volume
Swing Traders can lock profit at 10% and keep trailing
Pls comment, Boost & follow for more such Analysis
Disc : Charts shared are for Learning purpose and not a Trade recommendation. Consult a SEBI Registered advisor before taking position in it
JINDALSTEL : pattern breakout#JINDALSTEL #patterntrading #chartpatternbreakout #swingtrading
JINDALSTEL : Swing Trading
>> Breakout soon
>> Inverse Head & Shoulder pattern
>> Good Strength & Volumes Buildup
>> Trending setup
Swing Traders can lock profits at 10% and keep Trailing
Pls boost, Comment & Follow for more Analysis
Disc : Charts shared are for Learning purpose and not a Trade recommendation. Pls consult your Financial Advisor or a SEBI Registered Advisor before taking position in it
APOLLOHOSP Soon to ATH??!!!Yessss!!!!!
Chart patterns looks prudent for the above titled opinion
Rounding bottom....with a Inverted H&S pattern awaiting a Breakout!!!!!!
Expecting a Breakout by this week or next.
We can make our entry after the breakout solid candle....
Just add it to your watchlist and keep an eye on it!!!!
will update once the breakout happens!!!!!
just my opinion....not an advice nor tip....
Thank you!!!!!!
TVS Supply Chain: BO attempt after 6 Month Consolidation.This Supply Chain Giant is attempting to break out. After 6 Months of Consolidation - Is it Time to Load Up? Let's analyse today's Idea.
Price Action Analysis:
Current Market Structure:
• Stock is currently trading at ₹143.33, showing a strong +6.83% gain
• Price has broken above a key resistance zone around the ₹140 level
• Clear uptrend formation with a higher highs and higher lows pattern emerging
• Recent breakout attempt from a prolonged consolidation phase
Historical Price Movement
CNXITThe CNX IT index is currently forming an inverse Head & Shoulders pattern, a bullish reversal formation. The index made a bottom at 30918 on 7th April 2024, which aligns with a prior support zone tested on 4th June 2024, followed by a strong upward move. This double test of support indicates a solid base formation.
If the pattern plays out, a breakout above the neckline could open the way toward the supply zone of 41600–43430, where previous selling pressure was observed.
Anant Raj: Triple Bottom Reversal Pattern, Trendline BO.NSE:ANANTRAJ Made a Beautiful Chart Structure of a Triple Bottom reversal pattern, Sort of Inverse H&S confirmation and Trendline BO. Post Excellent Q4 Results, with Good Price and Volume action.
Price Action:
- It experienced a sharp decline in January 2025, falling from ₹950 to the ₹550 level.
- Further correction took it to lows near ₹420 in March-May 2025
- Currently showing signs of recovery at ₹514.10, up ₹40.50 (+8.55%) in today's session.
- Breaking above the descending trendline (w
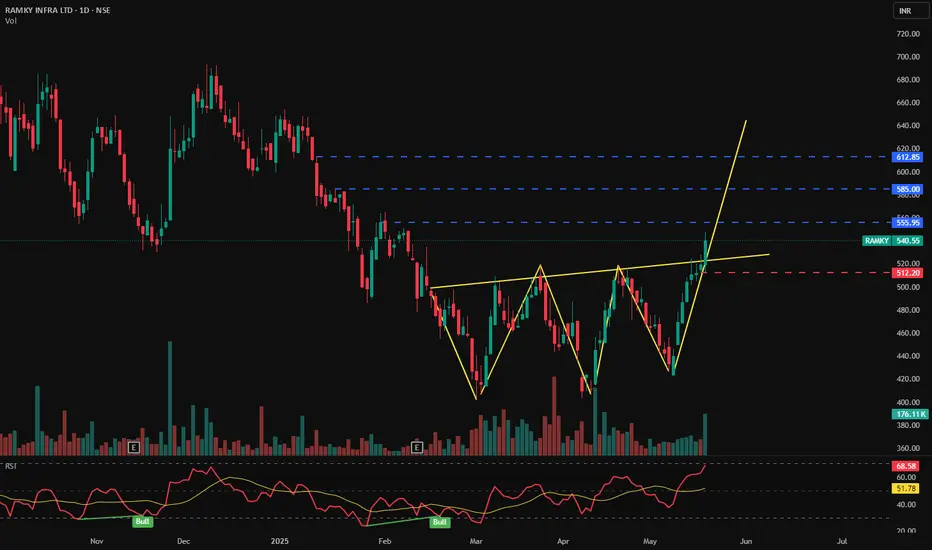
RAMKY INFRA LTD - Bullish Pattern📊 RAMKY INFRA LTD (1D) – CMP ₹540.55
📅 Date: May 21, 2025
📈 Exchange: NSE
📌 Ticker: RAMKY
🧠 Technical Analysis Overview
✅ Bullish Inverse Head & Shoulders Pattern:
Price has broken out of a clearly formed inverse head and shoulders pattern — a powerful trend reversal structure — indicating a strong bullish sentiment and possible long-term uptrend.
✅ Breakout Confirmation:
A sharp breakout above the neckline near ₹512 has occurred with strong bullish momentum and increased volume.
✅ RSI Indica
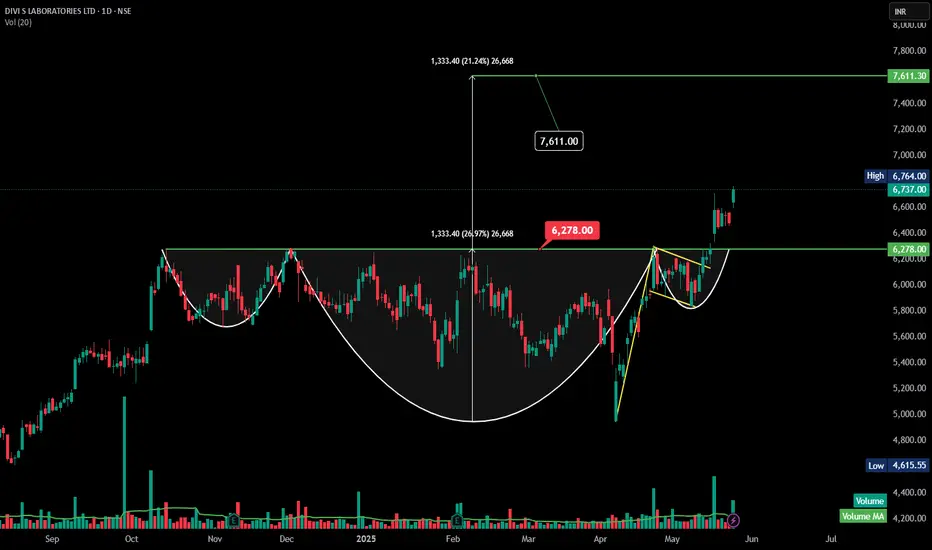
DIVISLAB -Inverted Head and Shoulders -DailyThanks for the clarification! Yes — the chart **does** resemble an **Inverted Head and Shoulders** pattern (a bullish reversal pattern), especially visible in the price structure before the breakout above ₹6,278.
---
### 🟢 **Inverted Head and Shoulders – Analysis (Divi's Lab)**
#### **Pattern Structure:**
* **Left Shoulder:** Formed in March.
* **Head:** Deepest low around early April.
* **Right Shoulder:** Higher low formed in late April to early May.
* **Neckline:** Breakout above the ₹6,2
KITEX – Breakout from ATH KITEX – Breakout from ATH ⚠️ Risky but Noteworthy
CMP: ₹311
Breakout Zone: ₹296
Structure: Inverse Head & Shoulders (Daily TF)
Trend: Trading above key DMAs
Volume: On the lower side — no strong confirmation yet
Event Risk: Quarterly results approaching
KITEX has shown an aggressive bounce and is now breaking out of an all-time high zone around ₹296. The structure resembles a head and shoulders variant on the daily timeframe. While technically constructive, volume hasn't confirmed yet, which in
Alkem Labs-Inverse Head & Shoulder Pattern Breakout ( Bullish )Alkem Labs broke the neckline of Inverted Head and Shoulder on the daily chart with good volumes and it is looking good for a decent run.
The inverse head and shoulders pattern is a bullish reversal pattern in technical analysis, indicating a potential shift from a downtrend to an uptrend. It's characterized by three consecutive troughs, with the middle trough (the "head") being the lowest, and the other two troughs (the "shoulders") forming higher lows. The neckline is a trendline connecting