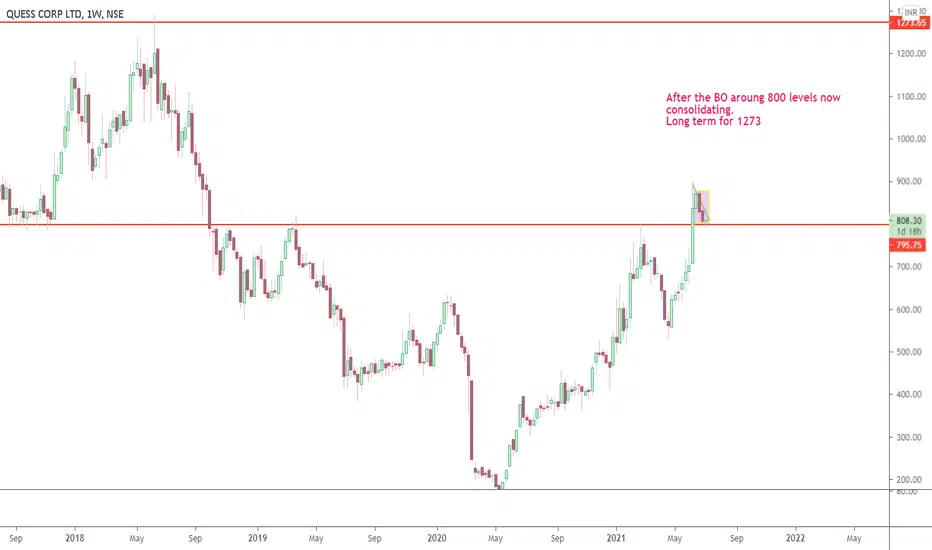
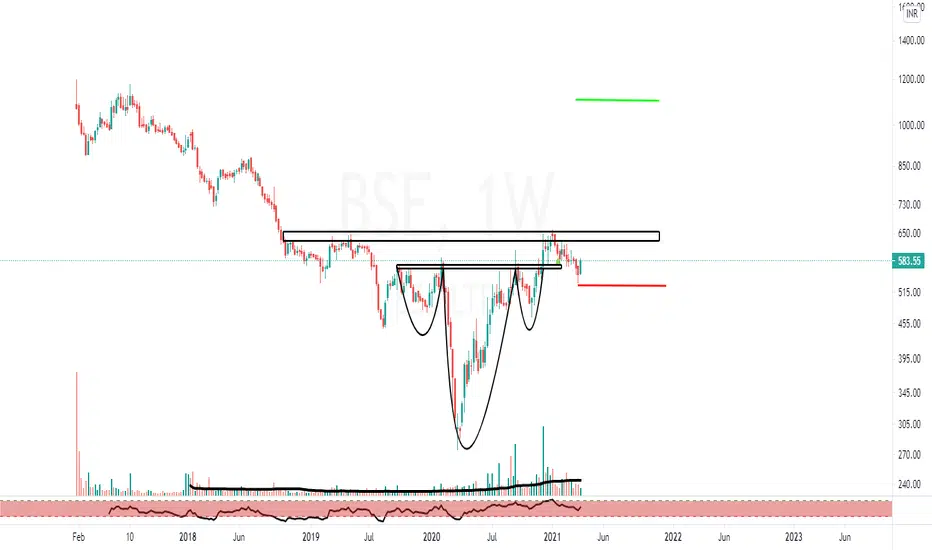
Inverse Head and Shoulders
Buy Hdfc Life Insurance --Long Term Investment IdeaIt is a Weekly Timeframe Analysis for long Term Purpose.
Buy Hdfc Life near 625-650 Stoploss 540 Target 960
Pattern : Inverse Head & Shoulder Pattern. Retest area 625-650 Zone
Target is calculated on the basis of Pattern Structure i.e. Low of Head to Breakout Point
LT approaching a crucial resistanceStock of L&T is forming an Inverted Head & shoulders in weekly Time frame with the zone of 1580-1600 as the neck line.
One can go long ONLY if there is a weekly closing above 1600 for minimum target of 1900 with SL as 1450 DCB.
On daily TF too, the stock is making an IVHS at the same level which can be a congruence to the analysis.
This is just for educational purposes. Hope you find this analysis interesting!
icici bankICICI Bank: 10 yr upward channel consolidation breakout with retest...if bank nifty goes bullish from here then stock to watch is ICICI bank, axis bank and sbi bank...any dip in nifty/bnf then add one from these 3 in portfolio...tgt 680/720/771 with sl of 557...also on daily chart its inverse head n shoulder.
What is Inverse Head and Shoulders Pattern?Inverse Head and shoulders Pattern is the mirror image of head and shoulders pattern.
Read about Head and Shoulder Pattern here:
Inverse H&S Pattern is bullish reversal pattern. Signals the traders to enter into long position above the neckline.
Volume play a major role in both H&S and Inverse H&S Patterns. Usually the spike in volume on breakout is considered as a great signal for bullish entry.
Again a suitable target can be obtained by measuring the distance between head and nec
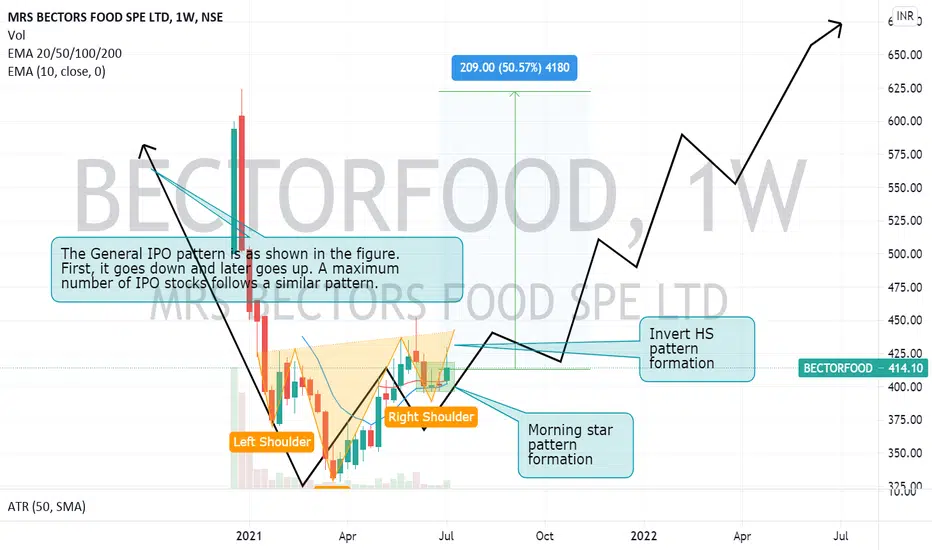
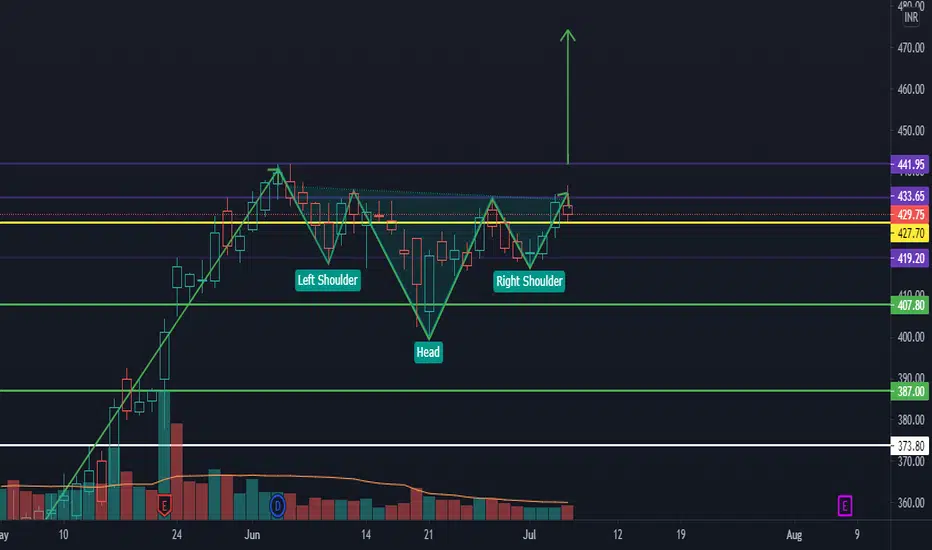
Long On BECTORFOODNSE:BECTORFOOD
Why long?
1. It is following the General IPO pattern and also below trend reversal patterns giving extra support for going long.
2. Invert HS pattern
3. Morning star pattern formation
4. Good RR
Note: : This is only for educational purposes and do your analysis before investing.
LT is ready for BOOM ?LT has formed an Inverted Head and shoulder pattern inside an inverted head and shoulder pattern on weekly and daily charts as well. If it closes above 1600, It might start rallying from that level.
Cheers! This is as per my Analysis. Feel free to share your view about this. Please do your analysis before trading/Investing.
Happy Trading.
KRBL Inverse head and shoulders pattern breakout possibleKRBL Formed Inverse head and shoulders pattern at bottom of trend.
Volume has started picking up gave bullish close above 300 today.
Can enter long near 290-80 with 233 stop loss for long term targets 650
DISCLAIMER:There is no guarantee of profits or no exceptions from losses. The study provided is solely the personal views of my research. You are advised to rely on your judgment while investing/Trading decisions. Past performance is not an indicator of future returns. Investment is subject