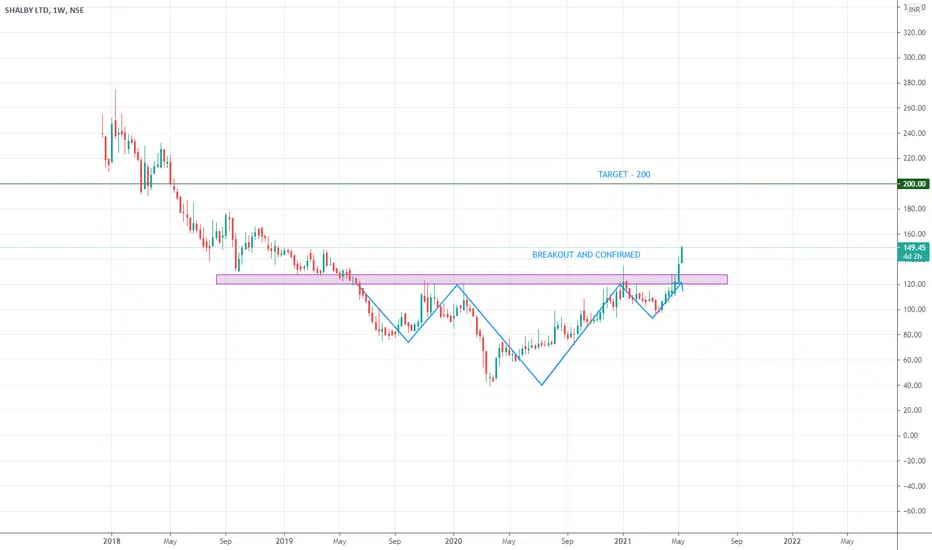
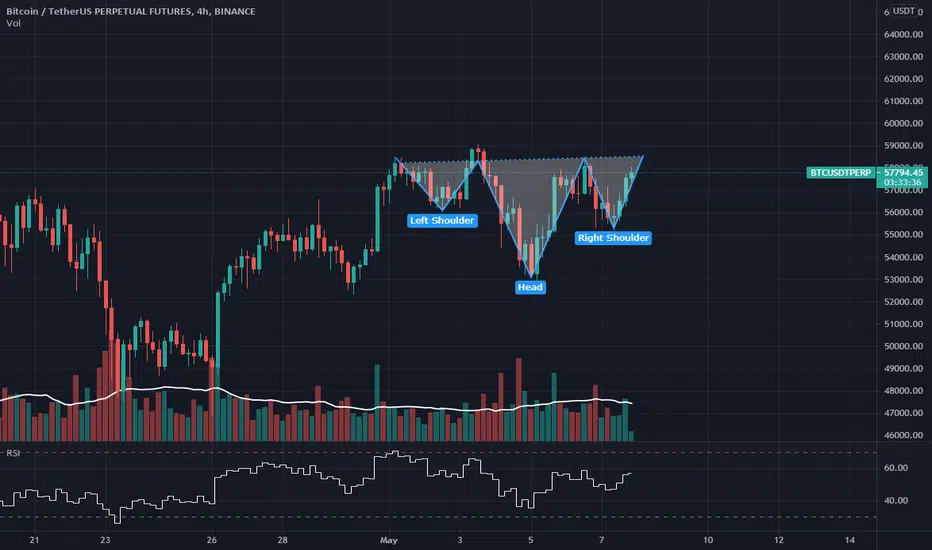
Inverse Head and Shoulders
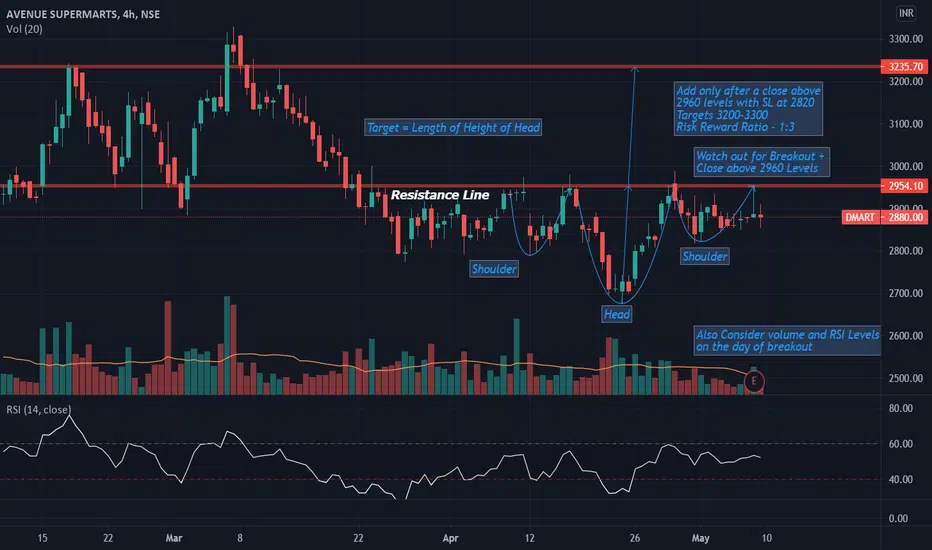
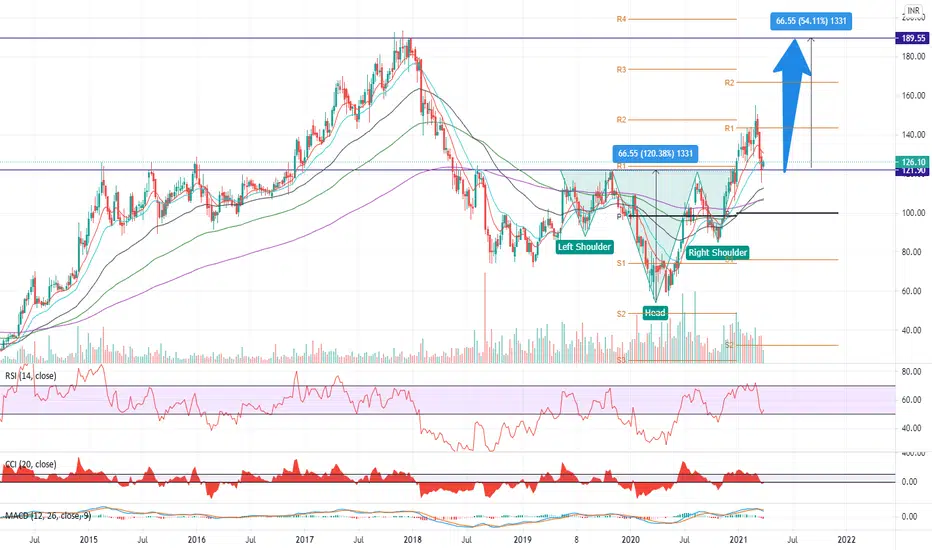
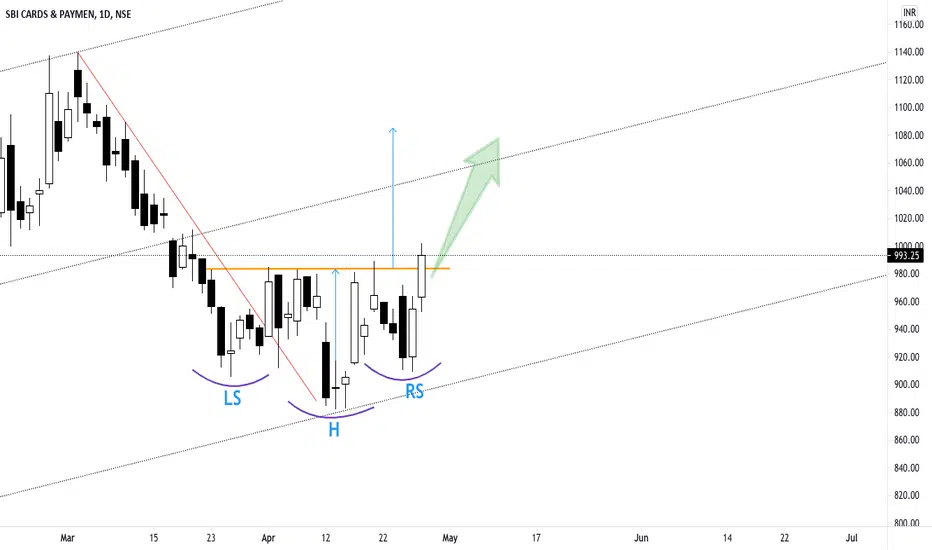
Resistance Breakout with Inverse Head & Shoulder FormationAvenue Supermarts (Dmart) is involved in the business activities of Retail trade, except of motor vehicles and motorcycles.
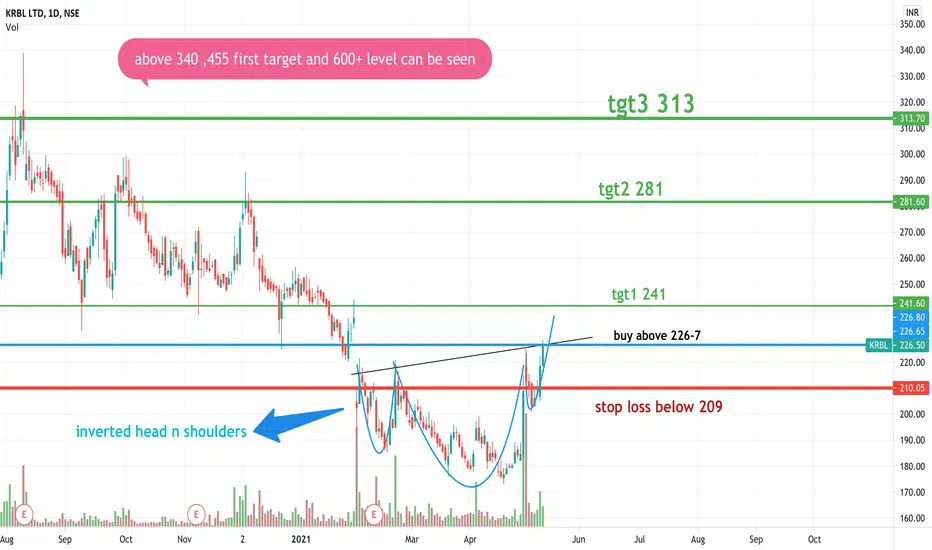
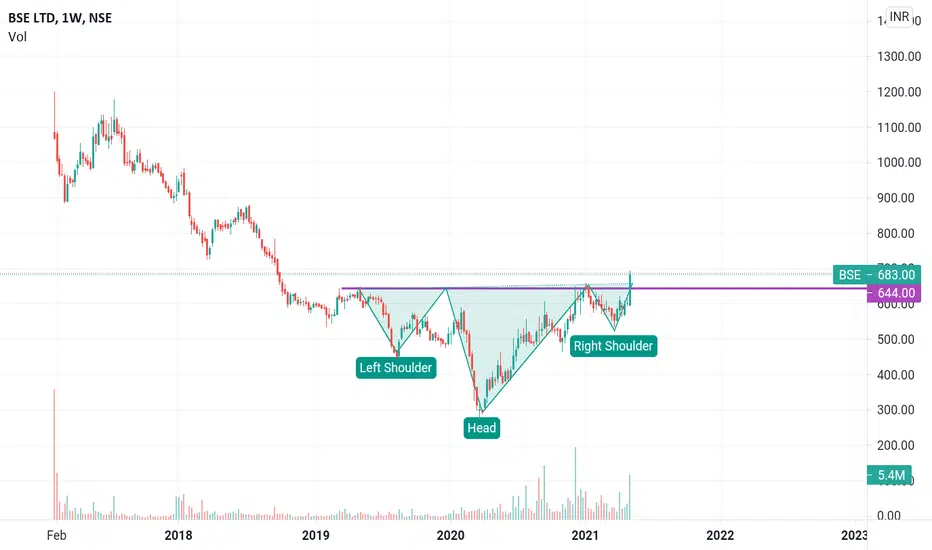
The Stock has formed an inverse Head & Shoulder on Charts and is ready to breakout. The Stock is technically placed below 50 DMA and around 100 DMA.
The Company is fundamentally very sound. The company is debt free and has a strong balance sheet enabling it to report stable earnings growth across business cycles. An annual revenue growth of 24% is outstanding & ROE of 11
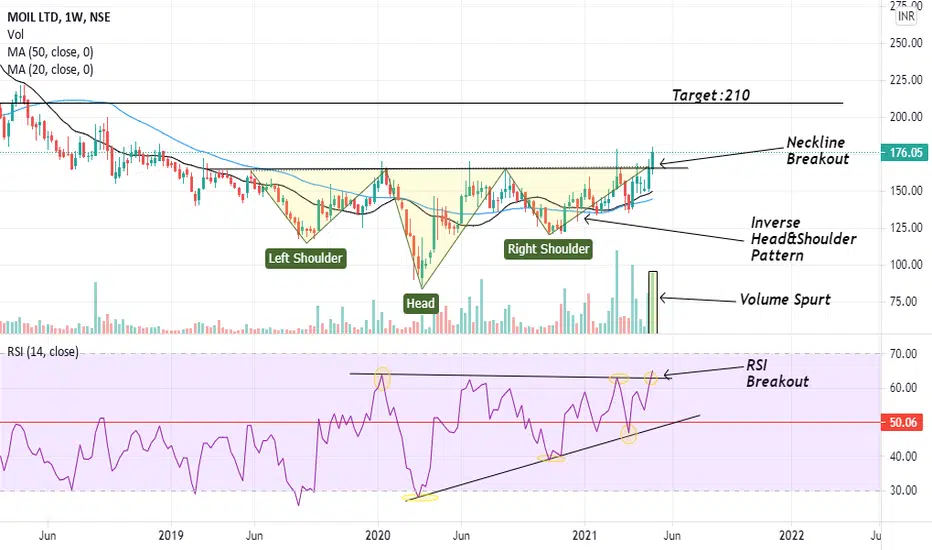
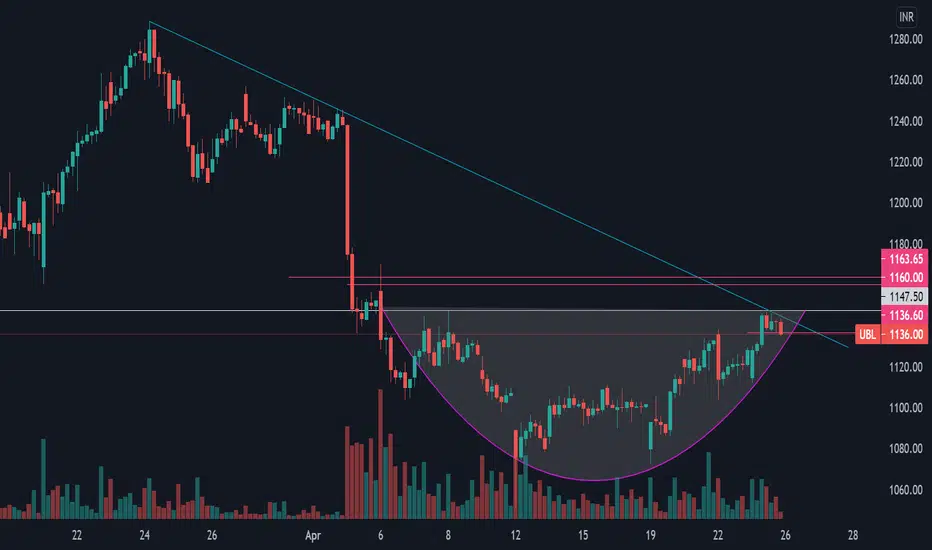
HIGH PROBABILITY SETUP ON MOIL LTDFew takeaways from my analysis on MOIL LTD.
1.Inverse head& shoulder pattern breakout: stock broke out of the pattern(neckline resistance) after long consolidation period.
2.Volume spurt: breakout supported by decent volume, indicating bullishness.
3.Moving averages : stock trading above 20MA And 50MA on weekly chart, Also trading above 50MA and 200MA on daily.
4.RSI: breaking out of weekly resistance on rsi and trading above 60.
Short term view: Bullish
Timeframe used : weekly
Short term Targ
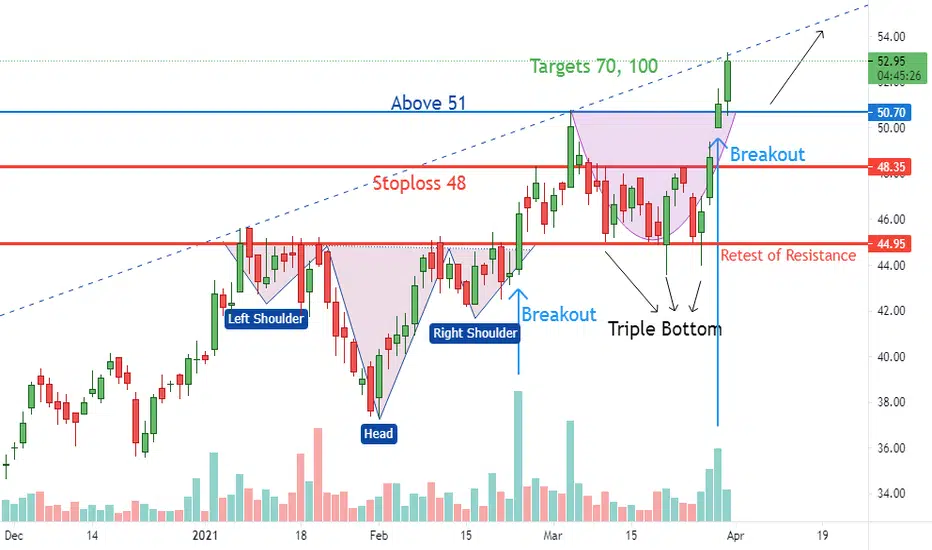
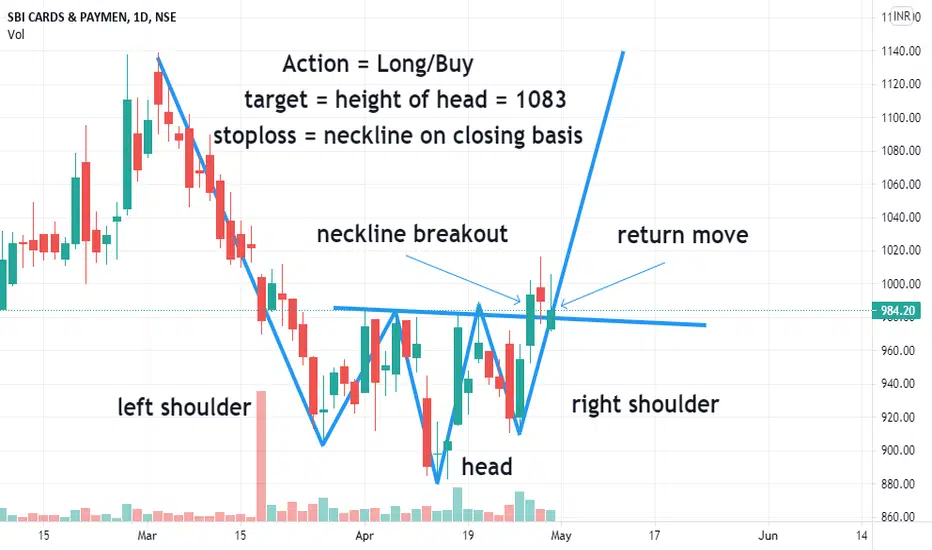
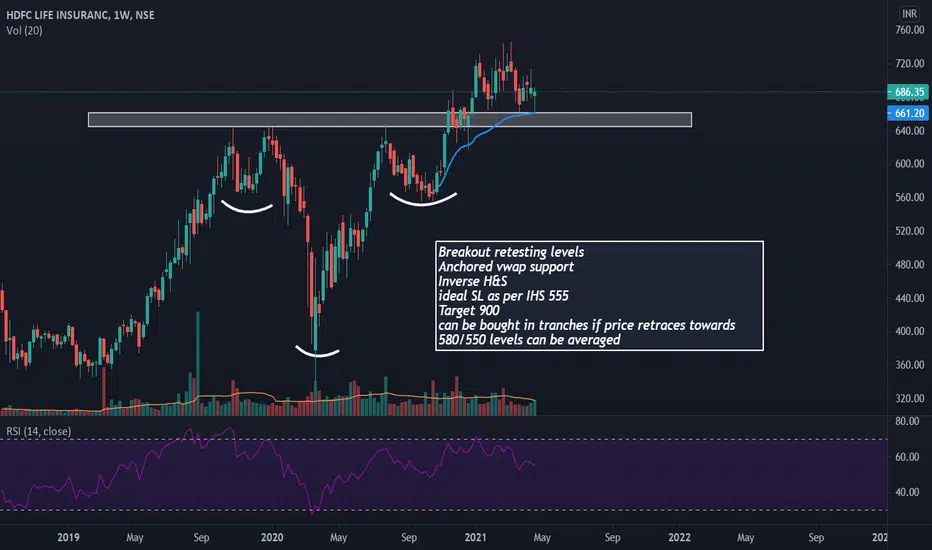
TATA STEEL BSL - Good SetupThe chart is self explanatory.
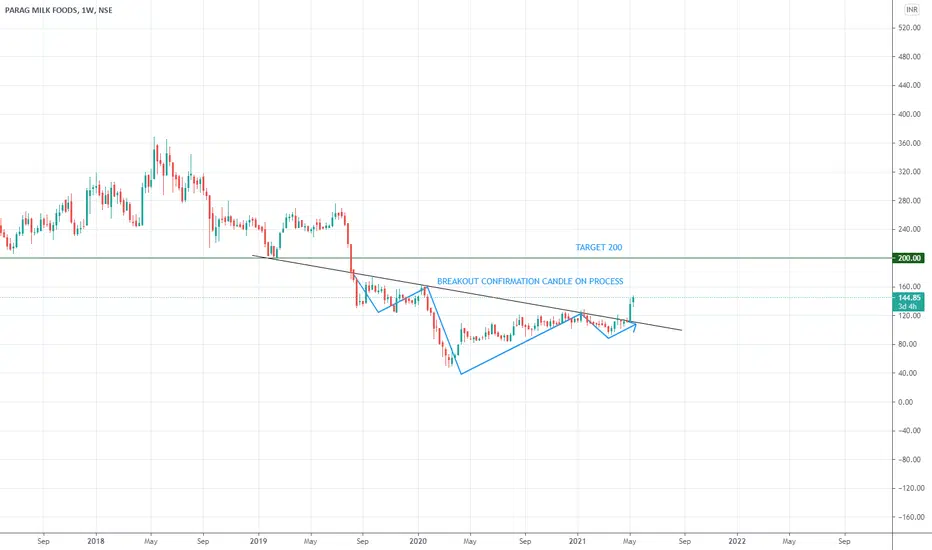
Breakouts from inverse head and shoulder pattern and retest.
Steel is the Global flavor and the price action here is very encouraging.
TLong
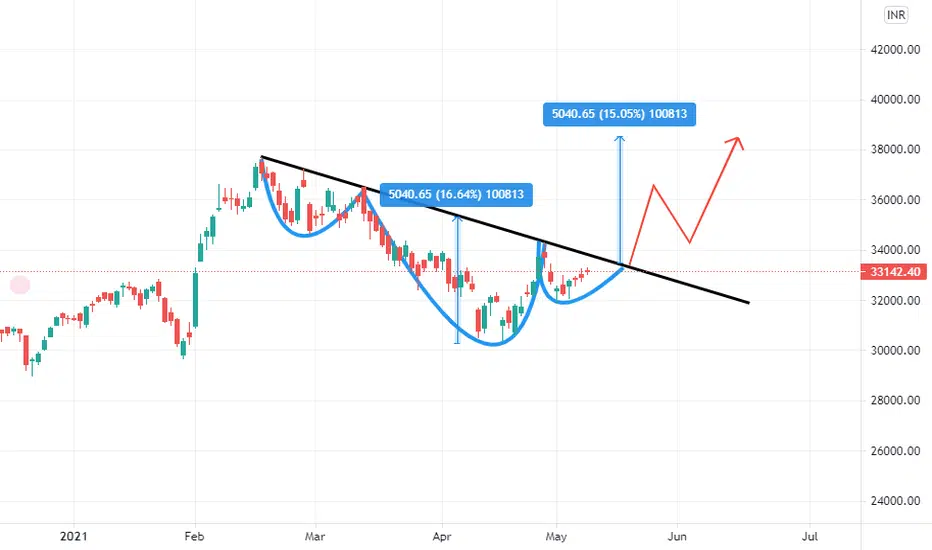
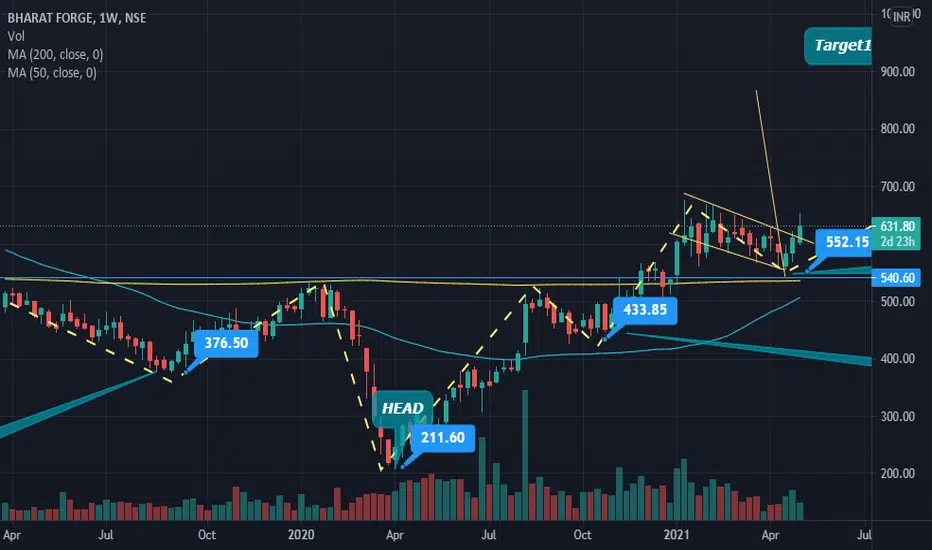
Inverted_HEAD AND SHOULDER PATTERN IN BHARATFORGEThere is the formation of an inverted head and shoulder pattern formation and channel Breakout in the chart of Bharat Forge also 50MA may cross 200MA soon and show GOLDEN_CROSSOVER but need to wait long and analyze the chart from time to time
Not any financial advice just learning more and letting others learn if any suggestion pls comment blow thanks
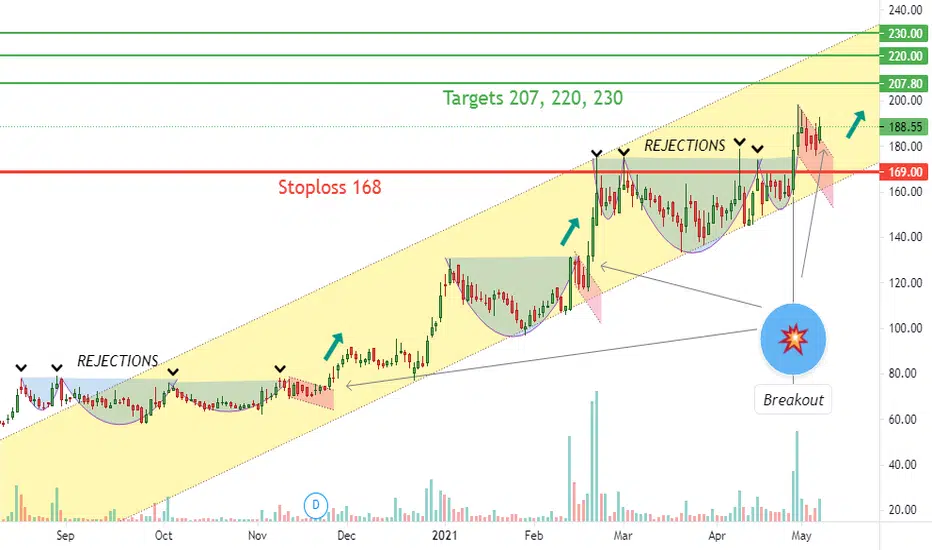
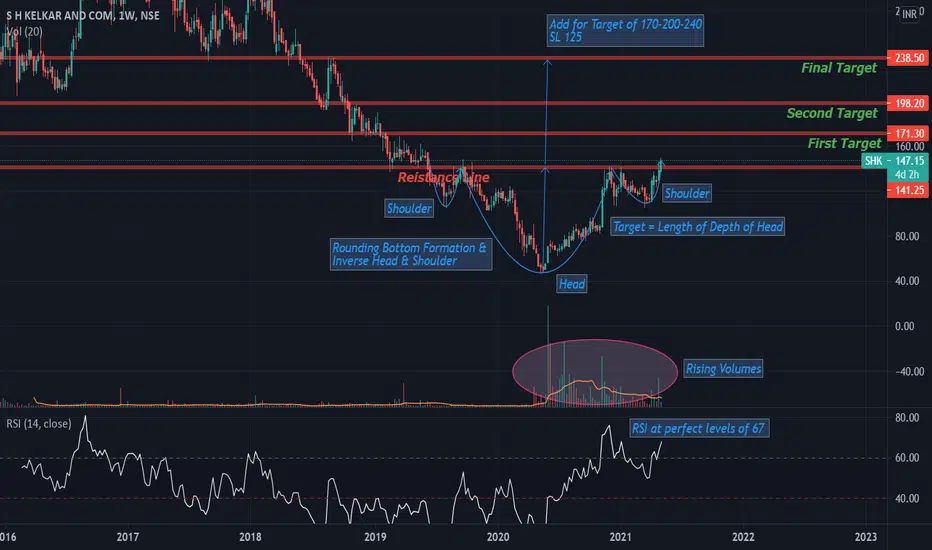
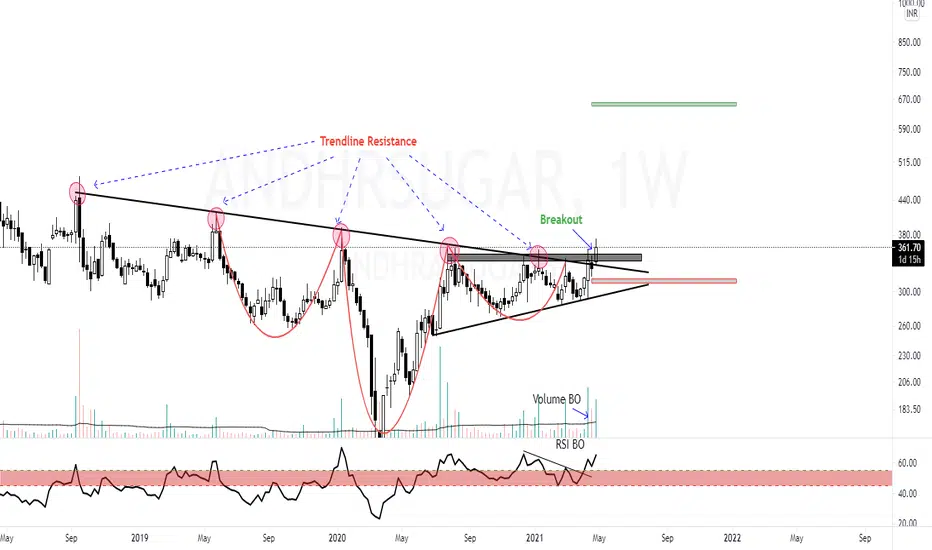
Resistance Breakout with Inverse Head & Shoulder FormationS H Kelkar & Company is involved in the business activities of Manufacture of essential oils; modification by chemical processes of oils and fats (e.g. by oxidation, polymerization etc.).
The Stock Broke a major resistance with a good volume with Inverse Head & Shoulder Formation and Rounding Bottom Formation on charts. RSI is perfectly placed at 67 levels that shows that the stock is not a overbought zone. There has been continuous rise in volumes indicating consistent accumulation of stocks.
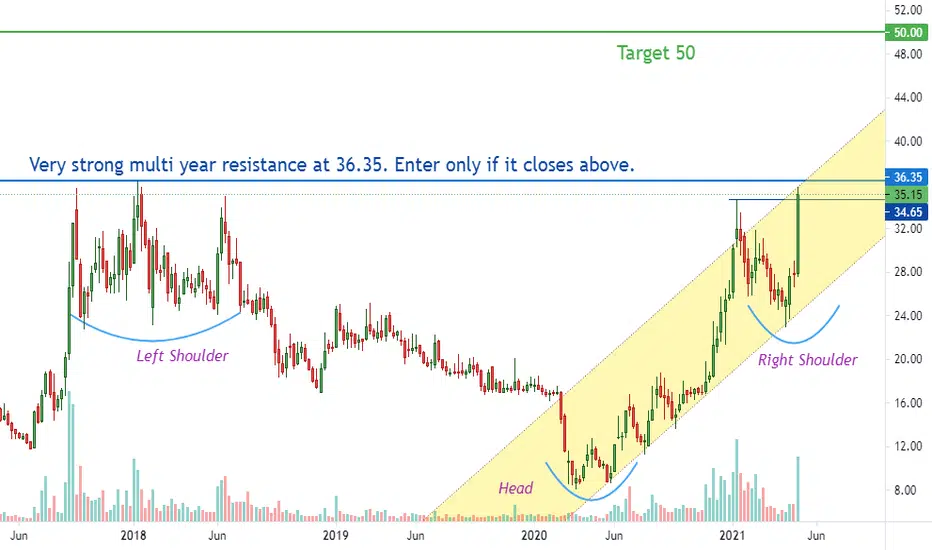
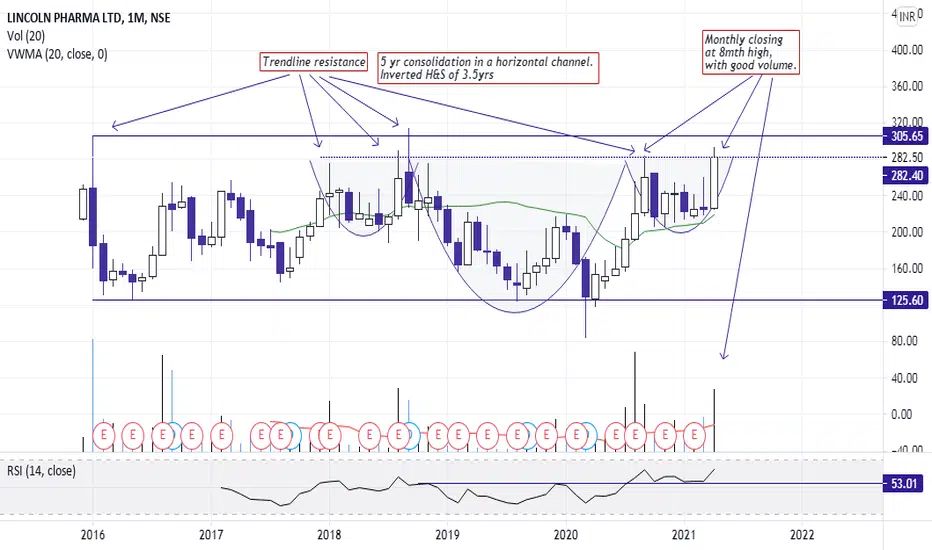
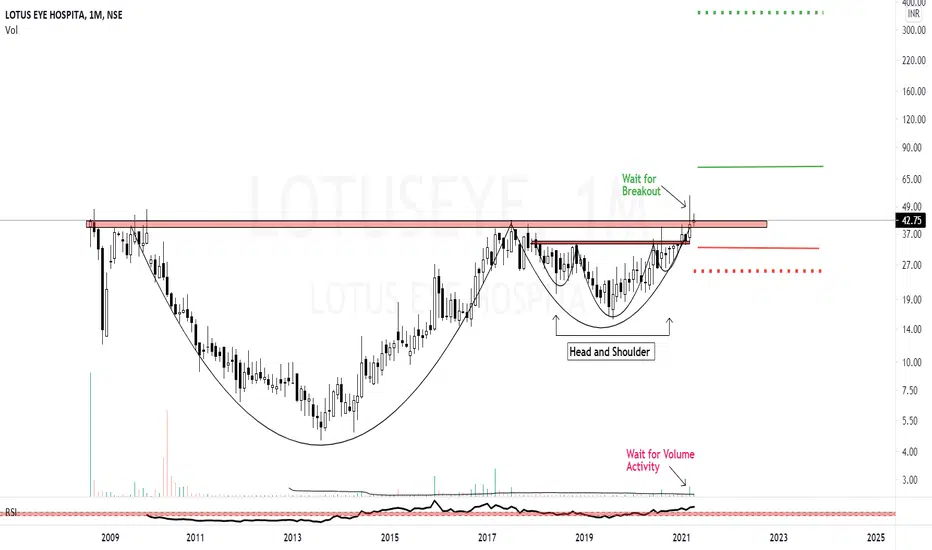
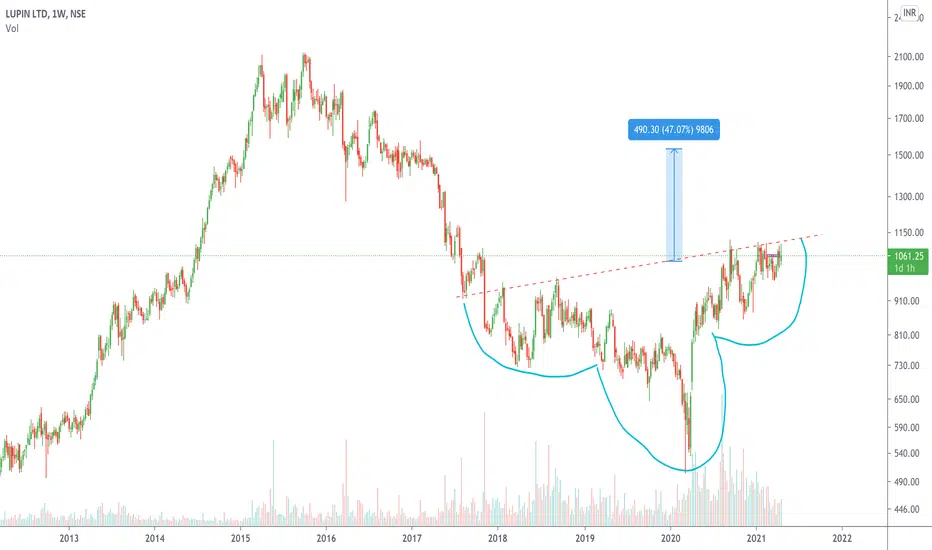
12 Year Breakout / Cup and Handel / 8X Return""Wait for a decisive breakout with substantial volume expansion""
Short Term SL 32
Short Term Target 75 (80%)
(it had already broken out)
Major Support at 34
Long Term SL 25
Long Term Target 360 (800%)
(wait for a breakout)
Plane your trade accordingly (manage position sizing)
All the best and take care.
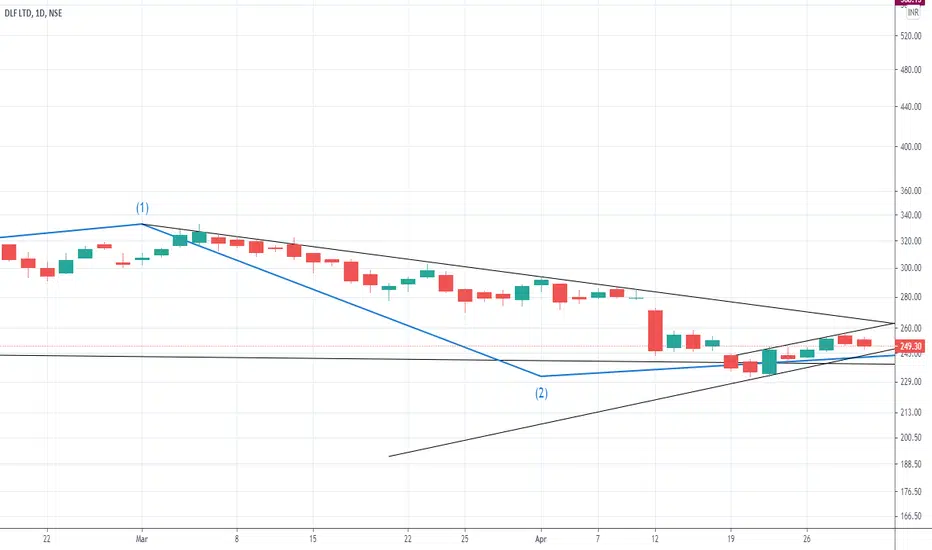
DLF ANALYSIS ON DOWN TRREND LINE BREAKOUT 30.04.21BUY :247 TO 230
TARGET 453 TO 568
High conformation Buy above 263 .
Reason For Buying This Script :
In this script long term down trend channel has broken , Now it is happening retest moment . So we can go for buy . If it close above 263 in weekly time frame then we can also go for buy.
Don't miss opportunity.
Note:
Above given levels are based on monthly & weekly time frame . So be patience it will take some days to achieve the target.
ALL THE BEST.