 Long
Inverse Head and Shoulders
Long
WIPRO price analysis on 15 mins chartWipro is sustaining above 200ema and it has formed not one but two trend reversal patterns called INVERSE HEAD N SHOULDER , the other one called CUP N HANDLE. Both of these pattern are trend reversal price action pattern. Targets mentioned on charts. Trade at your own risk. Trade safe.
 Long

Inverse Head and Shoulder Pattern in GMDCLTDToday we seen GMDCLTD trying to give breakout inverse head and shoulder pattern with higher buying volume. Expected it will successfully breakout this pattern and reach its projected target 65+ in upcoming trading session. We seen buying volume from 57 level so we can place our nearest stop loss at 57. By risk management this trade have a potential to give nearly 1:2 risk-rewards.
Investment Notes(Technicals):
1) Inverse Head and shoulder pattern will give 65+ target
2) After COVID-19 fall in
 Long

Tatamotors - inverse head and shoulders Tatamotors looking to continue uptrend after a correction in form inverse head and shoulders.
We are looking at the target of 325 / 345++.
Nifty should support this move by breaking major resistance of 15000 - 15065.
Rsi showings strength and healthy volumes while breakout
 Long

NIFTY - View NIFTY trying to break a major resistance level of 15000 - 15065 which happens to be a major call writing zone.
Inverse head and shoulders will be confirmed after 15000 - 15065 breaks.
14900 marks as a good support as per OI.
Target of 15450 can be possible.
 Long

Lauraslabs Bullishhhh BiasssInverse Head & Shoulder
Bullish Pattern
Looks good
Buy above 346
SL 300
Target another 70/80 points positional
 Long

nifty postional viewon hrly time frame nifty has form inverse head and shoulder pattern with 4 tops around 14800 so the breakout of 14800 will help nifty rally about 650-700 points form here
Long
BANKBARODA swing trade setupInverse head and shoulder pattern is being formed at an important support zone with raising stochasticrsi and macd crossover. Wait for a breakout above 76 to buy
 Long

 Long

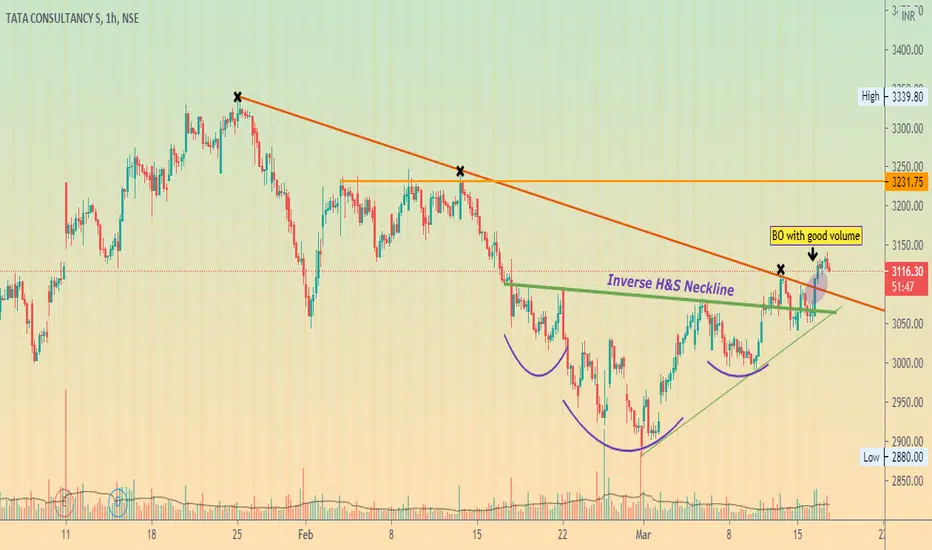
TCS | Inverse H&S + Trendline BOTargets 3231.
If you like my analysis, Please click the link for my other charts. Feedback is always welcome.
Thank you.
 Long
Nifty forming Bullish Price Action patterns inside ChannelAll details mentioned on chart
DISCLAIMER:
There is no guarantee of profits or no exceptions from losses.
The stock and its levels discussed are solely the personal views of my research.
You are advised to rely on your judgement while investing/Trading decisions.
Seek help of your financial advisor before investing/trading.
Investment Warnings:
We would like to draw your attention to the following important investment warnings.
Long
Bajaj Auto - Inverse Head and Shoulder PatternBajaj Auto :
Buy Level = Near about 3700 level
Safe Stop Loss = 3600
Aggressive Stop Loss = 3560
Target 1 - 3850
Target 2 - 3900
Please comment and let me know if you have any other ideas or observations or queries. Please feel free to reach out to me on Trading View.
 Long

nifty index is is near breakout pointon hourly chart of nifty index, we can see that the inde is trading in the last wave of inverse H&S pattern. It is very near to the neckline which is situated at 14900 around. If price cross it northwards & sustain there , then it can move upward till 15300 round with some resistance of prior highs. If rejected at neckline , then vertical fall can be expected.

Good Breakout of inverse head and shoulder pattern in BELEntry and Exit at Given Point are displayed.
 Long
 Long

Buy OFSSBuy OFSS cmp 3363 Stoploss 3100 target 3600 and above
Study: Inverse Head & Shoulder Pattern
 Long

Buy Gland PharmaBuy Gland Pharma near Retest are of 2490-2500 with stoploss of 2300
Study : Inverse head 7 Shoulder Pattern Breakout and now Stock is trading near retesting area
 Long

Godrej Industry!!! ready to show big move!!Let sustain 480 level. weekly rsi show strength ...(RSI range shift--- since 2017 rsi had never crossed 65 levels this is first time happing).
huge uy
 Long

Buy MRPL 44 for 55 and 80. sl 40 on weekly closing basisMRPL has given classical INVERSE HEAD AND SHOULDER BREAKOUT above trendline of 40 levels. Buy with stop loss of 40 on weekly closing basis for target of 55 and then 80 if 55 levels taken out decisively. Price is supportive with hefty volumes
 Long

Inverted Head and Shoulder Chart Inverse head and shoulders chart is in making.
Red lines are acting as target/resistance.
Recent price drop in the metal sector could be an opportunity to accumulate or make fresh entry.
 Long

Inverse Head and shoulder on Weekly chart - QUICKHEALQUICKHEAL
Reason for the trade: Inverse Head and shoulder
Downtrend from Jan 18 (Distribution phase)
Accumulation started from Jun 19
Waiting for Breakout on the neckline area soon and start Mark up phase :)
Also high volume for past 3 months!!
Note: Only for educational purpose!!
 Long

LUMAXTECH Pull back and Cont.Looks good for swing trade LUMAXTECH gave INV H&S BO on Weekly chart
Consolidation on Neckline can be seen.
Sustaining above 166.50 Levels can be good upside move
 Long

Inverted Head and Shoulder ChartLikely to reach 780 level and more.
Pros: Trading nears its all time high, has registered a good result in last quarter and more over Pvc pipe has observed hike in their price during last month.
FLong

short term bullish breakout in fslFSL, giving short term Inverse Head and shoulders breakout. Stock is about to break trendline and then Tgt will be 125/130. Invalid below 100
 Long
