HDFCAMC - Inverted head and shoulder - Breakouttechnical analysis of the HDFC AMC LTD chart you've shared.
Looking at the price action, potential Inverted head and should pattern forming, which is generally considered a bullish sign.
Here's a simplified breakdown:
Head: Notice the rounded bottom shape that formed roughly between Dec 2024 and early April 2025. This suggests a period of consolidation before a potential upward move.
Handle: After reaching a high around ₹4,607, the price has pulled back and is now consolidating in a smaller
Inverse Head and Shoulders
#HDFCAMC - IHNS BreakOut in DTF 📊 Script: HDFCAMC
Key highlights: 💡⚡
📈 Inverse Head & Shoulders Set up in Daily Time Frame.
📈 Price consolidated near Resistance.
📈 BO with Volume
📈 MACD Crossover
📈 RS Line making 52WH
📈 One can go for Swing Trade.
BUY ONLY ABOVE 4700 DCB
⏱️ C.M.P 📑💰- 4703
🟢 Target 🎯🏆 – 8.6.0%
⚠️ Stoploss ☠️🚫 – 4.20%
️⚠️ Important: Market conditions are Okish, Position size 25% per Trade. Protect Capital Always
⚠️ Important: Always Exit the trade before any Event.
⚠️ Important:
Camlinfine offers good Risk To Reward. Add to WL⚠️ HIGH-RISK, HIGH-REWARD OPPORTUNITY
Stock: CAMLINFINE
Time Frame: 🕒 Daily
🎯 Entry Strategy
📌 Entry Trigger: ₹133.6 (Wait for a weekly close above this level)
📈 Targets
T1: ₹144.4
T2: ₹168.8
T3: ₹186.2
ATH Potential: ₹231.39
🔻 Stop-Loss (SL): ₹111.7 (16% risk)
🔍 Technical Highlights
📐 Trendline Breakout followed by a healthy consolidation.
Formation of a ☕ Cup & Handle pattern—indicative of bullish momentum.
🔄 Inverse Head & Shoulders, signaling a potential trend reversal.
⚠️ Risks to Con
SBI form Inverse H&S.SBI form Inverse H&S pattern. Today gives break out of neckline 780. SBI is at demand zone add more if come down to 780. Close below 760 would be the violation of this pattern.
As per chart it may test 785-807 soon.
As per OI data on dated 17.04.2025 there is considerable OI shading on CE side and OI build up on PE side. Stock is in good momentum as upper Bolinger Band tested and expanded. As per indicator all are bullish only Moving average need to improve. There are good chance for retest th
IOCHello & welcome to this analysis
A deep 6 months correction lead to the formation of a Bullish Harmonic Crab pattern in March 2025 post which during accumulation (consolidation) phase formed an Inverse Head & Shoulder.
A 38% retracement of the bullish harmonic pattern has been done and now its completing a pullback of the IHS breakout by retesting the neckline.
Potential upside levels are 145 and 160 for both the IHS & Bullish Harmonic Crab
All the best
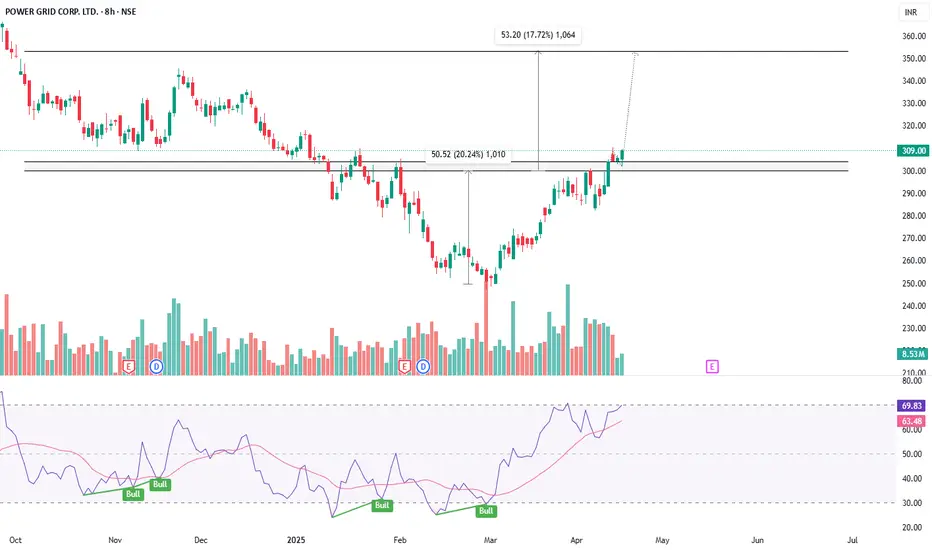
POWER GRID - INVERSE HEAD & SHOULDERS BREAKOUTSymbol - POWERGRID
Power Grid Corporation of India Ltd. is a Maha-ratna Public Sector Enterprise and a key player in the Indian power transmission sector. It operates as a central transmission utility and is involved in the planning, implementation, and maintenance of transmission systems across the country.
Recently, the stock has exhibited a notable bullish breakout after forming an Inverse Head and Shoulders pattern. A classic reversal formation signaling a shift from a downtrend to an uptr
(NSE:SUNPHARMA) Inverted H&S Breakout Eyes New ATH Chart Analysis:
Sun Pharma has formed a textbook Inverted Head & Shoulders (H&S) pattern on the daily timeframe, signaling a strong bullish reversal. The pattern completed with a clean breakout above the neckline at ₹1,820 , accompanied by a surge in trading volume (highest in 2 weeks). This validates buyer conviction and sets the stage for a sustained upward move.
Key Levels:
Neckline: ₹1,820
Resistance Targets:
Target 1: ₹1,910
Target 2: ₹1,960 (All-Time High, ATH)
Support Zone:1,750
T
SBIN Upside potential with a Bullish Bias The Bank Index has been performing since few days
Also structure level SBIN is poised for an upmove, it has a pattern Inverse Head & Shoulders which is a bullish pattern and with a significant upside technically
Suggested to Buy at CMP or wait to retrace at 780s zone
SL 750s zone
Target 870s zone
Union Bank of India - Inverse Head & Shoulders Breakout!Union Bank of India (NSE: UNIONBANK)—Inverse Head & Shoulders Breakout! 🚀
📈 Chart Overview:
The stock has formed a multiple inverse head & shoulders pattern, indicating a strong bullish reversal.
A downtrend resistance has been breached, confirming bullish momentum.
🔍 Key Levels:
Resistance Levels: ₹140, ₹150
Support Levels: ₹125, ₹120
📊 Observations:
Volume spike supports the breakout, signaling strong buying interest.
RSI at 66.34, approaching overbought levels but still has room for fur
Sun Pharma's Inverse Head and Shoulders: Bullish Setup Ahead!Hello Traders! Today, we’re taking a look at Sun Pharmaceutical and a potential Inverse Head and Shoulders pattern that's setting up on the chart. This pattern is a classic bullish reversal setup that indicates the stock could be gearing up for an upward move, especially if the neckline breakout gets confirmed. The price has already formed the left shoulder , the head , and now we’re watching the right shoulder develop.
Once the neckline breakout happens, we’ll have a solid confirma
Shocked by Nifty50's sharp correction? Don't worry!Today NIFTY has crashed by 350+ points and reached 23165, a correction from 23800 levels .
Let me explain, This Nifty Daily chart is a classic example of how many fundamentals of Technical Analysis are satisfied.
1) Old resistances in 2024 at 22800 will now become Support levels
2) If it goes to 23000 and stops at 22800 levels it also fulfils the Wave 4 criteria, which says that Wave 4 never gets in Wave 1 territory
3) If this happens, the chart also completes an Inverse Head and Shoulder's Ri
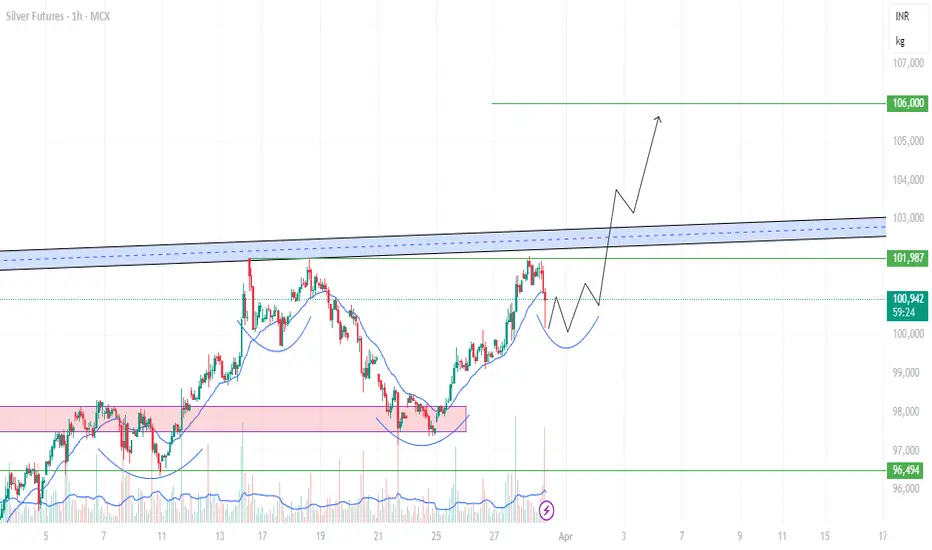
Inverse Head and Shoulder pattern In Silver ? New high Soon?chart shows an Inverse Head and Shoulders pattern in Silver Futures on the 1-hour timeframe.
The neckline (resistance) is marked by the blue zone, which, if broken with strong volume, could confirm a bullish breakout. The projected price movement (black arrow) suggests a potential rally toward ₹106,000.
A confirmation would come if the price breaks above the ₹101,987 - ₹103,000 resistance zone with volume.
Place SL below the right shoulder (~₹100,000) for a safe trade.
Zomato is showing weakness it may test 170 soon.Zomato is weak on monthly and weakly chart. It forms Fake breakout with double top pattern on monthly chart.
As per chart showing weakness on daily chart also as RSI drag below 40. It can short on any rise or here for target 170 soon.
ZShort
SPLPETRO : #SPLPETRO #swingtrade #patterntrading
SPLPETRO : Swing Trading
>> Inverse H&S pattern visible
>> Good Strength in Stock
>> Volume Building up
>> Risk Reward Favourable
Swing Traders can lock profit at 10% and keep Trailing
Please Boost, comment and follow us for more Learnings.
Note : Markets are still Tricky and can go either ways so don't be over aggressive while choosing & planning your Trades, Calculate your Position sizing as per the Risk Reward you see and most importantly don't go a
Inverse Head and Shoulders pattern on the Silver Futures (MCX)The 4-hour Silver Futures (MCX) chart is showing a clear Inverse Head and Shoulders pattern, a bullish reversal signal. The pattern comprises a left shoulder, head, and right shoulder, with the neckline around the ₹97,800 - ₹98,300 region.
The price is currently testing this neckline, and a successful breakout above this level, confirmed by increased volume, could trigger a significant upward move.
Bitcoin showing weakness. It may test 76076Bitcoin chart is weak now. weakly RSI below 60 MACD also negative. Double top pattern form and correction showing. As per chart it may test 76076 soon. It can short on any bounce up to 92000.
These is Neckline place near 76076 of Inverse H&S pattern. It would be retest of neckline.
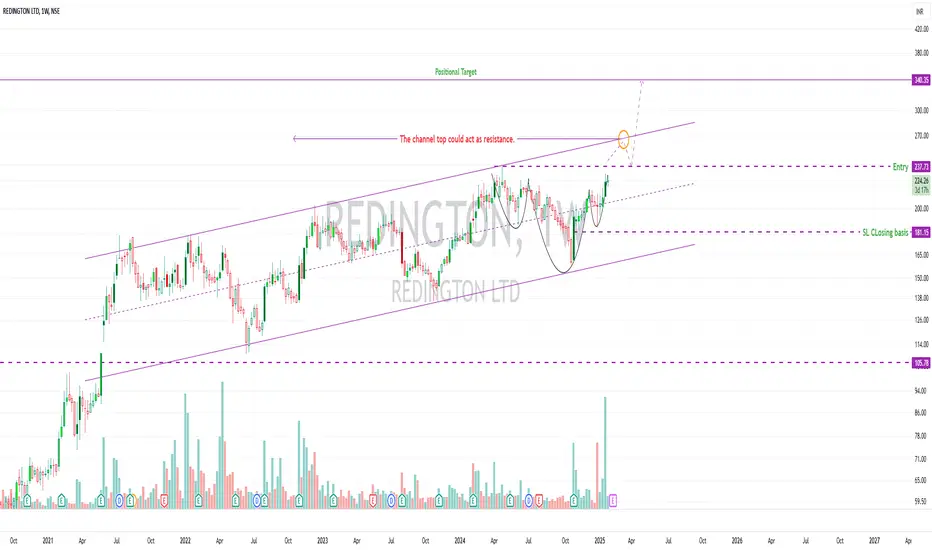
Redington Ltd – CNH & Inverse H&S Trade with Caution!🚀 Pattern Highlights
Cup and Handle & Inverse Head and Shoulders:
Redington is showing a potential Cup and Handle (CNH) formation alongside an Inverse Head and Shoulders, signaling a breakout at ₹238–₹240.
📊 Technical Levels
Entry: ₹238–₹240 (Breakout Level)
Stop Loss: ₹181 (24% below, on a daily closing basis)
Target: ₹340 (~42% upside, positional/medium-term)
Risk-Reward Ratio: ~1:1.75
🕵️♂️ Observations
1️⃣ The stock is trading within an ascending channel, forming higher lows.
#REDINGTON - Potential Break Out / Feb'25📊 Script: REDINGTON
Key highlights: 💡⚡
📈 IH&N Formation in Weekly chart.
📈 IH&N Formation in Daily chart also
📈 Went into a Side Ways consolidation for over a Nine months.
📈 Volume spike seen in past
📈 MACD Cross Over.
📈 One can go for Swing Trade.
🟢 If you have any questions regarding the setup, please feel free to leave your inquiries in the comments, and I will respond promptly.
BUY ONLY ABOVE 233 DCB
⏱️ C.M.P 📑💰- 226
🟢 Target 🎯🏆 – NA%
⚠️ Stoploss ☠️🚫 – NA%
⚠️ Important: Always Exit the
#SHIVALIK - Potential Break Out / Feb'25📊 Script: SHIVALIK
Key highlights: 💡⚡
📈 IH&N Formation in Weekly chart.
📈 IH&N Formation in Daily chart also
📈 Price gave a good up move.
📈 Went into a Side Ways consolidation for over a Two months.
📈 Volume spike seen in past
📈 MACD Cross Over.
📈 One can go for Swing Trade.
🟢 If you have any questions regarding the setup, please feel free to leave your inquiries in the comments, and I will respond promptly.
BUY ONLY ABOVE 850 DCB
⏱️ C.M.P 📑💰- 783
🟢 Target 🎯🏆 – NA%
⚠️ Stoploss ☠️🚫 – NA%
⚠️
Chola Fin co., Looking good ; min 20% Roi ; swingFor short term investment ;
Leave a " Like If you agree ". 👍
.
Wait for small retracement & daily candle to close above - "1260".
Trade carefully untill ENTRY level.
.
Entry: 1260
Target: 1430-1560
sl: 1199
major stoploss/ support: 1190
.
.
Enter only if market Breaks
"Yellow box" mentioned.
.
.
Don't make complicated trade set-up.📈📉
Keep it " simple, focus on consistency "💹
Refer our old ideas for accuracy rate🧑💻
Follow for daily updates👍
.
Refer old posted idea attached below.
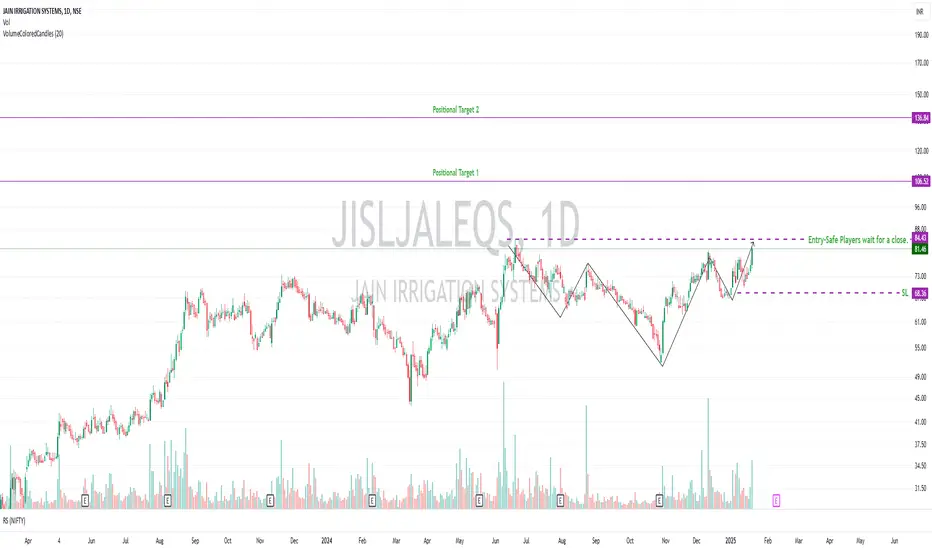
Head & Shoulders Alert: Jain Irrigation Systems (JISLJALEQS)
Entry: Above ₹84.36 🚦(Safe Traders Wait for a close above )
Stop Loss: ₹68.41 (SL: -19%) 🛑
Targets:Target 1: ₹106.52 🎯 (+26.2%)
Target 2: ₹136.84 🚀 (+62.2%)
Risk-Reward Ratio:T1: 1:1.38
T2: 1:3.27
Profit booking is subjective. Book profits as per your appetite.
📈 Technical Highlights:
Pattern: Forming a Head & Shoulders (Positional pick).
Volume: Picking up significantly 📊.
Candle: Closed below major resistance with a wide-range candle.
DMA Levels: Trading above 30DMA & 50DMA, sh