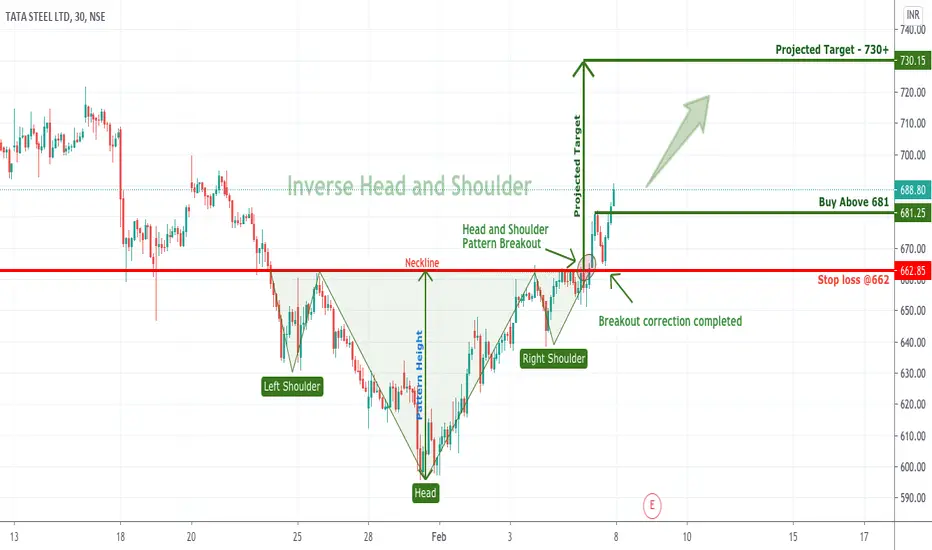
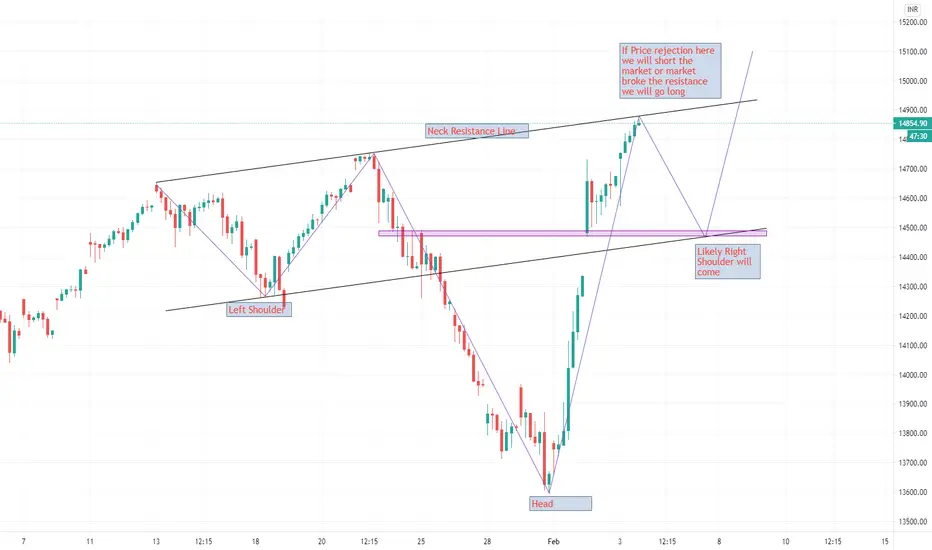
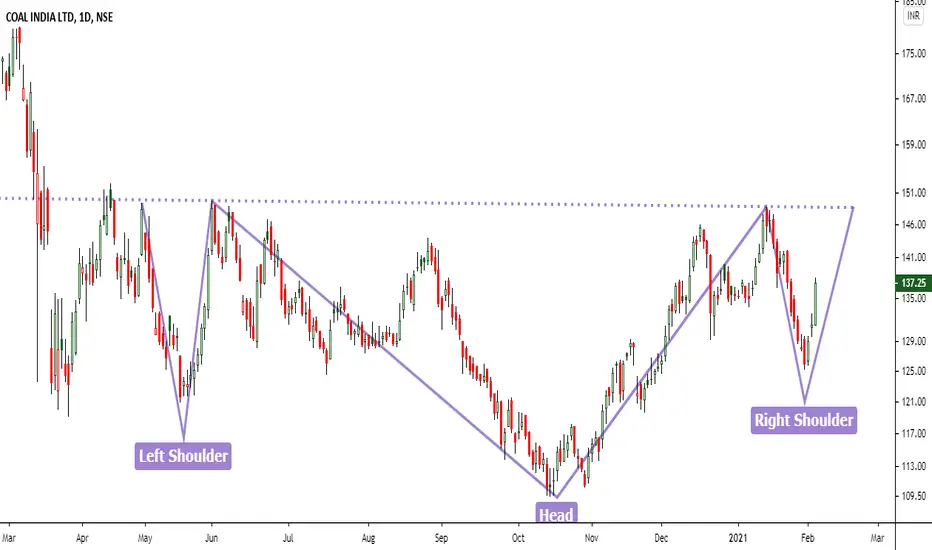
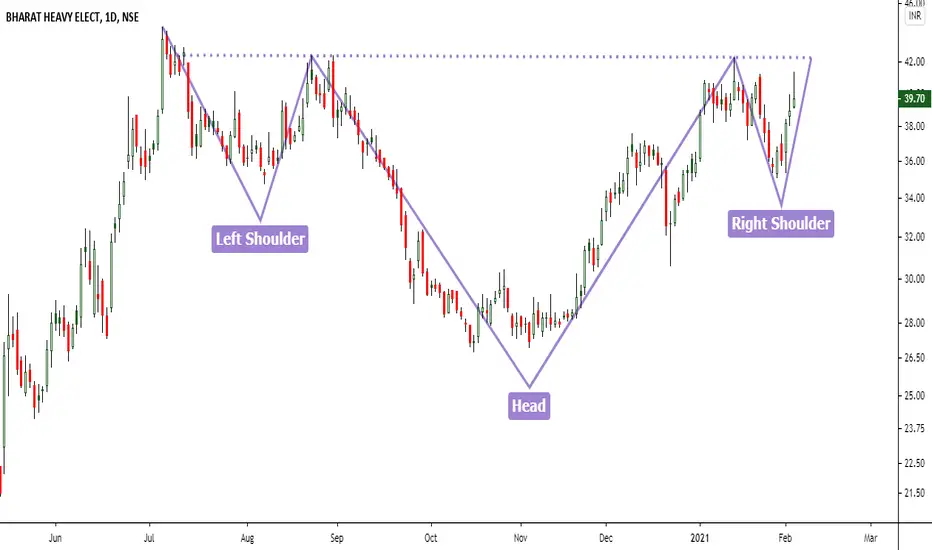
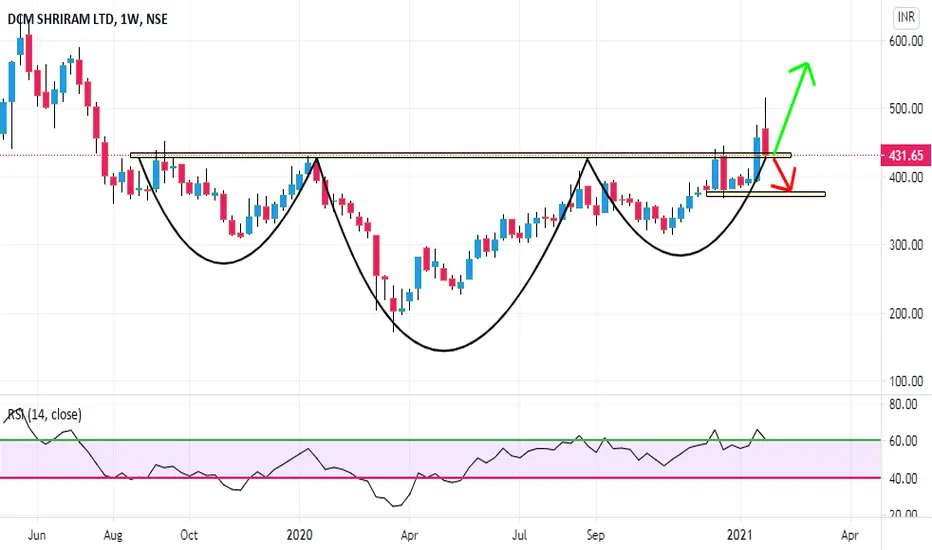
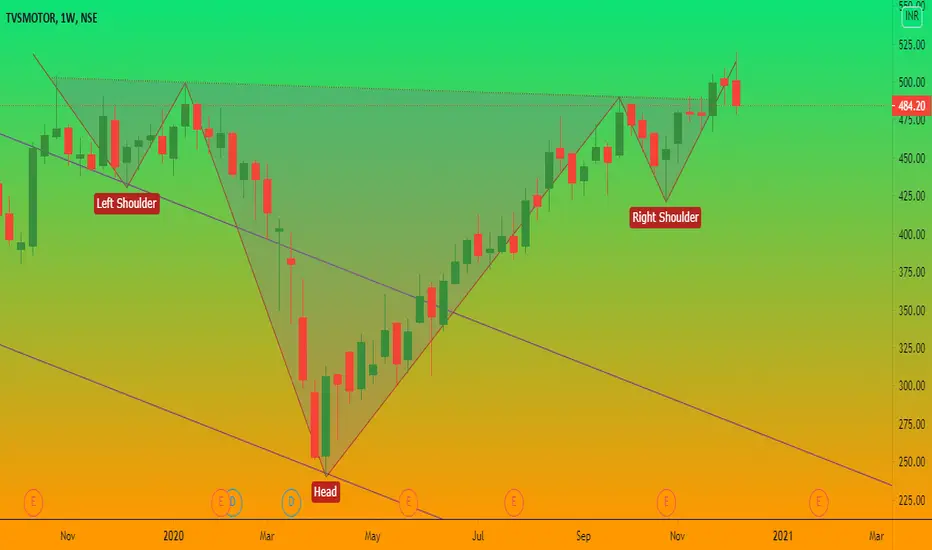
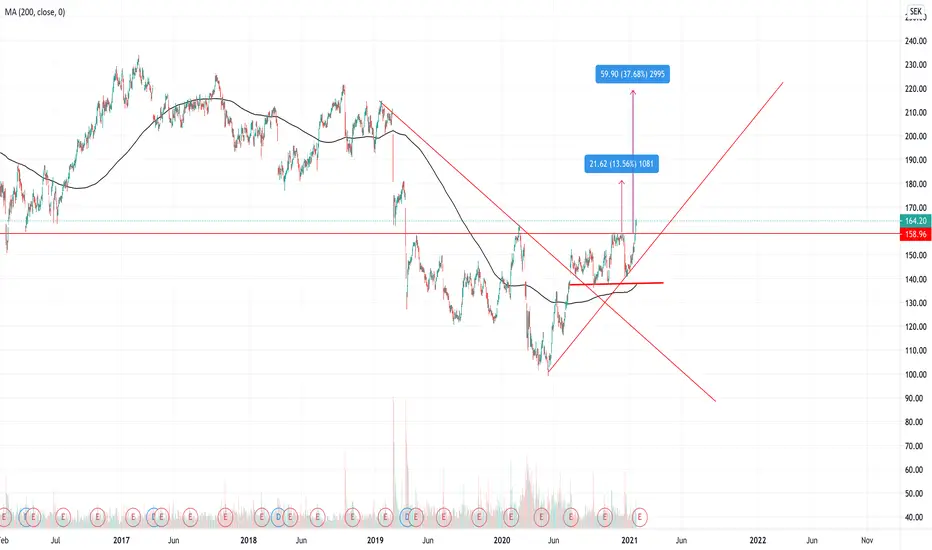
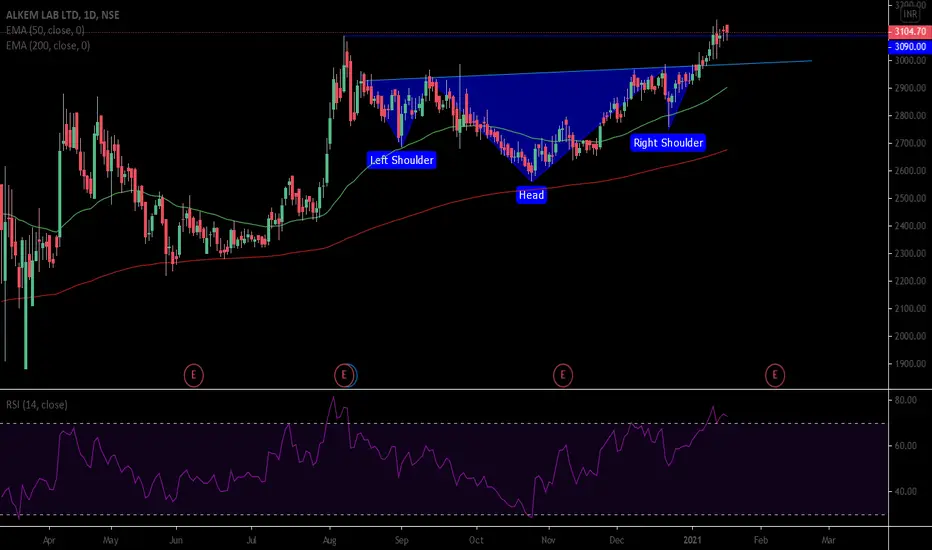
Inverse Head and Shoulders Pattern Breakout in TATASTEELIn today's trading session TATASTEEL did breakout of an inverse head and shoulder pattern. After this breakout it corrected till breakout level and again bounce back and continue its rally towards the projected target. Expected we will get 730+ target in TATASTEEL in the upcoming trading session.
Inverse Head and Shoulders
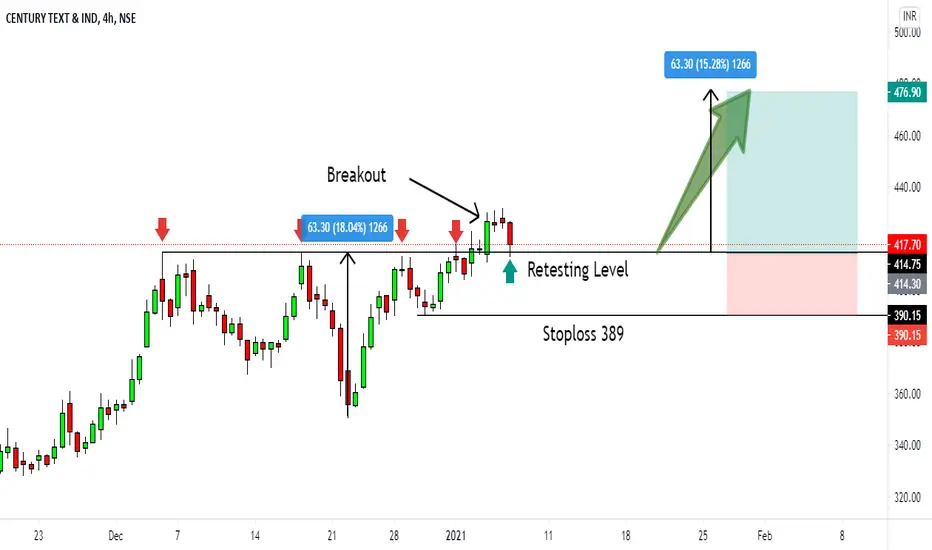
Buy Century TextBuy Century Text at CMP with stoploss of 389 for the Target of 475
Study: stock is trading near retesting area of Inverse Head & shoulder pattern.Good Risk to Reward Trade
CLong
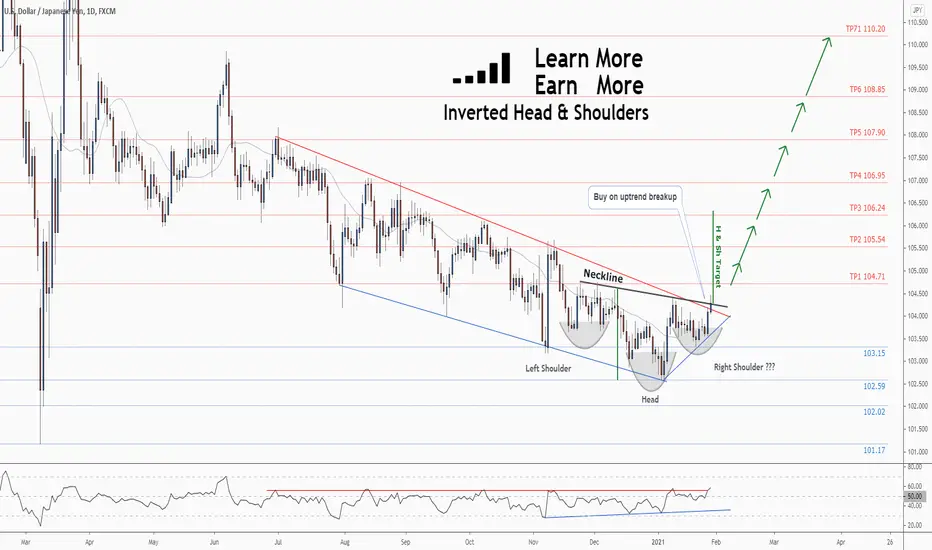
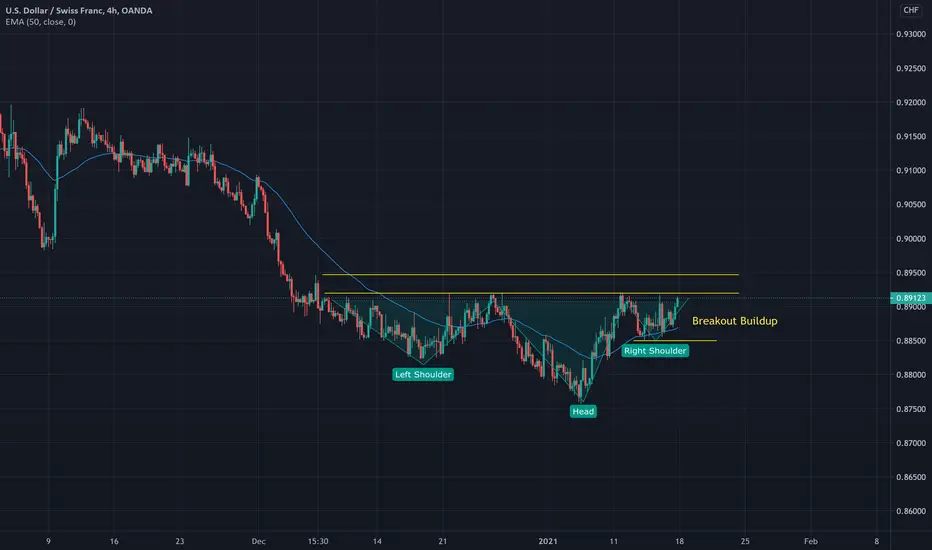
📚Learn More💰Earn More - Inverted Head and Shoulders in USDJPY📚 LEARN MORE
💰 EARN MORE
With ForecastCity
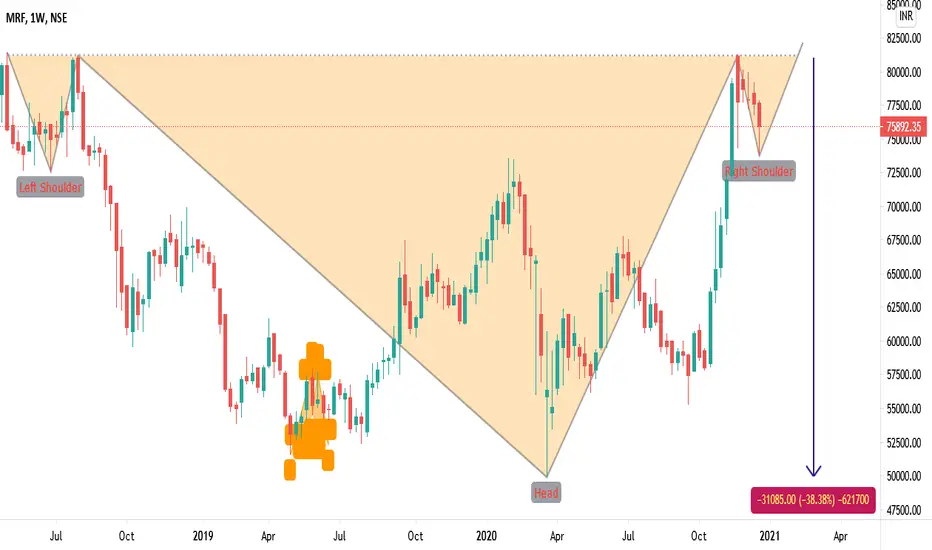
Inverted Head and Shoulders Definition:
A head and shoulders pattern is also a trend reversal formation.
It is formed by a Valley (left shoulder), followed by a Lower Valley (head), and then another Higher Valley (right shoulder).
A “ Neckline ” is drawn by connecting the highest points of the two Peaks. Neckline resistance does not need to be strictly horizontal.
This illustrates that the downward trend is coming to an end .
When a Head
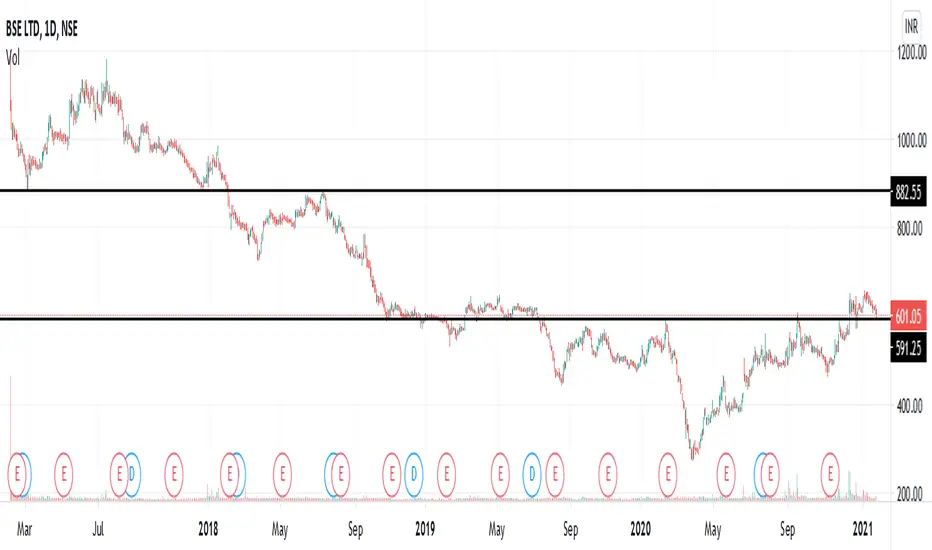
Inverse Head and ShoulderBSE Ltd. had an inverse head and shoulder breakout and then is re-testing the breakout levels. As long as it holds Rs.590 (also our Stop Loss) it should be poised for gains. Keep first target at Rs.880 for this one. The chart looks really good and I do not see a reason for it to correct even on fundamental basis.
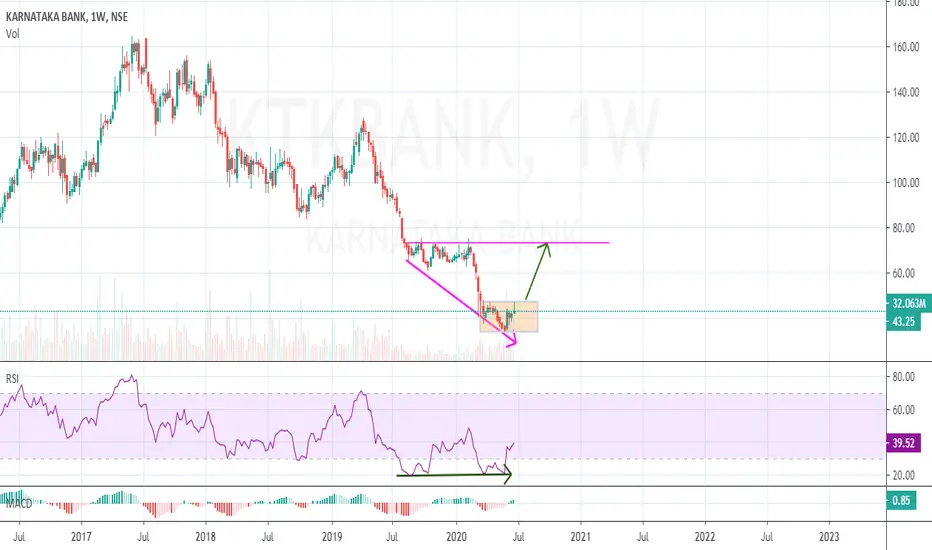
KTKBANK - Despite big fall showing recovery with momentumPositional analyze for Short term holding (may take some quarters)
Weekly time frame for the last 8 months price was making Lower low, after big fall now RSI Bullish divergence occurring. High probability the price will goto its previous level of Rs.70/-
CMP : 43.25
Any dip / fall is an opportunity for accumulation until 34/-
SL : 30
Target : 70, 88
If you switch to DAILY time frame you will see Inverted Head & Shoulder pattern in forming which is another confirmation and high probability
Hindustan Zinc Analysis (NSE: HINDZINC)Let's talk about the short - term view. A trend line is observed on the monthly chart, and when we observe the same on a daily chart, we can see a pattern that closely resembles "Inverted Head and Shoulder," which signifies a bull run in coming days. All we have to do is to wait for the candles to break the neckline, and we're good to go.
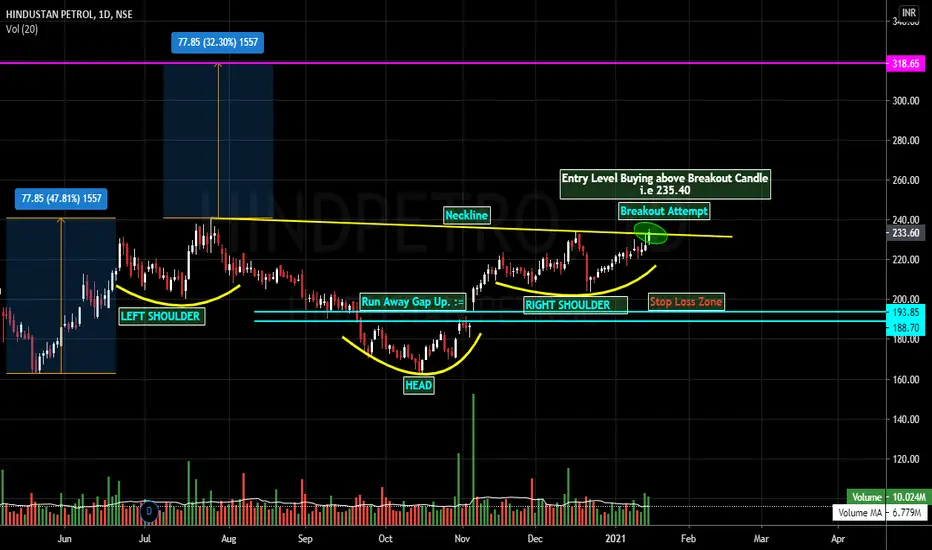
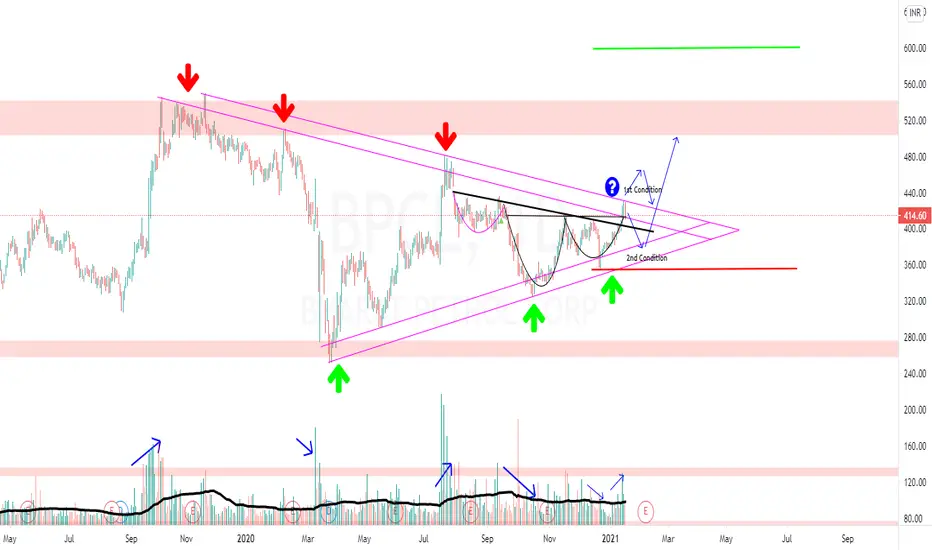
HindPetro: Target 318.65 for Time Frame : 1 Year+See details why?
Fundamental Analysis :
Stock P/E : 4.79,
EPS: 40.90,
Industry P/E : 8.53,
Face Value : Rs 10 per Share,
Dividend Yield: 4.29%,
Dividend Payout : 42.81% Maintaining,
Promoters Holding : 51.10% with Nil Pledge,
Market Cap : 34614 Cr,
Debt to Equity : 0.88,
PEG : 0.26,
Book Value : 229
Credit Ratings:
Ratings Reaffirmed at AAA (Stable)/ A1+
HPCL's Strong parentage, It's undertaking modernization and capacity expansion at its refineries to improve the profitability of the
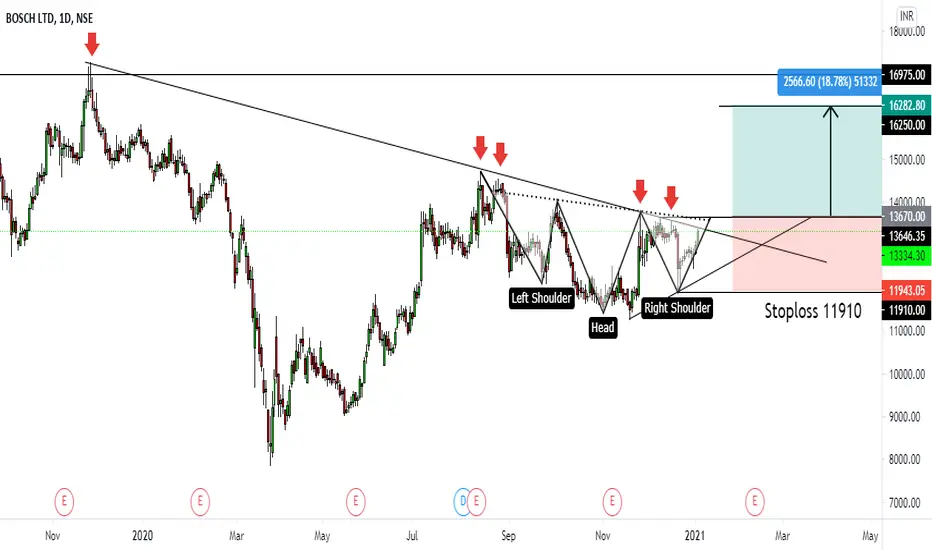
Buy BoschBuy Bosch if it close above 13650 (Safest Entry) stoploss 11910 Target 16000 to 16250
aggressive entry above Downward Trendline Breakout with few quantities.
study : Stock is forming Inverse Head & Shoulder Pattern near Downward trendline...if it breaks we can see 15-20% upside movement in this stock.
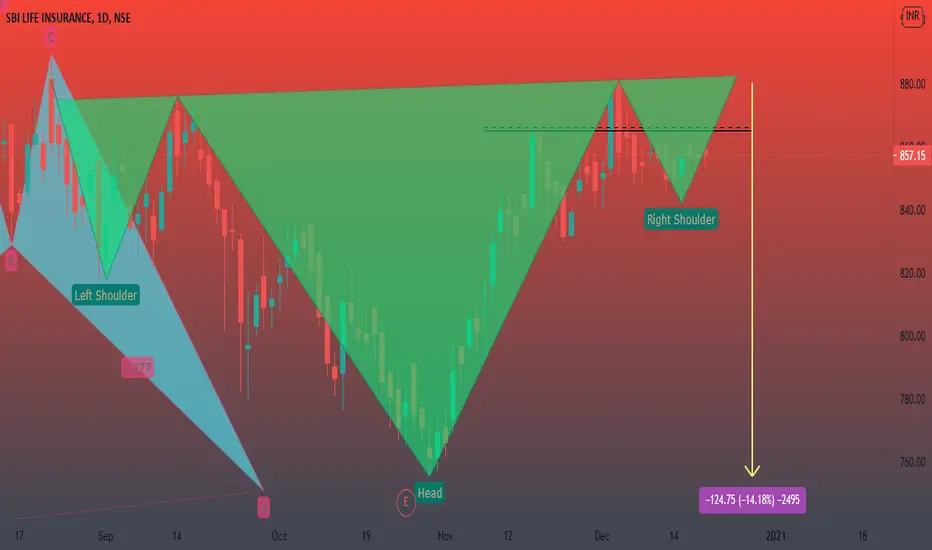
SBILIFE - 1D TF - Inverse Head & ShouldersInverse Head & Shoulders pattern forming on Daily Chart of SBILIFE . BUY 881, SL 839.9-817.9, Target(s) - 915, 945, 960, 985. Pattern Measurement = 124.75. I'm learning chart patterns as of now. You can plan your trades accordingly if you know how to trade these patterns.
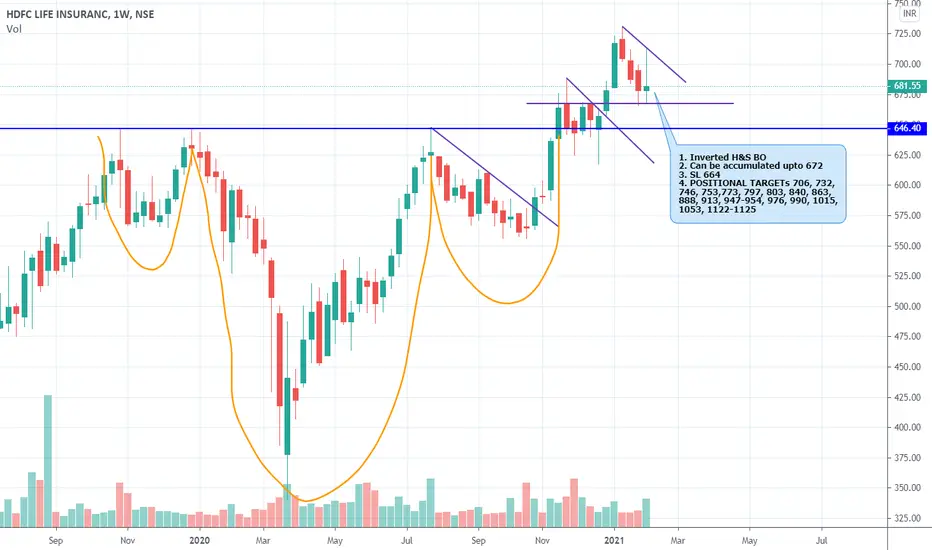
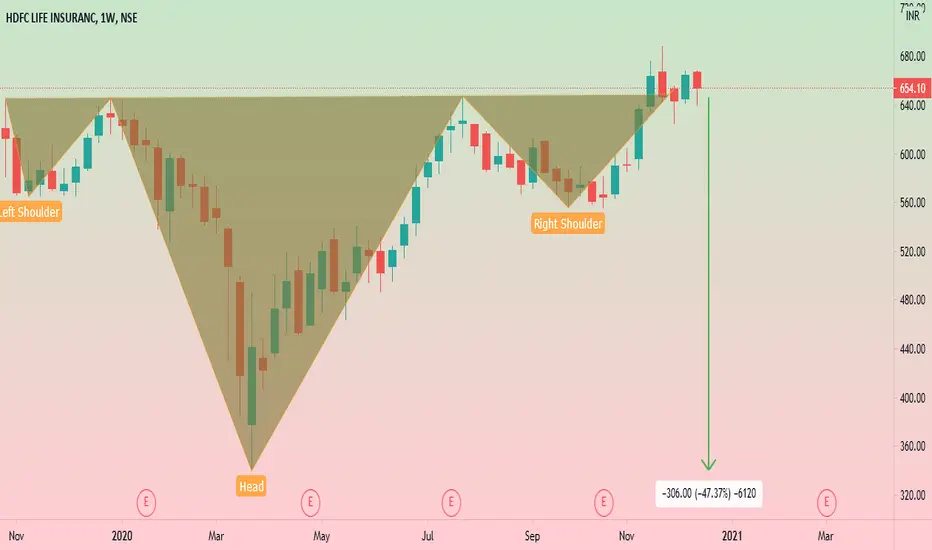
HDFCLIFE - 1W TF - Inverse Head & ShouldersInverse Head & Shoulders pattern forming on Weekly Chart of HDFCLIFE. BUY 650, SL 564.9-554.9, Target(s) - 705, 730, 760, 790, 830. Pattern Measurement = 306. I'm learning chart patterns as of now. You can plan your trades accordingly if you know how to trade these patterns.