Aegis Trying to breakout of a long consolidation. Observations:
1⃣Trying to break out of consolidation/DarvasBox.
2⃣Closed Right below previous ATH/Resistance.
3⃣Huge Volume
5⃣Inverse Head &Shoulders on DTF.
6⃣Dry Volume During Consolidation/Pullback.
1⃣Action Plan:
➡️Entry Strategy: Enter on a retest of ₹969.5 in case of a gap-up opening or Enter Above 1017.25 with 50% qty and wait for a retest.
2⃣Risk Management: Place a stop loss at ₹843(Day Closing Basis).
➡️Use trailing stops to lock in profits as targets are reached.
➡️Volume Co
Inverse Head and Shoulders
Infosys Ltd. Watch for Darvas Box Breakout.
📉 Current Price Action:
Infosys is consolidating within a Darvas Box pattern, trading close to a 3-year-old resistance zone near ₹1,953.7. The stock is forming a base after a pullback, suggesting potential for a breakout.
📈 Trade Setup:
Entry: ₹2,002.1 (above the resistance zone)
Stop-Loss (SL): ₹1,707.6 (on a closing basis)
Target: ₹2,335.8 (medium-term potential)
🚩 Key Observations:
The stock is holding above its Key DMAs, indicating near-term strength.
Consolidation near a key resistance
ABDL: Bullish Setup Post-BreakoutABDL: Bullish Setup Post-Breakout 🔥📈
✅ Breakout Alert: Price broke out of a long consolidation range, signalling strong momentum.
✅ Retest Success: Retested the breakout zone (~₹373), confirming it as support.
✅ Bullish Pattern: Inverse Head & Shoulders confirmed, adding to the bullish outlook.
✅ Volume Pickup: Rising volume aligns with price action, indicating strong buying interest.
✅ Above Moving Averages: Price holds above key 50 & 200 DMAs, reinforcing the uptrend.
🎯 Key Levels:
Entry Zon
UCAL Breakout with Huge Volume. Add to your WLKey Highlights
1⃣ Breakout of Consolidation: The stock has decisively broken out of a long-term consolidation range.
2⃣ Strong Volume Support: Backed by significant volume, indicating probable institutional participation.
3⃣ Above Key DMAs: Trading above critical daily moving averages (DMAs), reinforcing bullish momentum.
Pattern Insights
📦 Consolidation Breakout: A breakout from a long-term consolidation box (marked in green).
📈 Ascending Channel: An ascending channel pattern within the
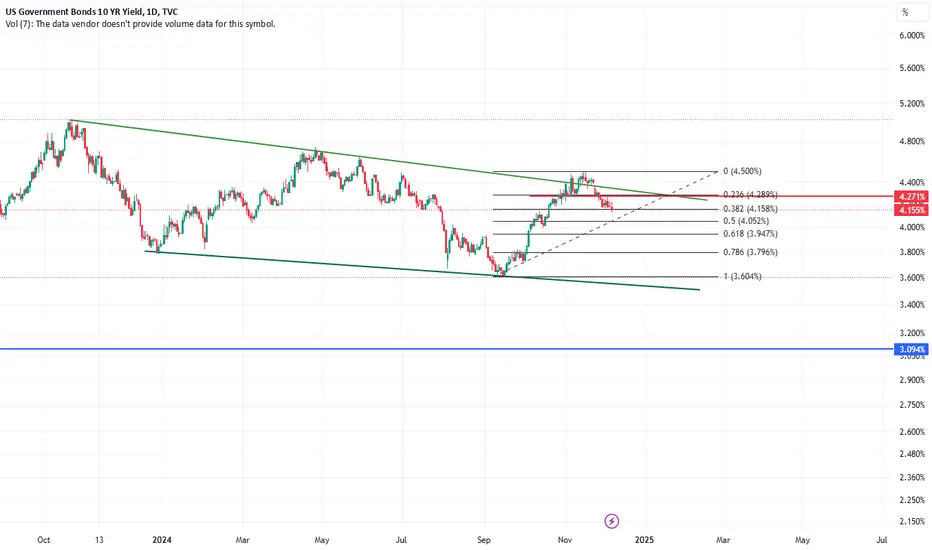
US10Yrs. Bond Yield parallel channel. Nifty up move confirmationUS Government 10Yrs. Bond Yield trading in parallel channel. After fake break out it come down in channel again. As per chart it may correct up to 4%,3.79% and 3.06% level soon.
It has inverse relation with index, so nifty and bank nifty may give good up move in next 2-3 months as both charts suggested also the same.
BAJEL -inverse head and shoulders- Good Volume -BreakoutThe chart **Bajel Projects Ltd.** (BAJEL) on the **NSE**.
Key observations:
1. **Pattern:**
- A clear **inverse head and shoulders** pattern. This is typically considered a bullish reversal pattern.
2. **Breakout:**
- The price has broken above the neckline resistance 267 (yellow trendline), with significant bullish momentum.
3. **Measured Move Target:**
- The projected target, calculated from the breakout point to the height of the pattern, is shown as **42.10 points** or approxi
OFSS watch for a breakout of Base.Good pattern.
-Trying to break out of the box.
-Inverse H&S on DTF
-Narrow range inside candles on DTF.
-Dry volume
Breakout traders wait for a breakout of the base. Positional traders can look for building positions given in the chart.
The view and chart are shared just for educational purposes. Please do your research before investing.
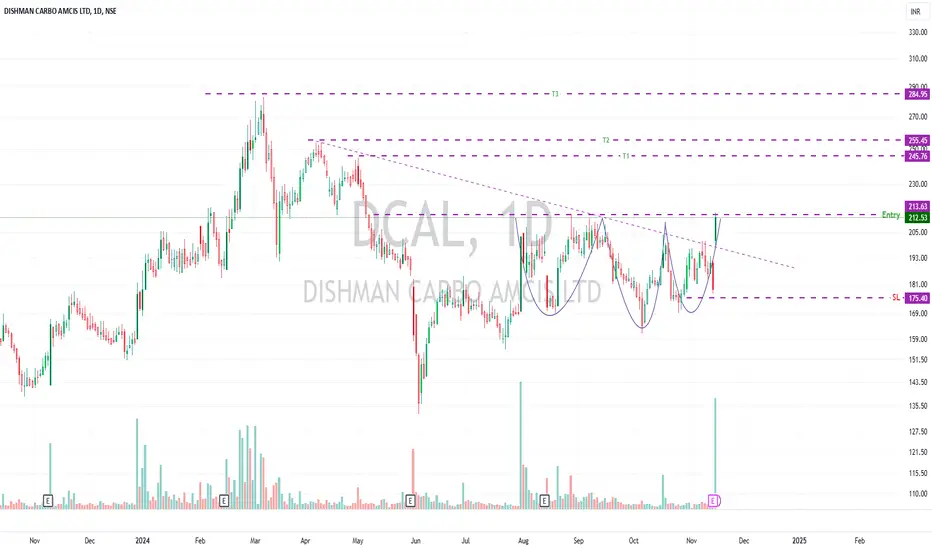
DCAL forming inverse H&S. Keep on the Radar.
-Good Volume today.
-Forming inverse H&S pattern.
-Dry volume when pulling back.
Watch for a breakout above 214. SL is very deep for positional players. Position size accordingly.
Aggressive players can try placing SL below today's candle (196-day closing basis).
The market is on a downtrend. The chances of fake breakouts are very high. Please do your due diligence. This is not a buy/sell recommendation.
PENIND~~DIWALI PICK >READY FOR STRONG BREAKOUT ?NSE:PENIND
PENIND
(PENNER INDUSTRIES LTD)
DIWALI PICK 2024
CMP 207
Buy on Dips till 150
For Targets🎯222 / 238 / 259 / 285 / 299++
Positional Targets🎯 318 / 336 / 255 / 381 / 395++
Best Wishes of Diwali !!
Regards,
Harm⭕nics4Life
20/10/2024
===============================================
Technical Setup
1) Rounding Bottom on charts
2) Inverse Head and Shoulder Pattern in formation
3) Placed Strong above 190 levels (Crucial Breakout Zone)
4) At chep valuations
5) Volume addition
=
National Aluminum looks strong. Add to your WLNationalaluminium- add to your Watch List.
✅Good pattern- Forming VCP, inverse H&S
✅Stock in an uptrend.
✅Resisted the overall market fall
✅Never fell below 50-200 DMAs while many stocks
were trading well below that in this correction.
✅Volumes are picking up now.
✅3 White soldiers on DTF.
This is a good positional long-term bet. Accumulate or pyramid in this.
This is just my view. This is not a buy/sell recommendation. Please trade as per your risk appetite and discret
ORIENTAL HOTELS : Chart Pattern Breakout#ORIENTHOT #Swingtrade #breakout #Chartpattern #Trendingsetup
Orienthot : Swing Trade
>> Inverse Head & Shoulder pattern
>> Trending setup
>> Good Volume & Strength
>> Good Risk Reward Trade
Swing Traders can lock profits @ 10% and keep trailing
Note : In Current Market Scenario, Breakouts can easily fail so Trade Good Setups with Proper Risk Management and Position sizing
Disclaimer : This is not a Trade recommendation, Charts Shared are for Learning Purpose
UPL by KRS Charts21st October 2024 / 10:05 AM
Why UPL ❓
1️⃣ UPL is Bullish Stock long term wise with Decent Fundamentals. 📈
2️⃣ Recent March Low seems like Higher Low in bigger picture ✅
3️⃣ UPL has Formed Inverted H&S and Breakout from it and currently Reversing to Bullish again after Retesting from Prev. Resistance. ↗️
4️⃣ 1D TF, Bullish Hammer is visible and today also moving strong Upside 🔅
UPL Target 716 Rs with SL of 520 1W Closing Basis
BOROLTD - Multiple Bullish Pattern Breakout On Weekly ChartBOROSIL Ltd reveals a combination of bullish patterns, suggesting the potential for an upward breakout on weekly chart.
Here’s a technical analysis:
Inverse Head and Shoulders Pattern: The stock shows an inverse head and shoulders formation, with the left shoulder, head, and right shoulder clearly marked. This pattern is a strong bullish reversal signal, indicating a shift from a downtrend to an uptrend.
Cup and Handle Pattern: Inside the inverse head and shoulders, there’s also a cup an
BALKRISIND looks good for a swing tradeBalkrishna Industries (BALKRISIND) has shown a strong uptrend in the major trend and has recently formed an inverse head and shoulders pattern during the pullback phase of this uptrend. The neckline of this inverse head and shoulders pattern has been broken, and the stock has also taken support at this neckline, further reinforcing the pattern. These factors together indicate a high potential for an upward move in the near future, suggesting that BALKRISIND could see significant upside.
Descending channel Breakout reversal strategyLINDE INDIA
1. Descending channel Breakout reversal strategy
2. Inv Head and Shoulder Pattern
3. Close within 52W high zone (-12.6%)
3. Close above the previous day's high
4. Close above last week high
5. Close above last month high
6. High increase in 1 month (+18.8%)
7. High increase in 6 months (+33%)
8. High increase in 12 months (+47.9%)
7. Promoter holding 75 %
8. Pledged percentage 0 %
9. Change in Prom Hold 0 %
10. FII holding 3.03 %
11. Chg in FII Hold +0.72 %
12. DI
HDFC BANK ( Looking goog to invest); small stoploss is enough;For short term investment ;
Leave a " Like If you agree ".👍
.
Wait for small retracement & daily candle to close above - "1650".
Trade carefully untill ENTRY level.
.
Entry: 1655 / 1640
target: 1675- 1700- 1750
sl: 1640 / 1630
major stoploss/ support: 1600
.
.
Enter only if market Breaks
"Yellow box" mentioned.
.
.
Don't make complicated trade set-up.📈📉
Keep it " simple, focus on consistency " 💹
Refer our old ideas for accuracy rate🧑💻
Follow for daily updates👍
.
Refer old posted ide
TATATECH - Inverse H&S Pattern BreakoutTATATECH - Inverse H&S Pattern Breakout
The chart displays a classic Inverse Head and Shoulders pattern, which is often viewed as a signal of a potential upward trend reversal. This means that after a period of price decline, the stock might be gearing up for a move higher.
The left shoulder, head, and right shoulder are clearly visible, and the price appears to be moving above the neckline, indicating the possibility of a breakout.
Volume Increase:
There's a noticeable rise in trading volu