Webelsolar: Technical Structure, Momentum, and Key LevelsAfter printing a higher high near ₹157 on 12 August, Webelsolar pulled back into a discount zone around ₹50, where buyers appeared to step in. From that area, price has been recovering in a measured fashion, with several signals hinting at improving momentum.
Price reacted from the ₹50 discount zone and began to rise gradually. A weekly inverted hammer formed at that zone—often interpreted by technical traders as a potential reversal cue when it follows an extended decline and is validated by
Inverted Hammer
PCBL: Reversal Structure and Key LevelsThe stock of PCBL has experienced a significant decline from the ₹437 level, followed by a notable recovery from a major support zone, often referred to by traders as a discount or value area. Recent price behaviour indicates the possibility of a trend reversal supported by multiple technical factors.
After a prolonged down move, the stock has reacted strongly from a key bottom support level.
On the weekly chart, the formation of an inverted hammer at this zone adds weight to the expectatio
GSLSU: Trend Reversal Signals The stock of GSLSU has been in a sustained downtrend since May, revisiting its discount zone multiple times. However, recent price action suggests a possible shift in sentiment. On Friday, October 17, the daily chart printed an inverted hammer candlestick, a pattern often interpreted by technical analysts as a potential bullish reversal signal—especially when supported by volume and other indicators.
The inverted hammer on the daily timeframe may indicate buying interest at lower levels. This
Premier Polyfilm Ltd – Inverted Hammer Reversal at Key SupportStrong Bullish Candle After Multi-Month Downtrend
Premier Polyfilm has printed a bullish Inverted Hammer at a major support zone after a prolonged decline — a classic early reversal signal on the weekly timeframe. The stock has been falling consistently for months, and this week’s sharp +12% bounce shows strong buying interest returning near the demand zone of ₹34–₹36.
Price is now closing above the minor resistance zone (₹40–₹43). If sustained, the stock may attempt a short-term trend reversa
ABFRL: Price Action OverviewFollowing a gap-down opening on June 4, ABFRL entered a consolidation phase, trading within a well-defined supply and demand zone. This range-bound movement suggests a period of accumulation or indecision among market participants. During this consolidation, the stock has formed a double bottom pattern on the daily chart—a classical reversal structure that often indicates a potential shift from a downtrend to an uptrend, provided confirmation follows.
An inverted hammer appeared near the seco
Vedanta Levels, Inverted Hammer formed on Weekly ChartAn Inverted Hammer candle formed on the top of the trend. I use the Fibonacci tool for levels.
Zone : Expansion
Trend : Negative
Probability > 65% (On Scale)
CMP : 460.80
R1 : 507.10
S1 : 436.60
S3 : 393.00
Disclaimer: This is my pre market analysis and my trading journal. Not a suggestion to buy or sell.
1D BANKINDIA (Bank Of India) - Short Position1. Pinbar formed at S/R level
2. Fibonacci Retracement 61.8% confirms that S/R level.
3. Trendline is in perfect position for the pinbar which acts as trendline.
4. Stop Loss and Take Profit levels are perfectly mentioned in the chart window.
5. Once Take profit level reached, try to sell half of your stocks position there and move your stop loss to breakeven and run another half stocks for freedom.
Thanks by
Pupathi Sadagopan
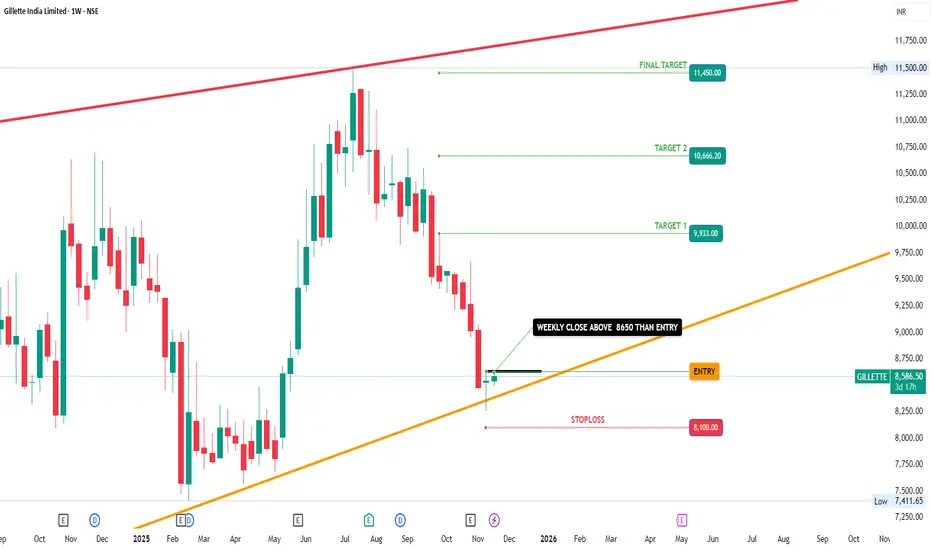
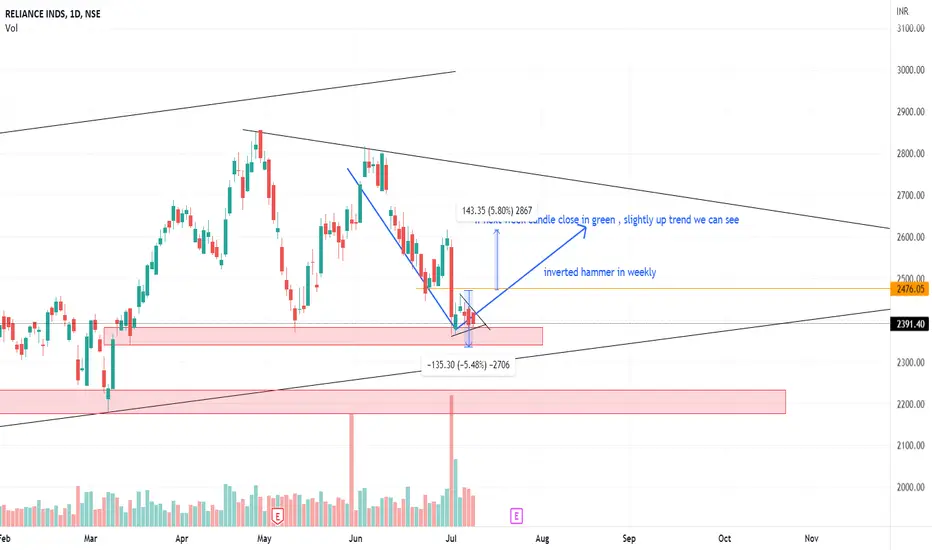
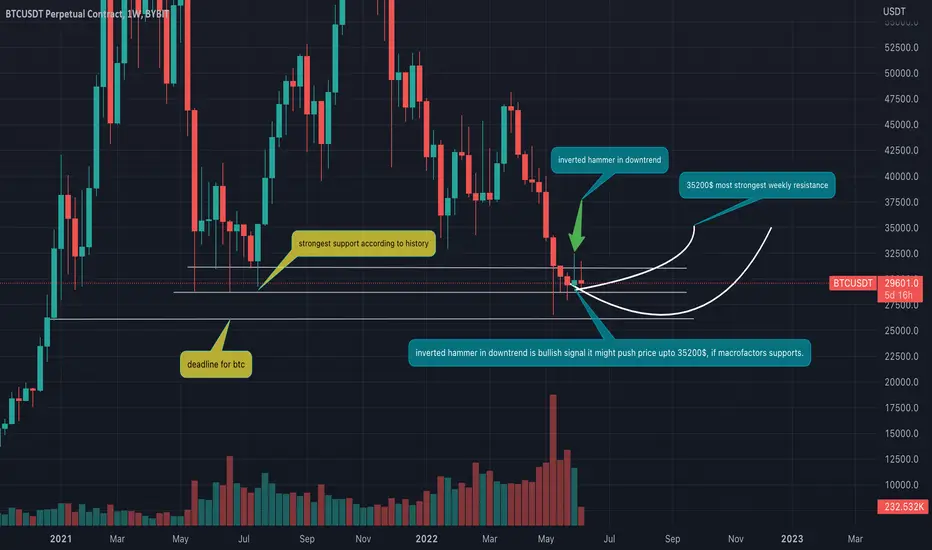
Inverted HammerThe Inverted Hammer also forms in a downtrend and represents a likely trend reversal or support.
It’s identical to the Hammer except for the longer upper shadow, which indicates buying pressure after the opening price.
This is followed by considerable selling pressure, which wasn’t enough to bring the price down below its opening value.
Again, bullish confirmation is required, and it can come in the form of a long hollow candlestick or a gap up, accompanied by a heavy trading volume.
Script = A
Inverted Hammer
The Inverted Hammer also forms in a downtrend and represents a likely trend reversal or support.
It’s identical to the Hammer except for the longer upper shadow, which indicates buying pressure after the opening price.
This is followed by considerable selling pressure, which wasn’t enough to bring the price down below its opening value.
Again, bullish confirmation is required, and it can come in the form of a long hollow candlestick or a gap up, accompanied by a heavy trading volume.
Script =
Inverted HammerThe Inverted Hammer also forms in a downtrend and represents a likely trend reversal or support.
It’s identical to the Hammer except for the longer upper shadow, which indicates buying pressure after the opening price.
This is followed by considerable selling pressure, which wasn’t enough to bring the price down below its opening value.
Again, bullish confirmation is required, and it can come in the form of a long hollow candlestick or a gap up, accompanied by a heavy trading volume.
Script = H
SOLARINDS Inverted Hammer is form near resistance area. Inverted Hammer is form near resistance in SOLARINDS. if on daily timeframe red candle is form in next trading session then this stock will be more bearish in upcoming days. if it will break the resistance zone and sustain above then only thinking for buying this stock for swing trading. as of now looking bearing.
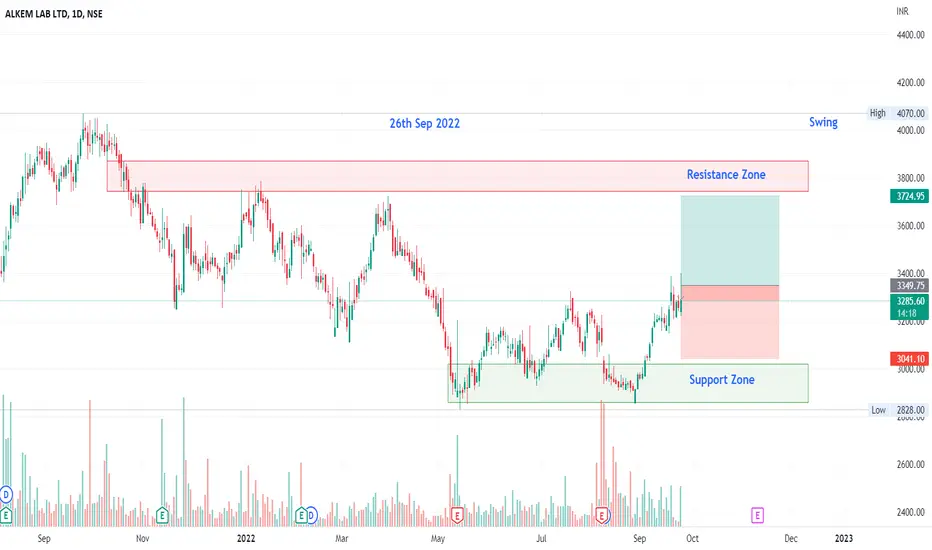
ALKEM - Inverted Hammer with VolumesNSE: ALKEM is closing with an inverted hammer candle supported with high volumes.
Today's volumes and candlestick formation indicates strong demand and stock should move to previous swing highs in the coming days.
The stock has been consolidating for the past few days and moving along the trendline which is indicating demand.
One can look for a 8% to 11% gain on deployed capital in this swing trade.
The view is to be discarded in the event of the stock breaking previous swing low.
#NSEindia
Nifty sell below 17600nifty on weekly chart showing falling trend line from highs
beautifully a inverted hammer with red candle formation, with exactly respecting trend line
nifty making lower highs and lower lows sign of down trend (HL and LL)
after breakdown of level 17600 big fall in intraday can be expect here
potentially down side targets will be 16790 then 15880
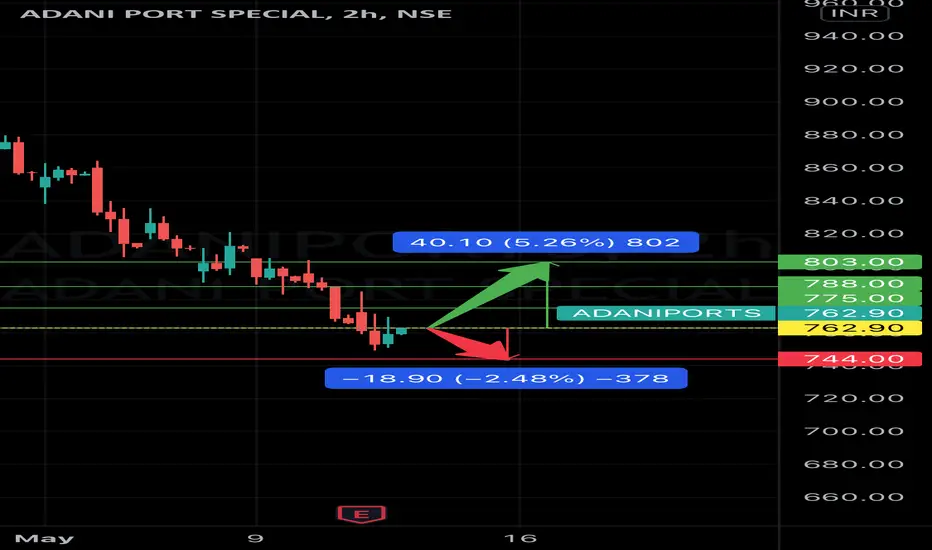
Expecting a bullish momentum in ADANIPORTS As per the 2 Hour Chart of ADANIPORTS, we have witnessed the formations of an inverted hammer, and a bullish harami followed by a confirmation candle on the downside levels.
Therefore, we are expecting to witness a bullish momentum in the stock in the upcoming trading sessions. Wherein, the stock is being expected to face a resistance initially at around the levels of 775, 788, and 803. Whereas, on the other hand, on the downside levels, the stock may face a support at the level of 744, on clos
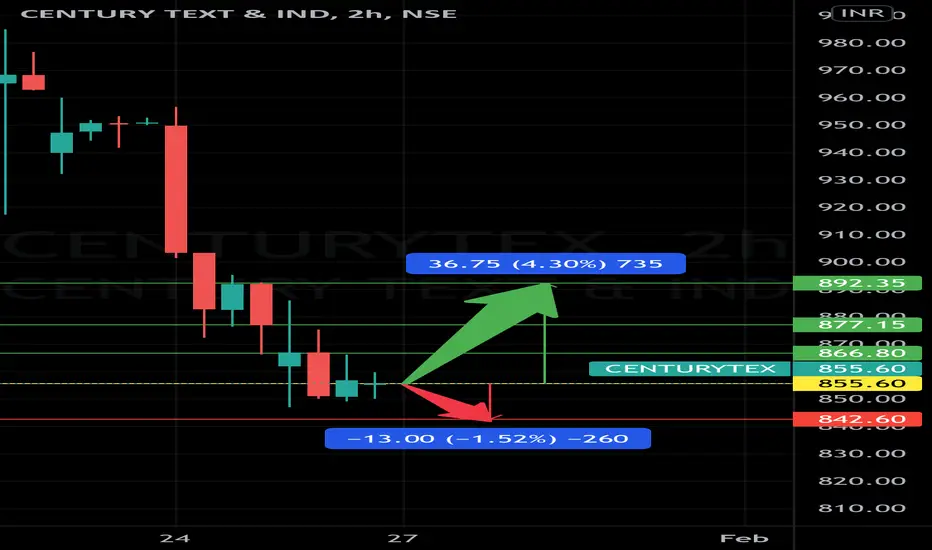
Expecting a Bullish Move in CENTURYTEXAs per the 2 Hour Chart of CENTURYTEX , we have witnessed the Formations of “Bullish Harami” as well as “Inverted Hammer” on the downside.
Therefore, we are expecting to witness a bullish momentum in the stock in the upcoming trading sessions. Wherein it is being expected to face a resistance initially at around the levels of 866.80, 877.15, and 892.35. Whereas, on the other hand, on the downside levels, the stock may face a support at the level of 842.60, on closing basis.
Closing Price (as
CLong