Falling wedge chart pattern The Falling Wedge is a bullish pattern that begins wide at the top and contracts as prices move lower. This price action forms a cone that slopes down as the reaction highs and reaction lows converge. In contrast to symmetrical triangles, which have no definitive slope and no bias, falling wedges definitely slope down and have a bullish bias. However, this bullish bias cannot be realized until a resistance breakout occurs.
Investing
SASKEN TECHNOLOGIES coming out of base.About:
Sasken is a specialist in Product Engineering and Digital Transformation providing concept-to-market, chip-to-cognition R&D services to global leaders in Semiconductor , Automotive, Industrials, Consumer Electronics, Enterprise Devices, SatCom, and Transportation industries, etc.
Located in India, the company has presence all over the world
Technical Points:
1. Price near Resistance zone.
2. Huge Volume Activity near Resistance Area (9x volume above average)
3. Huge Volume Activity w
Breakout AlertInitial sign of Trend Reversal with extremely high volume . i know price up 20% today but this type of candles low maximum time price not break . #mstc
MLong
TWL : +25% Upside Potential28 Nov 2022 TWL
In Play : HH : HL
CMP 183
BO with good volume, after 3 months of the consolidation period, momentum is likely to continue for higher targets of 191.65-211-224, RT of TL can be used to initiate trade for the mentioned targets…
Wish You Happy & safe trading
Views are for ‘’EDUCATIONAL PURPOSE ONLY’’ trade at your own risk.
"Always Respect Risk"
Happy Trading
Jai Hind Jai Bharat
BPCL long opportunityNSE:BPCL
Stock -> BPCL
TimeFrame -> Weekly
Hello all!
BPCL has been moving in a channel since Sep 2017. Its came back to its lower trendline, took support, bounced off and now has broken trendline 1 with good volumes. This makes for a good opportunity to go long!
Risk-averse traders should wait for a strong closing above the nearest swing high (yellow box). The stock will start trading above its 50-week EMA after it crosses the swing high and thus the probability of success would be much hi
ITDC : +62% to 597% Upside PotentialITDC 27 Nov 2022
We witnessed a sharp rise in price which is supported by volume, exactly at the TL after a long period of consolidation.
In Play : HH-HL
Summary
• Sharp rise in Price
• Price rise supported by volume
• POC 404
• Resistance 466 (Pre SH)
• ATH at 747
Conclusion
• CMP - 404.55
• Test qty can be initiated on break of TL
• Add to the position on RT-TL
• Higher Targets could be around
o Short/Mid Term - 546-659
o Long Term – 1137-1693-2821(we will watch for supportive price action to
BHEL GETTING STARTED1. 2021 High Breakout.
2. Huge Breakout Volume.
3. Aggressive New longs in Futures.
3. Increased Deliveries.
4. Huge Volume Activities in last couple of months.
5. Strong Relative Strength and RS inclined up (meaning Stock continues to outperform benchmark).
6. Net Alpha of 42.71% from ARS date 7-March 2022.
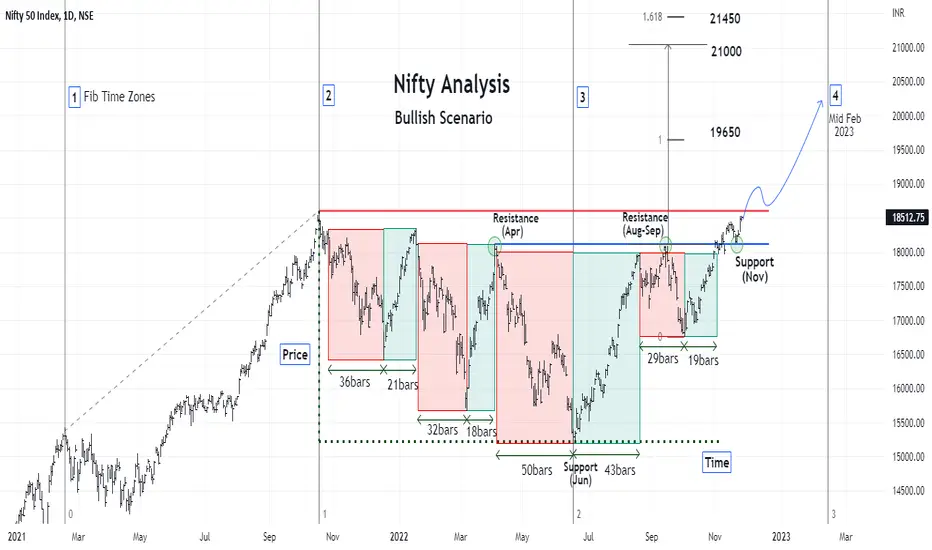
Nifty Analysis: A Bullish Scenario 🚀Hi 👋
There are always two potentially predominant scenarios possible in the stock market – Bullish and Bearish. Most people involved in the stock market like to read and appreciate the positive side of the market, that is bullish. This is because they always ‘Buy’ and never sell. Neither they sell to ‘Short’ the market nor to take profit 😉
This idea is representing the bullish scenario of the market. I have used minimal tools – Support and Resistance; Fib Time Zones; Fib Extensions and a self-
BHEL : +67% to +239% Upside PotentialBHEL 25 Nov 2022
The stock was showing a good price action for the past couple of weeks, today BO of previous resistance TL with good volume.
In Play : HH-HL
Summary
• Clean TL BO with Vol
• Trading above VAH
• Next Resistance 108 : SH
Conclusion
• CMP 80.65
• Test Qty can be initiated
• Add to the position on RT-TL
• Higher Targets could be around
o Short Term : 102/120
o Mid/Long Term : 145-177-264
Wish You Happy & safe trading
Views are for ‘’EDUCATIONAL PURPOSE ONLY’’ trade at your own ri
Big Boy Reliance : +15-24% Upside Potential25 Nov 2022 Reliance
Stock is hovering in the zone of 2500 +/-10% for the past 1 year, now showing some strength.
In Play : HH-HL
Summary
- Stock bounced from the VAH zone
- few weeks of low volume PB
- TL likely BO
- ATH is at 2856
Conclusion
- CMP 2618
- Test position can be initiated on BO of TL(as of now BO may fail : Low Volume @ TL)
- Rest Qty can be planned on RT of TL
- Higher targets could be around
• Short Term
GSPL : +15% Upside Potential25 Nov 2022 GSPL
Stock BO of previous TL on 15 Nov 2022 with huge volume, after spending 2 weeks in the zone fresh BO is seen with volume, likely momentum to continue.
Summary
• BO/RT done
• Stock has shown a good support @POC around 238 zone
• 76 days of accumulation
• Fresh BO
Conclusion
• CMP 260.45
• Initiate test qty
• Higher targets could be around
o Short Term – 276/296
o Mid to Long Term – 332/379(Important resistance to watch out for 311-326)
Wish You
GLong
Wipro breaks out !After a few bearish days, many stocks broke out fro. found bases wipro breaks out of a superb triangle pattern and looks promising
to go upwards.
it is at its bottom and very good chance for a long term trade or even investment based purely on technical analysis
stop loss below the triangles support
and target1:3!!
Keep It Simple