Leading Diagonal
With exiciting termination wave -An Leading Diagonal in SUZLON.Review the " Leading-Diagonal ": As you know, Leading Or Ending Diagonals one of two types of motive waves, the other being in impulse wave. The Leading Diagonal is a terminating wave pattern that is form the 1st wave position of impulse waves or as wave A. This is an example here live - SUZLON. We have an Leading diagonal in the 1st wave position of an impulse wave. Now what's exciting about this real-time example:
1) We've throw if you connect the trend lines which connect the extremes of
Nifty 50- Chart update 1HRAll rules of Leading diagonal is followed in Nifty. The correction may be deeper in case of Leading
Diagonal, generally the retracement for a diagonal is supposed to be in the range of .618 to .786.
The range between 15400-15600 is a good zone to accumulate. Long may be initiated near the rectangle shown.
Please do your analysis before opting for a trade/investment.
Regards
NIFTY - UPDATE ELLIOTT WAVE CORRECTIONGuys, first of all I would say sorry to you.
I am not updating the chart as usual, Last analysis was about nifty and we recommended nifty to Long at exact bottom.
Our target of nifty is about 17300 and that will be achieved, but pardon me its not a bull rally, its a corrective rally.
We may touch around 15700-15600 levels as I can see in nifty and then we can see a rally towards 17000, plz excuse me, if not exactly, we will reach approx levels.
Your likes motivate me to do some adventures....
DOW JONES: A leading diagonalIndex is unfolding as a leading diagonal of which 4th wave is already concluded and right now we are into the last stages to complete the 5th wave of this leading diagonal which will bring the index below the level of 30635 in the near term. Traders should remain short for the minimum target region of 30600-30000 in the coming weeks with stop loss of 32600.
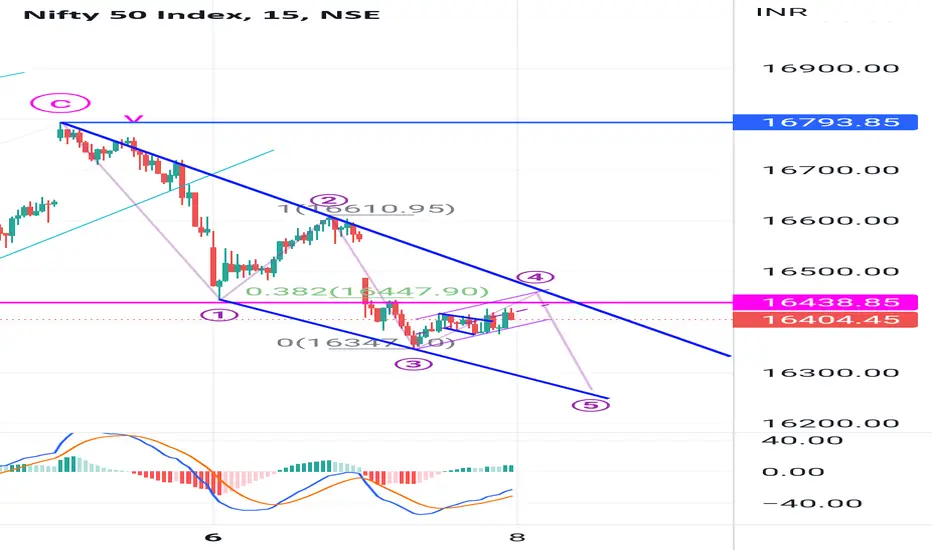
Nifty forming Leading diagonal patternWave 4 expected to end near 16450.
Wave 5 pending we will see it getting completed tomorrow near 16300-250.
Consolidation is then expected as ABC correction. Not much happening this week.
Fall should continue next week.
DISCLAIMER:There is no guarantee of profits nor exceptions from losses.
Technical analysis provided on the chart is solely the personal views of my research.
You are advised to rely on your own judgments while taking any investing/Trading decisions.
Past performance is not an
GAIL is going to sail wave 5Gail looks to have come out of wave 4 and now making leading diagonal for starting wave 5.
Leading Diagonal chart as below
Upside potential of almost 60% expected targets near 230. One can look for lower target as well of 0.618 extension near 190.
Details of entry exits and targets as per charts.
DISCLAIMER:There is no guarantee of profits nor exceptions from losses.
Technical analysis provided on the chart is solely the personal views of my research.
You are advised to rely on your own j
CRUDE OIL : A possible leading diagonalLEADING DIAGONAL: In a leading diagonal , waves 1,3, and 5 are all impulsive in nature or all in corrective form of zigzags. Wave 2 and wave 4 are always present in a zigzag form. A leading diagonal suggests the starting of a new wave & that is why it can develop wave 1 of a impulse wave and a first wave of a zigzag pattern.
TRADING STRATEGY:
Buy Crude oil : 89-89.5$ keepin SL of 87.8$ look for the target of 93.3-94.3$
WaveTalks : Nifty - Can Bulls Come Back? 17800+ Parallel Channel Support + Important psychological level close @ 17000 - Can Bulls Come Back ? Holding above channel, Index can bounce to levels mentioned below
Target 1 - 17300
Target 2 - 17450
Target 3 - 17620
Target 4 - 17690
Target 5 - 17800+
_______________________________________________________________
Last Idea - Ending Diagonal At 17795 - Fall to 17041 (Fall of 700+ Points)
_______________________________________________________________
Thank You
Nifty - Possible Leading Diagonal / Bearish GartleyThe leading diagonal or rising wedge or type-1 diagonal, is a narrowing price move composed of two converging trendlines.
If bottom or lows of 16836 & 16866 holds then Index can push upside tomorrow on account of Budget 2022
-----------------------------------
Trading Strategy
-----------------------------------
-----------------------------------
Part A - Mixed Outlook
-----------------------------------
Buy Above 17325 - Target 17410 / 17500 - Going into the PRZ (Potential Reversal Z
WaveTalks-Nifty-The Evening Star / Wedge CollaborationThis short video explains how the evening star turns into a wedge pattern. If correct, downside 16590 was critical support, holding above Nifty could bounce back again to 16680-16700. On the upside, Holding below 16712 highs, It can attempt to fall back again to 16615-16625 & assuming that if Index falls below 16590-critical support, it can fall to 16500 / 16440 / 16400 levels
When you splash around the water, you get to hear a peculiar sound which you heard over the video at the start.
I hav
HDFC: WaveTalks- Pattern / Patience & Penultimate Correction
WaveCount
---------------------------------
• 1-2 -3 -4 (Running Currently) - 5th Wave Expected Upside.
• 4th Wave
o Unfolding as Triangle having last leg - "e" wave close to end.
o 4th Wave Triangles are "penultimate wave" means it is 2nd last wave & one more wave left in the structure which started from the lows of 1473 on 23rd / 25th March2020.
• 5th Wave - Expected Next
o 5th Wave can be explosive upside & can travel upside to 2900+ high in days & weeks ahead
Traditional Char
HLong
Nifty 50 ShortAfter completing the super cycle W5, Nifty entered into what could possibly be a correction (or a bear market?) in text-book style leading diagonal pattern(Wave 1). Currently its either approaching end of Wave 2 or already just completed W2. Expect Wave 3 to be nasty and swift and deep.
Target Date: Likely by mid to end of June
Target correction: 10 to 20%.
Glenmark Expanding Leading Diagonal on Monthly ChartGlenmark is expected move in expanding Leading Diagonal.
V wave of leading diagonal always moves beyond end of wave III.
V wave expected to move minimum 100% of length 0 to III somewhere near 1400+.
Most likely to 138%(1.382) or 168%(1.618) which are near trend line.
The prospects and analysis are for long term if anyone wants to keep stop loss then they would 405 or 161
DISCLAIMER:There is no guarantee of profits nor exceptions from losses.
Technical analysis provided on the chart is solely t
Reliance : A probable thesisThe rally from 1830 to 2231.9 looks like a Leading Diagonal which could be Wave 1 or A and the recent correction could be Wave 2 or B. The correction is around 0.618 level and the price is penetrating around 0.618 level. So what I think is that if Reliance starts moving higher from here the next impulse could be very strong.
This is just a rough idea at this stage and further developments can provide us more clarity.
#BANKNIFTY completes Wave 1 leading diagonal-expect more upside Yesterdays top can be counted as the end of a leading diagonal and should now corrected in 3 waves. When done this this should position itself for a long and sustained rally.
Alternate count - count yesterdays move as the completed 5 waves as an ending diagonal - not very likely as the price move/ distance travelled for this wave is miniscule compared to Wave 1
Nifty- Leading Diagonal Fall from 11920Last Price - 11860 / 10:37 Hrs -4th Nov2020
This view is not valid if Nifty crosses above 11930
-------------------------------------------------------------------------------------------------------------------------------------------------------------------------------------------
Already suggested in last video idea - US Markets are doing retracement for the last week's fall & 3550 is the key level so any upside move is just bounce back rally
You just need to identify the key levels to
The price moving towards the FIVE Wave in bulls market. NIFTY!FIRST Wave: ( Leading Diagonal Contracting )
In the first wave, we have detected the Leading Diagonal contracted within two yellow-colored covering lines but the leading diagonal occasionally appear in the first wave position of impulse. I have labeled by using roman numbers.
SECOND Wave: ( The 50% Retraced )
Its a corrective wave formed A, B, and C. Its retraced 50% from the first wave and the price didn't carry to a new low.
THIRD Wave: ( Impulsive and Extended )
This wave is strong and
Banknifty In Uptrend 5th Impulse Wave of Leading DiagonalAs explained in previous chart we were able to pin point Banknifty's down move.
Downward wave four 4 was double zig zag correction which completed near 24404.
We are witnessing now final Wave 5 impulse of leading diagonal and currently in wave iii which should extend 2.618=24785 to 25000.
There will be sideways correction next may be till 23500-23300.
Final Wave 5/v should reach 26361 Fibonacci 0.618 retracement from march low or bit higher for 27000.
As it already moved very rapidly Inv