ICICI BANK Trading idea and analysisDisclaimer: Don't just blindly Trade or Invest, learn and then trade. Manage your risks properly.
This analysis is purely for EDUCATIONAL purpose, just to give an idea on the price movements!!
DO NOT FORGET to put your own STOPLOSS!!
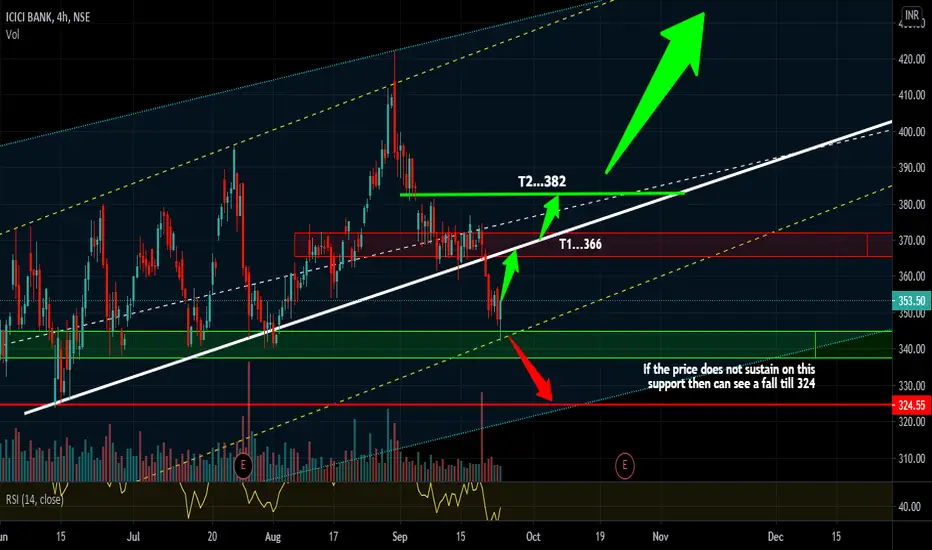
If the price is unable to take out the red zone in 1hr & 4hr time frame then it will consolidate in between the red and green zones.
If overall market sentiments are negative & do not sustain the green zone then it will fall to the redline.
ICICI Bank is a portfoli
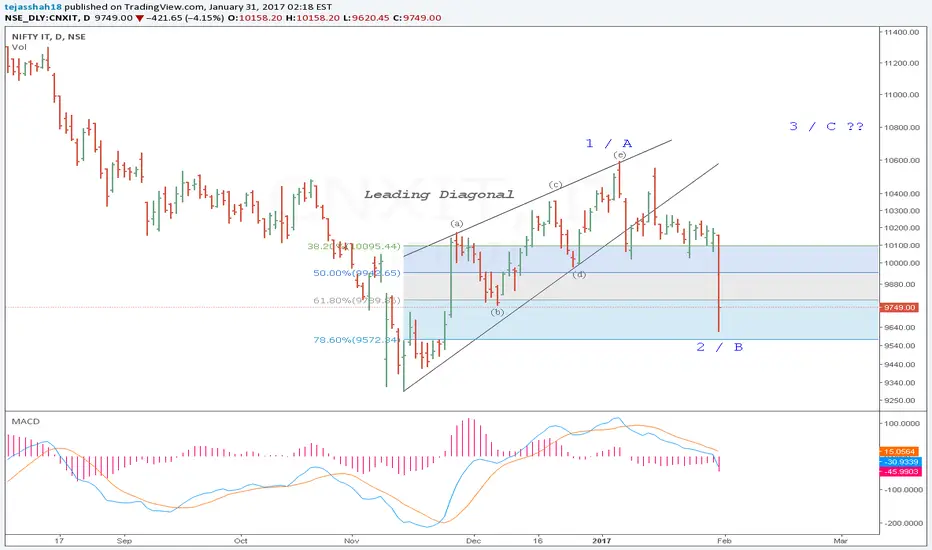
Leading Diagonal
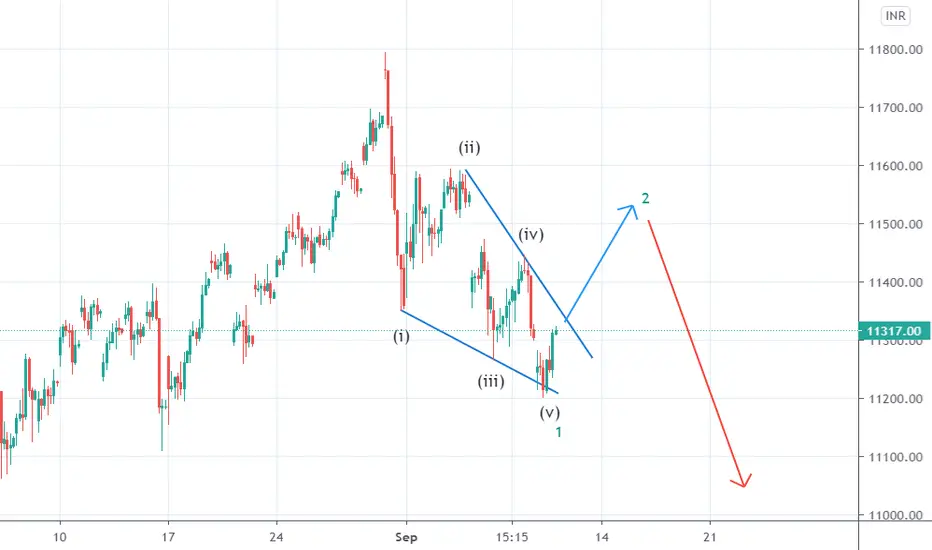
Banknifty Corrective wave after Leading Diagonal on 15 min chartDISCLAIMER:There is no guarantee of profits or no exceptions from losses.
Technical analysis provided on the chart is solely the personal views of my research.
You are advised to rely on your own judgments while investing/Trading decisions.
Past performance is not an indicator of future returns. Investment is subject to market risks.
Seek help of your financial advisors before investing/trading.
--------------------------(((((LIKE)))))-----------------------------
Target 20735 which is 0.5 Fibo
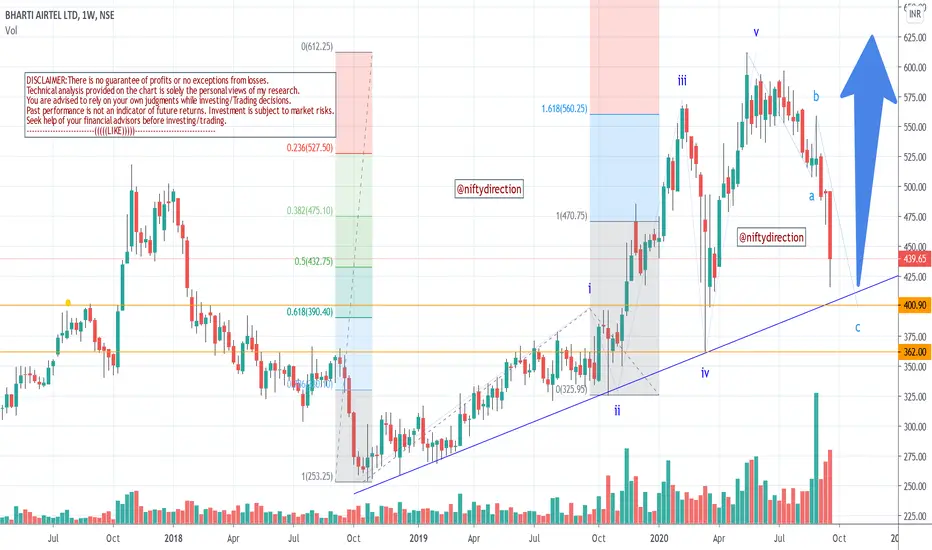
Leading Diagonal On Bharti Airtel can Lead to 1K+DISCLAIMER:There is no guarantee of profits or no exceptions from losses.
Technical analysis provided on the chart is solely the personal views of my research.
You are advised to rely on your own judgments while investing/Trading decisions.
Past performance is not an indicator of future returns. Investment is subject to market risks.
Seek help of your financial advisors before investing/trading.
--------------------------(((((LIKE)))))-----------------------------
Currently in corrective Waves
#Nifty Short term upsurge expected#Nifty has charted a leading diagonal and should surge up in a corrective rally for next few days - largely led by reliance which is expected to burst up from Wave 4 triangle to complete its last leg of the rally as a market leader since Mar '20
The Medium term picture points to a large fall post this rally.
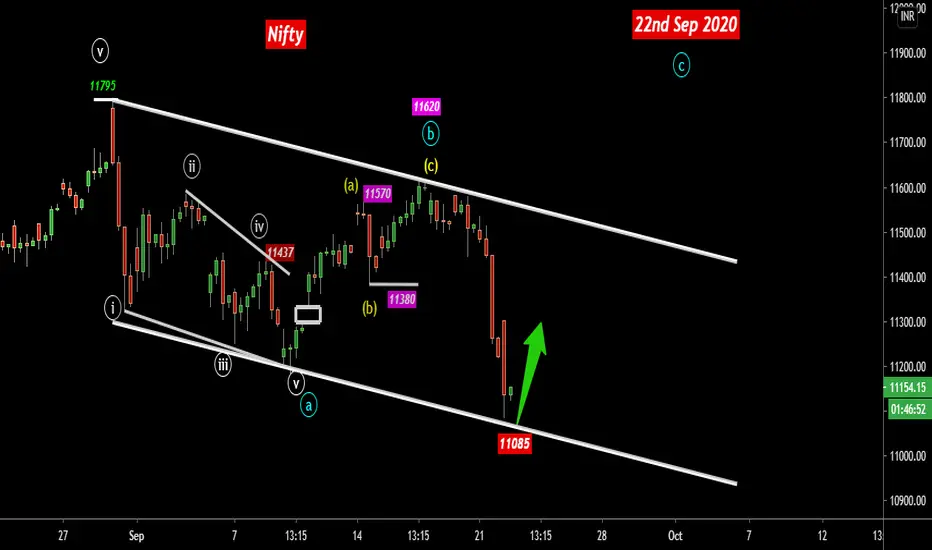
Nifty- Channel Support At 11085 (Bounce Expected)Last Price- 11050 / 11:27 Hrs / 22nd Sep 2020
Hope You Enjoyed The Last Crack from the Tops of 11600 to 11085 . Some relief can be expected until it holds the channel support at 11085 -day low so far.
Stops Below 11085
Target - 11190 / 11250 / 11325
-------------------------------------------------------------------------------------------------------------------------
Last Nifty Idea - Catching The Tops at 11600
----------------------------------------------------------------------
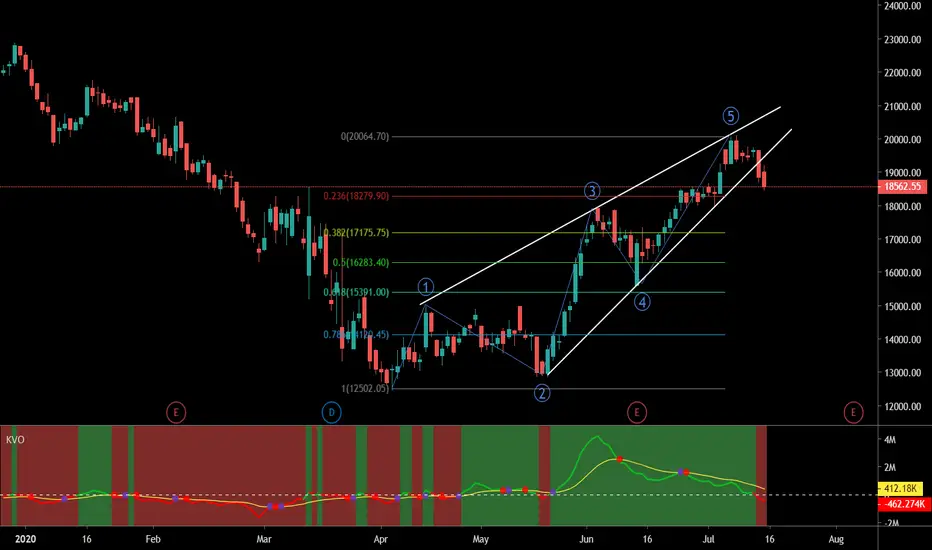
BankNifty- Leading Diagonal Scenario Leading Diagonals have 2 forms or shapes which is rarest of patterns seen in the markets
1st form - can be 5-3-5-3-5 structure (upside or downside)
2nd form- can be 3-3-3-3-3 structure (upside or downside)
Bank Nifty ( Possible 2nd form) unfolded from 24th March 2020
In the current scenario ( a possible example of 2nd form i.e. 3-3-3-3-3- could have unfolded in Bank Nifty) - i.e. ( Wave-i circled is yellow wave - (w)-(x)-(y) ) & so on.
When all global markets turned upside in March 2020
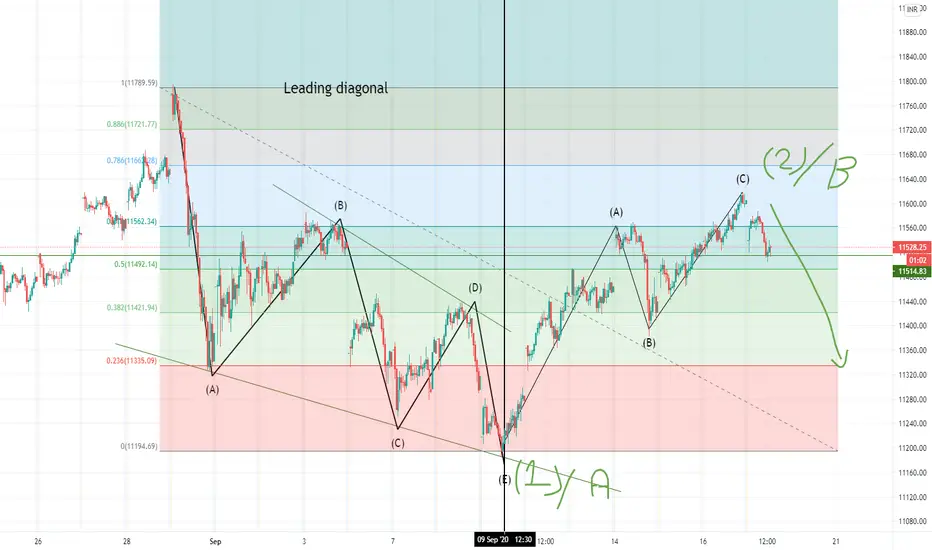
Is Nifty on Leading diagonalOm Namah Shivay
Brothers, Nifty could be making a leading diagonal. Check the chart.
Little early to confirm the same.
And that will confirm the pattern and target. The target is based on the (2)/B obviously.
The future possible moves are on chart.
This is just education purpose only. There are no trading suggestion from this.
Om Namah Shivay
Minda Industries Leading Diagonal end Wave 3 StartStock post breaking Leading Diagonal started upside with big volume.
Long all dips towards 330-310
Wave 3 has started which should move towards 400-420 (1.68 Fib level) zones.
STOP LOSS 277
In longer horizon Wave 5 (equal to Wave 1) positional target 475. Wave 4 will be complex and long correction towards 365 (0.382 fib level).
Disclaimer: Calculated and plotted values may differ little with actual stock movement. Plotted wave count can be wrong. This investment/trade may not be suitable for
MLong
Century Updated Triangle Chart !TREND ANALYSIS & TRADE SETUP
Follow Chart Instruction.
Do not be Hurry for entry.
Wait for Proper Entry Setup.
Buy/Sell with Best Risk Reward.
Educational Chart Only.
August Series Option can be traded.
Wait for entry setup, if available then Long/short.
Reward is 8-10 Times
CLong
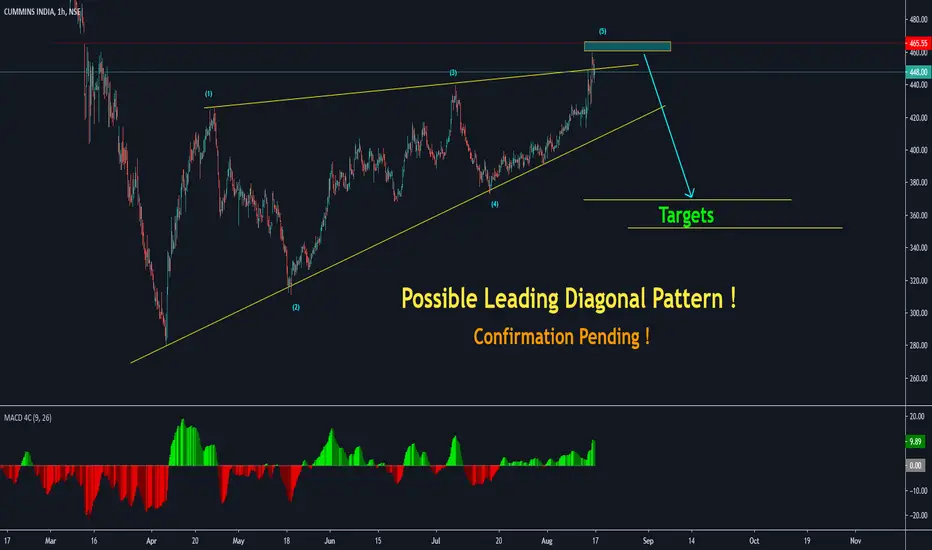
Cummins Ind Chart Pattern !!TREND ANALYSIS & TRADE SETUP
Follow Chart Instruction.
Do not be Hurry for entry.
Wait for Proper Entry Setup.
Buy/Sell with Best Risk Reward.
Educational Chart Only.
August Series Option can be traded.
Wait for entry setup, if available then Long/short.
Reward is 5-6 Times
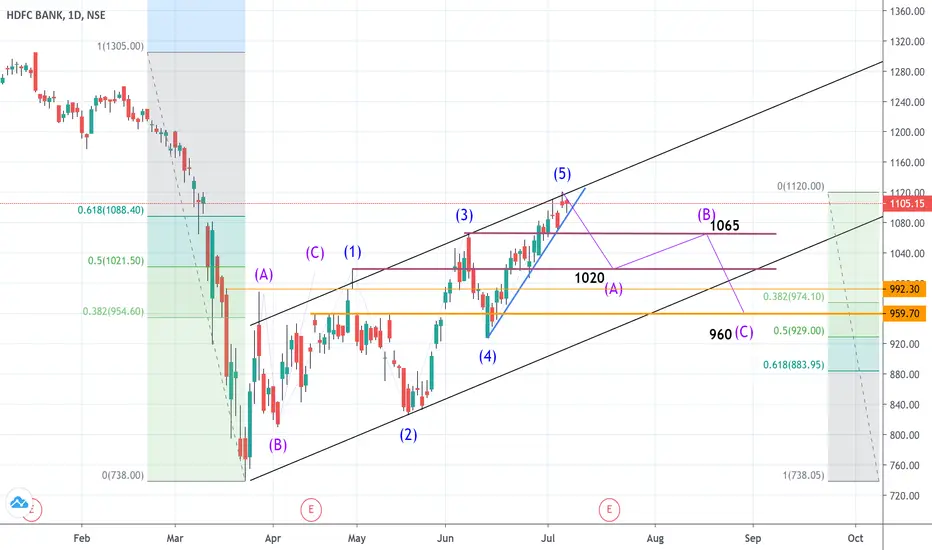
HDFCBANK Leading Diagonal 5th Wave EndHDFCBANK retraced more than 61.8% from top. Leading Diagonal wave is 5 wave pattern which is formed in wave 1 of impulse or wave A of Zigzag.
HDFCBANK to start fall post close below 1093 on hourly chart. SL can be 1120-30.
Potential wave targets are in coming days
Wave A 1046/1020
Wave B 1075/1065
Wave C 1002/960
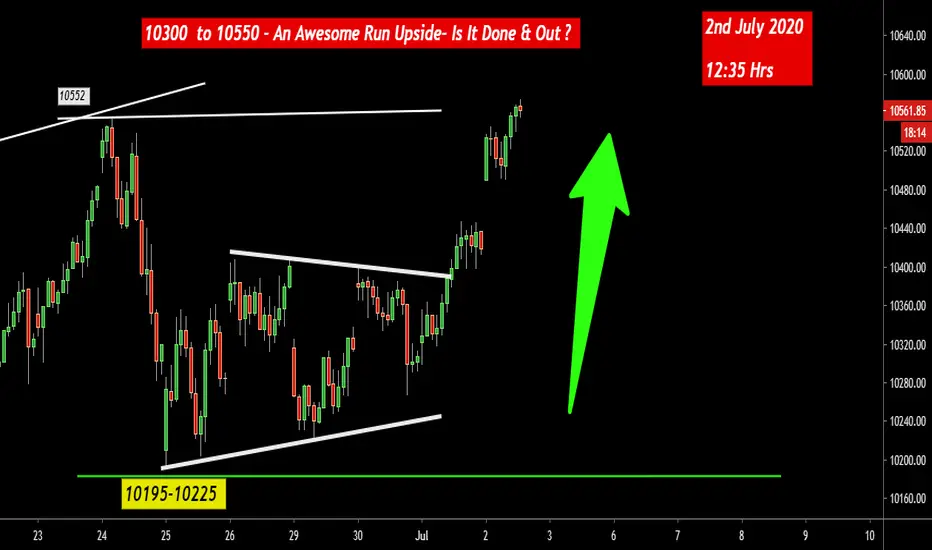
Nifty-10300 to 10550-An Awesome Run Upside- Is It Done & Out ?Disclaimer
-----------------------------
All investments involve risk, and the past performance of a security, industry, sector, market, financial product, trading strategy, or individual’s trading does not guarantee future results or returns. Investors are fully responsible for any investment decisions they make. Such decisions should be based solely on an evaluation of their financial circumstances, investment objectives, risk tolerance, and liquidity needs.
---------------------------------
Nifty -Possible Leading Diagonal-Selling from the Tops @10550Disclaimer
-----------------------------
All investments involve risk, and the past performance of a security, industry, sector, market, financial product, trading strategy, or individual’s trading does not guarantee future results or returns. Investors are fully responsible for any investment decisions they make. Such decisions should be based solely on an evaluation of their financial circumstances, investment objectives, risk tolerance, and liquidity needs.
----------------------------------
Nifty - Is 11461 the Bottoms- Accumulation WedgeShort First & Long Later
Trading Strategy
Plan A –
Selling in 11685 -11710 for Targets - 11650-11660
Plan B –
Selling below 11650 for Targets - 11600-11615
Plan C –
Selling Below 11600 for Target zone - 11525-11540
Plan D –
Buying in 11600-11615 zone with strict stops below 11590 for 11700-11710 & Above 11725 for 11775-11800 & Above 11825 for 11980-12000 & Above 12050 for 12150-12200
Plan E-
Buying from 11525-11540 with strict stops below 11500 for same targets as sugges
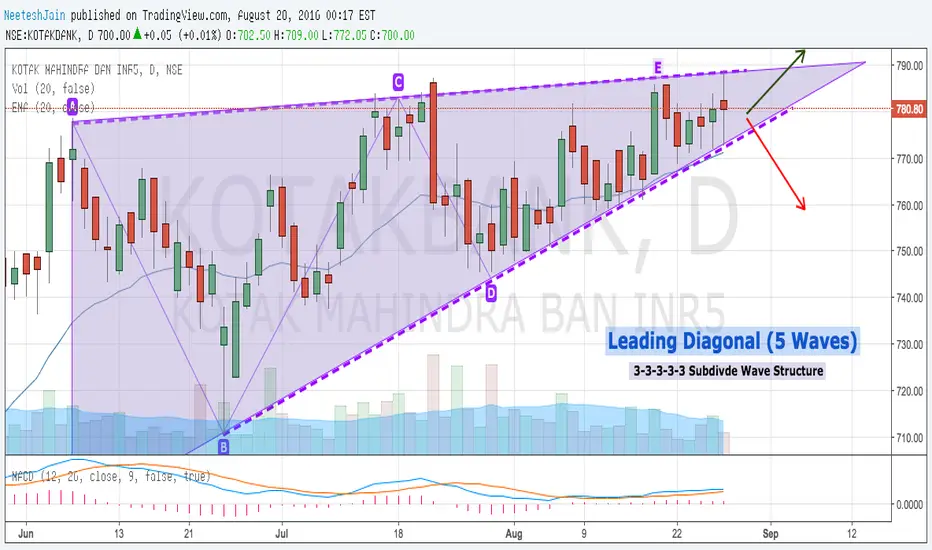
KotakBank - Forming A LEADING TRIANGLE PATTERNIt is interesting to watch the price action forming a leading triangle as it can represent a new Wave 1 after a all time high breakout. This chart pattern is generally known as continuation trend pattern and subdivides wave structure in 3-3-3-3-3-3 that indicates consolidation between buyers and seller to move prices.
The breakout from here on will define trend and keeping it on my watchlstt for tomorrow.
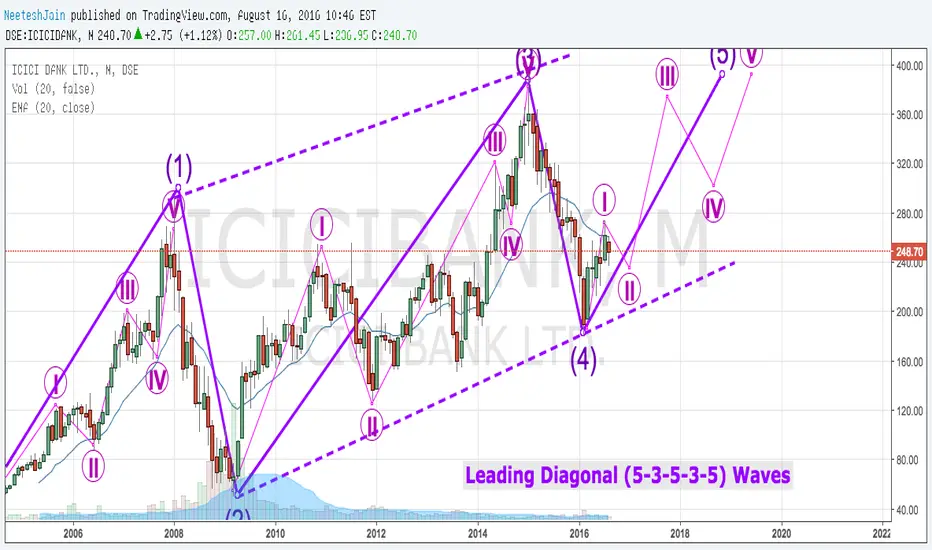
ICICI Bank - WAVE 5 IN PROGRESS ON MONTHLY (Good Investment)I have observed that the price action of ICICI on monthly chart is trending up and building a clear leading diagonal. It is been moving in 5-3-5-3-5 waves pattern that is narrowing gradually with the price action. At present, It is been observed that the leading diagonal has completed its Wave 1, Wave 2, Wave 3, Wave 4 and now it is preceding towards the completion of Wave 5 that will take the price action to expected levels of 400 in months to come. It is an decent opportunity to invest with l