BankNifty Monthly Expiry Trade PlanBankNifty Monthly Expiry Trade Plan Banknifty following a channel. either side breakout of this channel will initiate trending moveby mayureshk900
Bearish flag pattern in BNA bearish flag pattern can be seen in BN ~ Seller me take control from here but still buyers are trying uphold the price ~ Buyers at 400 & 300 level are taking support if that breaks with momentum candle that a active sellers ~ Also trenline support can make bounce towards days high. ~ Wait n watch for a good oppourtunity to enter. Note : Do your own analyisi before making any trading or investment by Price_actiontaker140
2 Amazing swing trade ideas for 12 Sep Markets I daily make educational content videos for swing / positional trading Long05:53by Apoorv-Dubey_SEBI-RA17
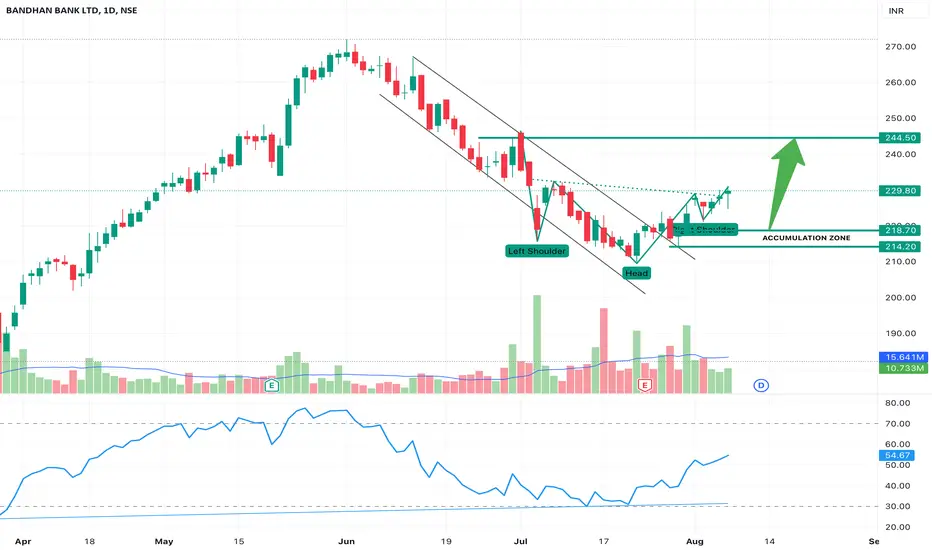
Bandhan Bank - Head and Shoulders Bottom"Head and Shoulders Bottom" or "Inverse Head and Shoulders" pattern formation on daily chart of BANDHANBNK. This pattern is often used by traders to identify potential trend reversals in financial markets, particularly in stocks. The pattern indicates a shift from a downtrend to an uptrend. Here's a breakdown of the pattern: Downtrend and Accumulation: The pattern typically forms after a prolonged downtrend. During this period, the price reaches a bottom and starts to consolidate, formiby hardeepssethiUpdated 5
East india hotel-Beautiful IVHS patternEIHOTEL has beautifully formed an inverted head and shoulder pattern in weekly TF with neckline being an important supply zone of 200-210. The stock has given a weekly closing above this zone and is looking ready for a breakout. It can be added on dips upto 195 with a SL of weekly closing below 184. ATH level of 227 might prove as a minor resistance before a bigger upmove. Keep this stock on watchlist as hospitality stocks like ITC, Chalet hotels, Indian hotels have already started the uptrend.Longby chartistameyUpdated 3
#Titan cash : Flag pattern breakout on Weekly#Titan cash 06.09.2023 Looks good above 3200.10 Stoploss 2900 Tgt 3900-4000 current price 3176.05Longby anandnst6
3 Swing trading ideas for 6 Sep Markets I daily make educational content videos for swing / positional trading Long05:27by Apoorv-Dubey_SEBI-RA630
The Diamond Bottom patternThe Diamond Bottom pattern is a technical analysis pattern that can indicate a potential reversal in a downtrend and the beginning of a new uptrend. It is characterized by a series of higher highs and lower lows, forming a broadening pattern, followed by a narrowing trading range. The same has been identified in daily chart of DALMIASUG Here is a step-by-step breakdown of the Diamond Bottom pattern: Downtrend: The pattern typically starts during a downtrend, where prices are consisteby hardeepssethiUpdated 1
BAJAJ FINSERV LTD Bulish Pattern Head and shoulder Pattern Price:- 1514 Large cap Stock Weakness:-High Debt Strengths :- good Growth Technical Bullish Borker Research Target 1650,1850 Promoter Increase per quarter 0.01% Fill Jun quarter increase 0.16% Dii jun quarter increase 0.14% Longby chart_pattern13
Buy Axis Bank after Breakout Flag & Poll and Fib Extension Buy AxisBank for Target 1032-1091-1166 as Per Fib-Extension & Flag & Poll Longby StockviewPariUpdated 0
Broadening Wedge pattern breakout in GNFCGUJARAT NARAMDA Key highlights: 💡⚡ ✅On 1Day Time Frame Stock Showing Breakout of Broadening Wedge Pattern . ✅Strong Bullish Candlestick Form on this timeframe. ✅It can give movement up to the Breakout target of 705+. ✅Can Go short in this stock by placing a stop loss below 585-. by TradZoo149
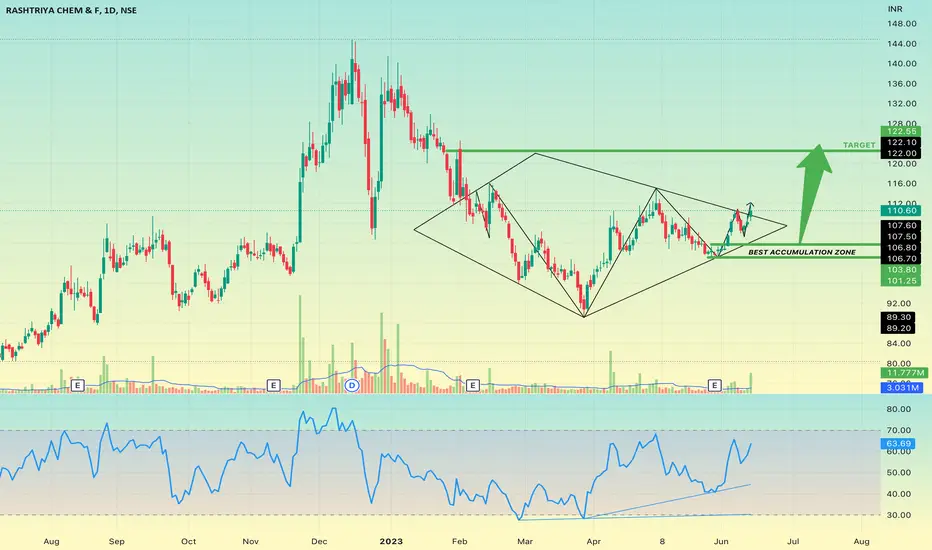
RCF - Continuation Diamond (Bullish)On Daily-Chart of Rashtriya Chemicals & Fertilizers Ltd , a bullish continuation pattern known as a broadening pattern or diamond pattern has been formed. This pattern typically occurs during a downtrend and consists of price movements creating higher highs and lower lows, forming a widening or broadening shape. As the pattern progresses, the range between the highs and lows narrows, indicating a potential consolidation or indecision in the market. However, when the price breaks out above the uby hardeepssethiUpdated 211
HDFCAMC Is Something Cooking ?Hello Friends, From last few weeks HDFCAMC is making some unusual moves which indicates that there's something happening. Around 1900 there's some big buying emerged as we can see on the charts. Currently HDFCAMC is trading on 2498.60 NSE. The pattern is bullish, as the market is witnessing a selling pressure from last many days this particular share is trading on a flat to positive price as visible on charts. One can buy this script for a longer time as well as a trading opportunity. "Stop lossLongby brainvehicle33
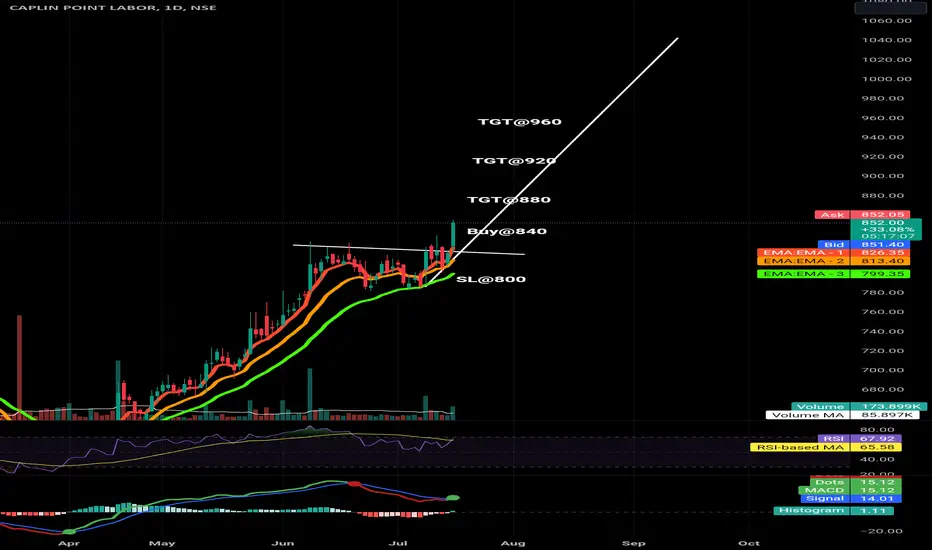
Caplin point Daily flag and pole B/OA bullish flag and pole b/o has been confirmed on daily chart of NSE:CAPLIPOINT . Here one can create a fresh position in the scrip. Buy@840 SL@800 TGT@880/920/960 The risk to reward ratio is 1:3 Exit the position if the stop loss is triggered on DCB. DO YOU WANT ALL MY RESEARCH FOR FREE THEN DON'T FORGET TO FOLLOW ME. I AM EAGERLY WAITING FOR YOUR COMMENTS ON THE STUDY... Disclaimer: Content shared is for information and education purposes only and should not be treated as investment or Longby raigvivekUpdated 658
LONG NIFTYYou can go long in NIFTY if 15 minutes candle closes above last day's high. Disclaimer: I am not a SEBI Reg. Analyst. Please do your own research before trading or investing.Longby amolakchhatwal165
armanfin going bullishthis stock may got a bull run. as trendline support and horizontal support area will not fall it down and may boost it to bull run. exit half on 8 % then trailLongby fariqbUpdated 1
2 Amazing swing trade ideas for 3 August I daily make educational content videos for swing / positional WLong04:25by Apoorv-Dubey_SEBI-RA325
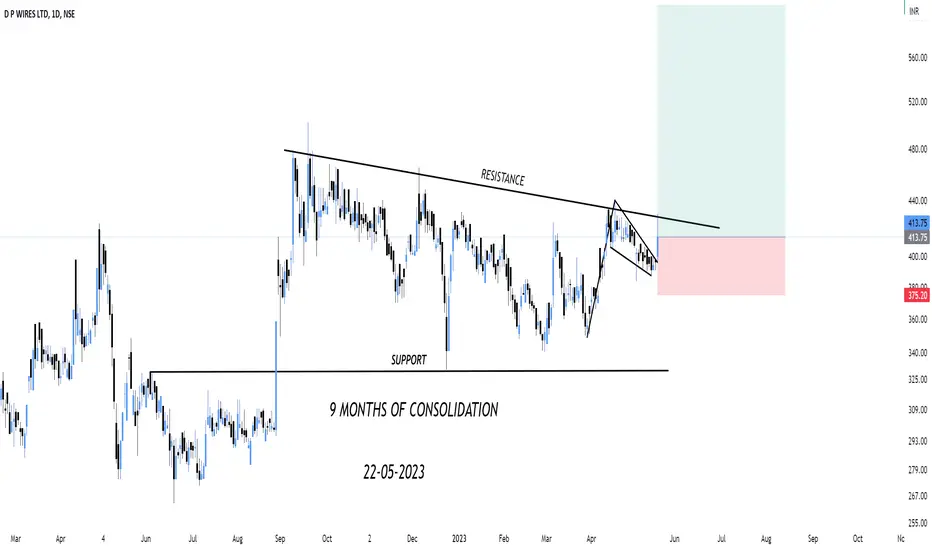
Multiple reasons to get long1. Flag & pole pattern breakout 2. 9 months consolidation 3.Entry before breakout has its own benefitLongby KamalKJoshiUpdated 5
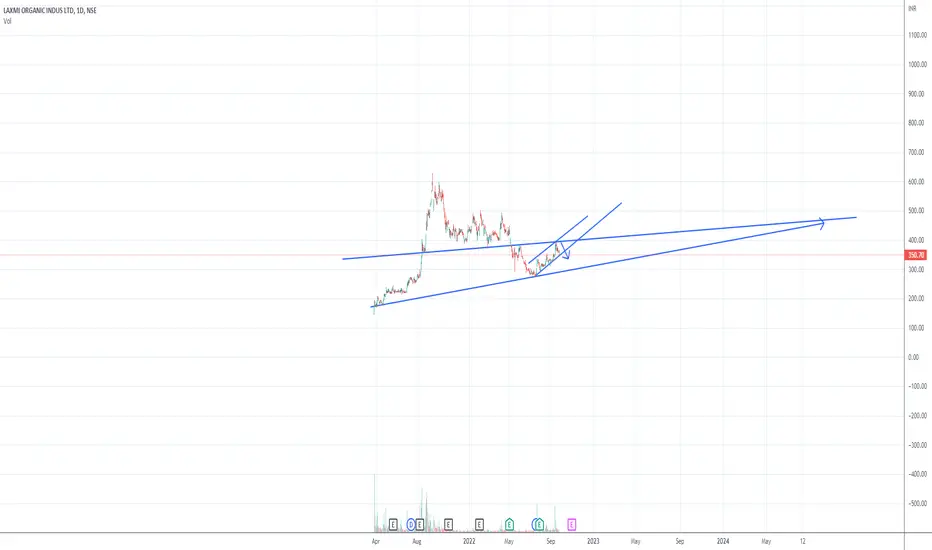
Good company ,Not a good time to add. Wait for SEP QUATER RESULTOk this analysis is my 4rth about LXCHEM from which i made a good return after its IPO DEBUT Had got huge quantity at around 220 INR AND SOLD AT 500 ABOVE . Now as I wanted to reenter the stock , so here's my analysis 1.As the company has been shut for close to a month during sep quarter , the results will get affected . 2.Last quarter results are also not par with June 2021 results and eps are down 3.Will make entry only after results are out and when price come down a bit. 4.The companyShortby MakgoproUpdated 13
A 6000 Day Pattern breakout and 1 More swing idea for 21 July I daily make educational content videos for swing / positional trading Long05:38by Apoorv-Dubey_SEBI-RA529
Diamond Bottom Pattern FormationDaily Chart analysis of MAHINDRA LOGISTICS Mahindra Logistics stock price has reached a point of stabilization and is displaying indications of a potential reversal. Following a period of uncertainty or consolidation, the price has broken out in an upward direction, suggesting a shift in market sentiment. This pattern is known as the Diamond Bottom, which initially forms during a downtrend with a series of higher highs and lower lows. Subsequently, the price range gradually narrows, accompaniby hardeepssethiUpdated 0
Keep Bajaj Electricals in Radar.Bajaj Electricals has been trading in a sideways pattern for the past 10 months, as shown in the chart. In May, it broke out of this pattern and started moving in a upward trend. If we zoom in and look at a smaller time frame, we can see that another sideways pattern has formed within the larger pattern. We have two options: we can wait for the price to break out in multiple time frames, or we can make a smart move by taking a trade when the price retests its support level around 1223. We caby BullishLineUpdated 4
DOTUSDT 🚀 diamond pattern Dot looking bullish Entry Tp sl in chart👍 X20 LongLongby Akshay_GourUpdated 56
HITECH PIPES LTD. is gearing up for Breakout.Stock is accumulating in Symmetrical Triangular pattern in a daily time frame. After consolidation period of 9 months stock has firmed strong upward move with good volume and more likely to break its resistance. If we see RSI, it's also indicating a big momentum is on the way. We will wait till its trend line is broken, if it does and sustains above the Line that would be a trigger. BUY- 78.30 target- 88 Stoploss- 74.20 Caution This is a SmallCap company, that makes it more volatile, So doby BullishLineUpdated 9

 Long
Long
 Long
Long Long
Long Long
Long
 Long
Long Long
Long

 Long
Long Long
Long Long
Long Long
Long Long
Long Short
Short Long
Long

 Long
Long