REFEX - Monthly chart - Retest/Reversal + Flag BreakoutThe analysis is done on monthly TF hence price may take few weeks to few months in order to reach the targets.
Trade setup is explained in image itself.
The above analysis is purely for educational purpose. Traders must do their own study & follow risk management before entering into any trade
Checkout my other ideas to understand how one can earn from stock markets with simple trade setups. Feel Free to comment below this or connect with me for any query or suggestion regarding this stock or
M-pattern
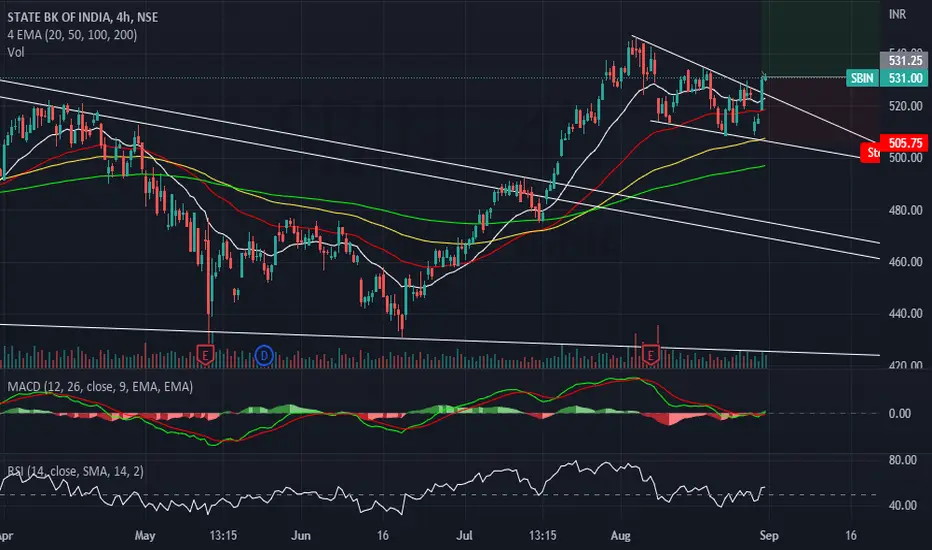
BULLISH on SBINNSE:SBIN
The prices have given the breakout from the flag pattern on the 4 hour charts. Previously the stock gave the breakout from a triangle pattern and after that now made a flag and gave a breakout. The prices are above the moving averages which shows bullishness. The MACD has turned bullish. The RSI is above 50 which shows good momentum. The view is for upto 2 months duration. The Target and SL is on the charts.
Disclaimer : This is my own view and analysis. This is for educational purp
NTPC LTD: Strong BuyNSE:NTPC shows strong buy indicated by RSI, IMI, MACD & Fisher crossover followed by EMA & MA Crossover
Target 2: 175.60
Target 1: 154.90
Stop Loss: 140.50
Disclaimer:
The analysis is only for illustration purposes only. Please consult your financial advisor, agent, broker before acting on any information. We may or may not have positions in the stock and our actions may be contrary to the one mentioned here. This analysis may or may not be updated. We would not be responsible for the pro
Banknifty 1.global sentiment Are not clear for me
2. war was not end
(Chart shows a flag pattern )
(small Up Trend )
1.IF Tomorrow gap up 5 min or 15 min candle if break the resistance 33886 .. if we can see the price action for buying side and exit at the target price 34339
2.If Open in flat wait for the trend up side or downside Or it may have side ways then take the trade
3.if gap down wait For close the 5 min or 15 min candle the crossed 33394 buy and wait for the target
Weekly high and low should
banknifty 1.global sentiment weekly positive
2. war was not end
(Chart shows a breakout )
(small Up Trend )
1.IF Tomorrow gap up 5 min or 15 min candle if break the resistance 33776 .. if we can see the price action for buying side and exit at the target price 34339
2.If Open in flat wait for the trend up side or downside Or it may have side ways then take the trade
3.if gap down cross wait For close the 5 min or 15 min candle the crossed 33389 buy and wait for the target
Weekly high and low sho
Power of Triple Top Chart Pattern
In Dow Jone Index we seen Triple Top formed on hourly time frame and given Breakdown.
After Breakdown seen a huge Fall in index of 7.25% which is the huge Fall for any Index in Market.
Now taking support at 30145 which is trend line at daily timeframe and will try to recover.
NIFTY -- BULLISH CHART PATTERN NIFTY -- HOURLY CHART -- BULLISH CHART PATTERN
1. Recent fall of nifty from high level lower channel seen till 15800 level where nifty form double bottom at 15800 level
2. After double bottom formation nifty at trading at upper channel
3. consecutive support taken at lower level of upper channel has seen where trend follow as uptrend higher top and higher bottom seen
4. recent support taken at lower level of upper channel arround 16200 and last 2 trading session nifty seen bullish up by