BIOCON 1 Week Time Frame 📌 Latest Price Context (as of latest trading session):
• The stock is trading around ₹390–₹392 per share on the National Stock Exchange (NSE).
📊 Weekly Timeframe – Key Support & Resistance Levels
🔹 Immediate Weekly Resistance
1. ₹390–₹395 – short-term resistance cluster near recent highs/resistance zone.
2. ₹396–₹404 – next resistance layer where supply/ceiling has formed recently.
3. ₹410–₹420 – broader resistance zone on higher timeframe.
🔸 Immediate Weekly Support
1. ₹382–₹385 – first
M-pattern
PGEL 1 Day Time Frame 📊 Live/Most Recent Price (Approx)
Current/Last Traded Price: ~₹615 – ₹626 range (varies by source & timing)
Day High: ~₹622 – ₹626 (intraday)
Day Low: ~₹601 – ₹612 (intraday)
These figures reflect today’s price movement and intraday range — not historical closed data. Prices can change throughout the session.
📌 Intraday Key Levels (Today)
These are levels traders commonly watch for support/resistance within a 1-day timeframe (based on recent technicals):
📍 Support
S1: ~₹616 – ₹612
S2: ~₹605
JSWSTEEL 1 Month Time Frame 📌 Current Price Context
Latest price range: ~₹1,230 – ₹1,278 recently traded on NSE.
52-week range: ₹905 (low) – ₹1,264 (high).
📉 Key 1-Month Support Levels
These are zones where price has historically found buying support recently or pivots suggest buyers may step in:
Support 1: ~₹1,236–₹1,240 (near recent intraday pivots and support).
Support 2: ~₹1,222–₹1,230 — stronger base from pivot / volume-based support seen on short term charts.
Support 3: ~₹1,211–₹1,220 — lower support if price c
DEEDEV 1 Week Time Frame 📍 Current Share Price
Approx. ₹272–₹273 per share (latest traded range reported today before/near market close).
Day range seen roughly ₹261–₹288.
📊 1-Week Time Frame Technical Levels (Short-Term Focus)
🚀 Resistance Levels
These are price levels where upward moves may face selling pressure:
R1: ~₹280 – ₹281 (near current range high)
R2: ~₹293 – ₹295 (gap above R1)
R3: ~₹310+ (higher resistance)
🛡️ Support Levels
Short-term price floors below the current price where buying interest may a
DOLPHIN 1 Day Time Frame 📊 Most recent intraday / daily range (approximate):
Today’s high: ~₹460 – ₹471 range
Today’s low: ~₹390 – ₹403 range
Close/latest price region: roughly ₹420 – ₹455 on recent sessions (varies by source)
📈 Daily price action summary:
You’ll typically see significant intraday volatility with swings from the low ~₹390s up to highs in the ~₹460s on some days.
Recent daily price changes have shown both positive and negative moves in the ~±2–8 % range.
📌 Short-term moving average context (approx
HEROMOTOCO 1 Day Time Frame 📈 Current Price & Intraday Range
Current trading price: ~₹ 5,506.5 INR (up slightly from previous close)
Day’s low: ~₹ 5,436.5 INR
Day’s high: ~₹ 5,523.0 INR
Previous close: ~₹ 5,488.5 INR
This gives you the active intraday trading band of roughly:
➡️ ₹ 5,436 – 5,523 so far today (intraday support/resistance range)
📊 Key Levels for the 1-Day Timeframe
Traders often watch pivot/support/resistance levels for day-trading decisions — based on technical levels from live market chart data:
Int
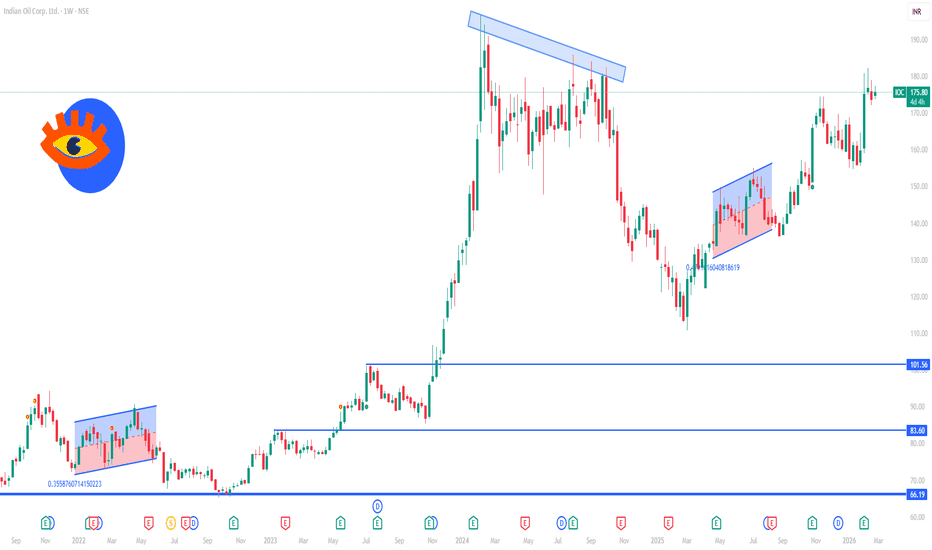
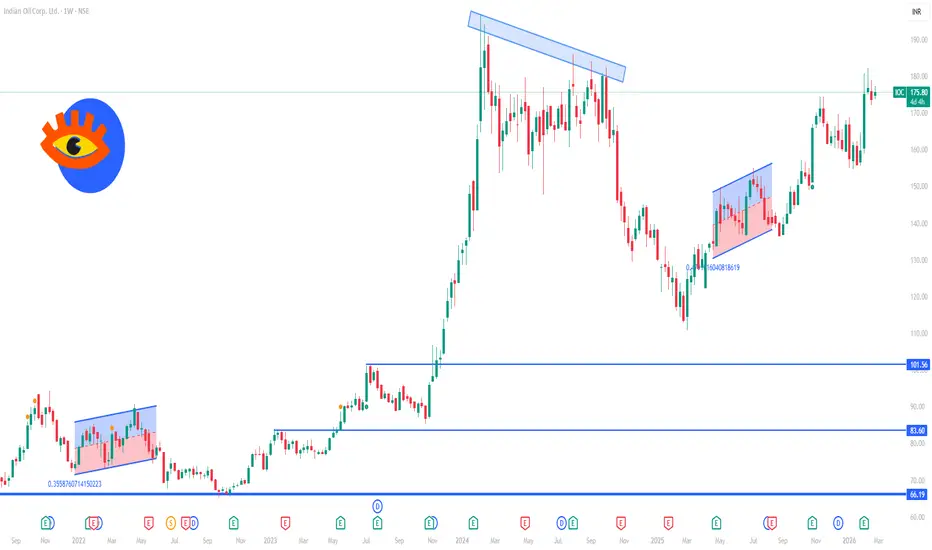
IOC 1 Week Time Frame 📌 Current Price Context (approx): ~₹175–₹176 per share (today’s trading range) — still near the 52-week high zone.
📍 1-Week Technical Levels (Support & Resistance)
🔹 Weekly Pivot & Key Levels
(Weekly pivots capture the balance between buyers & sellers for this week)
• Weekly Support 1 (S1): ~₹170.97–₹171.0
• Weekly Support 2 (S2): ~₹168.16
• Weekly Support 3 (S3): ~₹164.14
• Weekly Pivot (Central): ~₹174.99
• Weekly Resistance 1 (R1): ~₹177.80
• Weekly Resistance 2 (R2): ~₹181.82
• Weekly Res
TITAN 1 Day Time Frame 📊 Current approximate price: ₹4,250 – ₹4,270 (24-Feb-26 session range)
🔁 Daily Pivot & Key Levels (1-day)
Pivot Point (PP): ~₹4,230 – ₹4,260
Resistance Levels:
R1: ~₹4,260 – ₹4,276
R2: ~₹4,281 – ₹4,287
R3: ~₹4,310 – ₹4,347
Support Levels:
S1: ~₹4,155 – ₹4,172
S2: ~₹4,130 – ₹4,140 (below S1, potential next support)
S3: ~₹4,090 – ₹4,100 (deeper intraday support)
💡 In simple terms:
Above the pivot point → bias toward short-term upside toward the resistance zones.
Below the pivot → selling pres
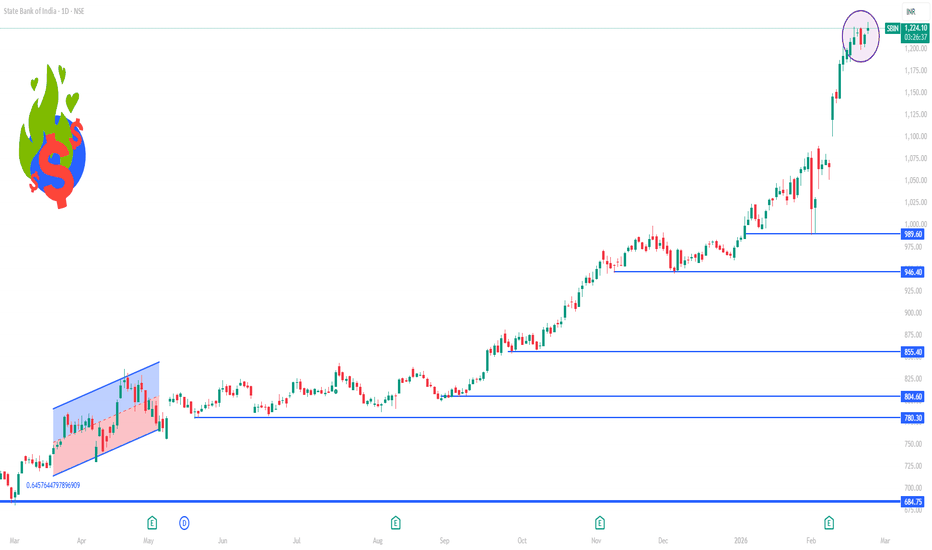
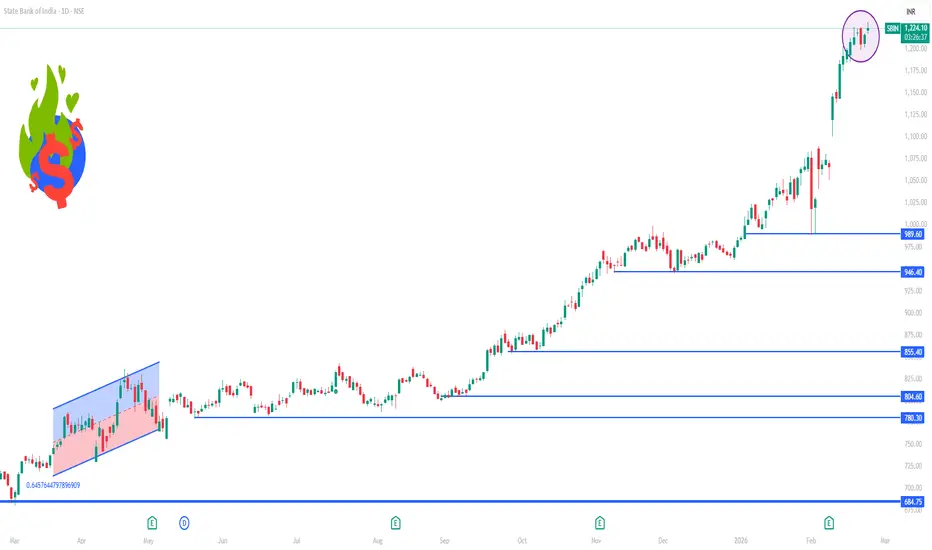
SBIN 1 Day Time Frame📊 Current price context
• SBIN is trading above ₹1,220 on the NSE recently (close to 52-week high).
📈 Daily Technical Levels (1D)
🔹 Resistance Levels
R1: ~₹1,221 – ₹1,222
R2: ~₹1,235 – ₹1,236
R3: ~₹1,245 – ₹1,247
🔹 Pivot
Pivot: ~₹1,210 – ₹1,211
🔹 Support Levels
S1: ~₹1,196 – ₹1,197
S2: ~₹1,185 – ₹1,186
S3: ~₹1,170 – ₹1,171
👉 These pivot and S/R levels are typical daily pivot point calculations used by traders to assess intraday directional bias and potential reversal zones.
🧠 How to Use Th
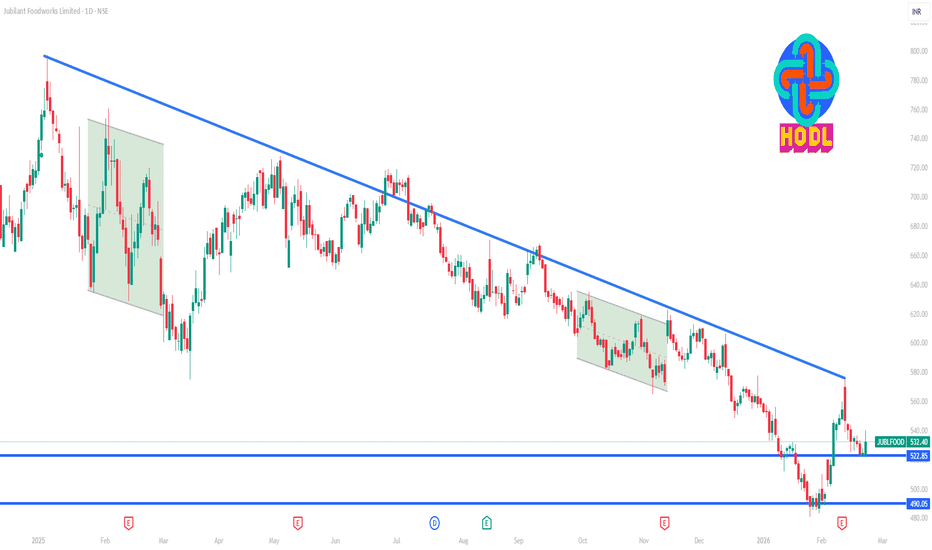
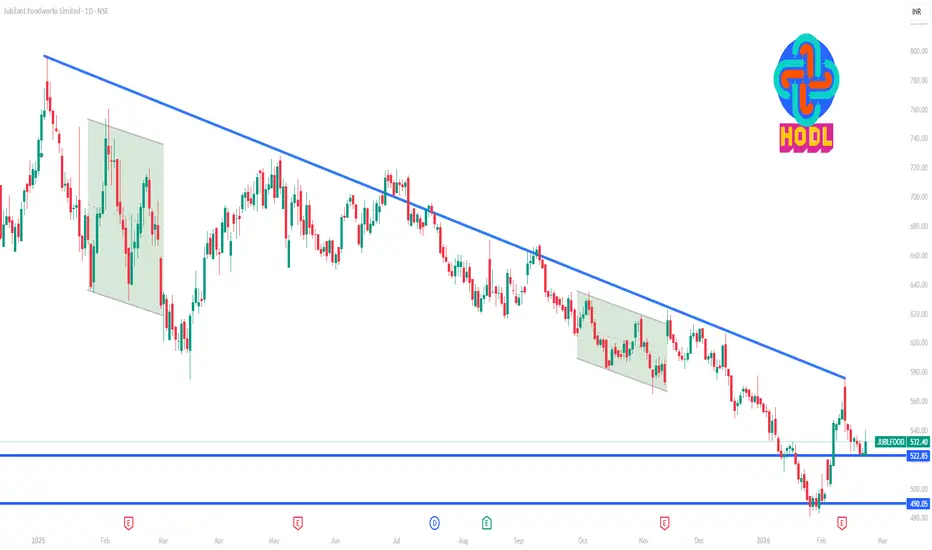
JUBLFOOD 1 Day Time Frame 📍 Current Price (latest available): ~₹532 – ₹533 per share (close of recent session / intraday range) on the NSE/BSE.
📊 1-Day Key Technical Levels (Support & Resistance)
These levels are used by intraday traders for entry/re-entry, pullbacks, and breakout decisions:
🔹 Pivot (Central reference level):
• ₹540 – ₹541 — daily pivot zone (trend reference)
🔸 Resistance Levels (Upside barriers):
1️⃣ R1 ~ ₹540 – ₹541 (near pivot/high point)
2️⃣ R2 ~ ₹551 – ₹552
3️⃣ R3 ~ ₹557 – ₹558
-- Price may tes
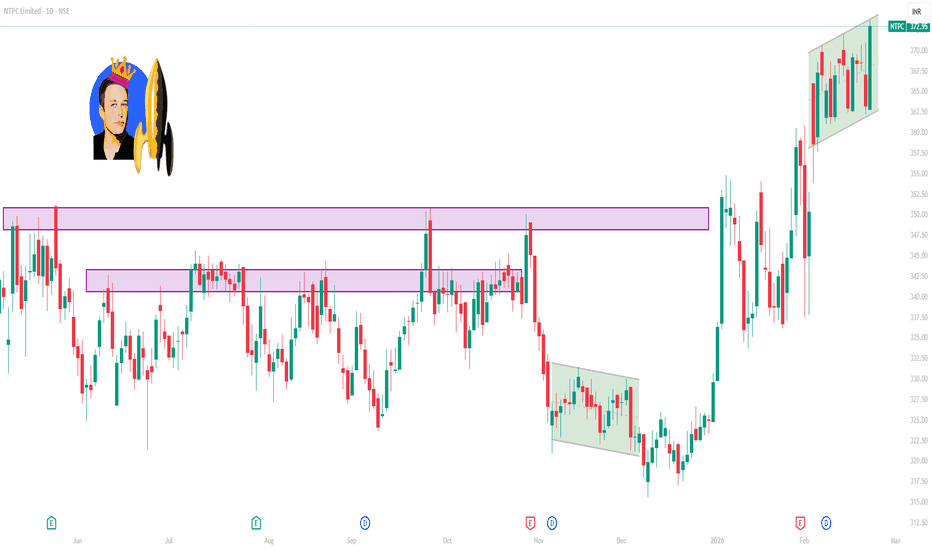
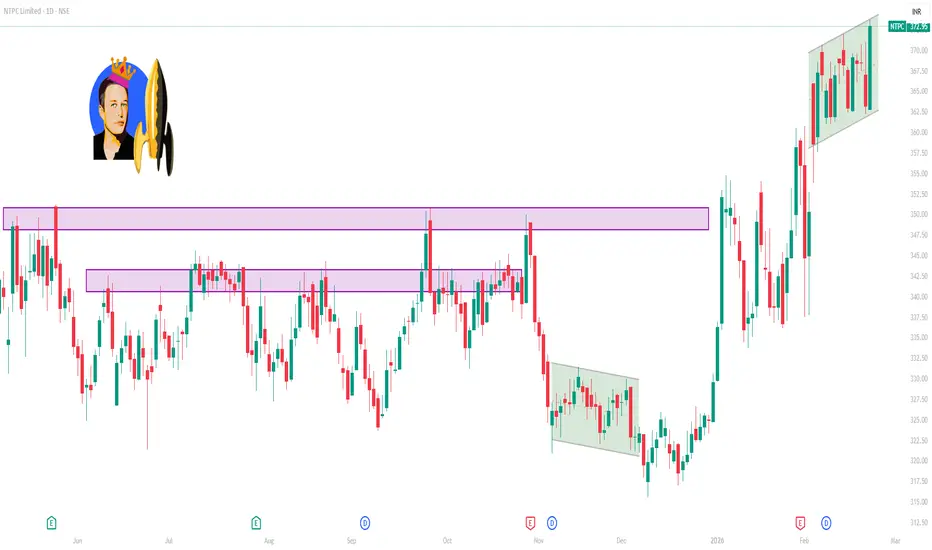
NTPC 1 Day Time Frame 📌 Current Price Snapshot (Latest Market Data)
📈 NTPC’s share price has recently been trading around ₹372–₹374 on the NSE, continuing strength after recent gains and hitting near 52-week highs.
📊 Daily (1D) Technical Levels
These are derived from standard pivot point calculations and intraday technical data:
🔹 Pivot / Reference
• Daily Pivot: ~₹368.76 (central level where trading bias shifts)
🔸 Resistance Levels (Upside Targets)
R1: ~₹370.13
R2: ~₹372.01
R3: ~₹373.38 — near recent price
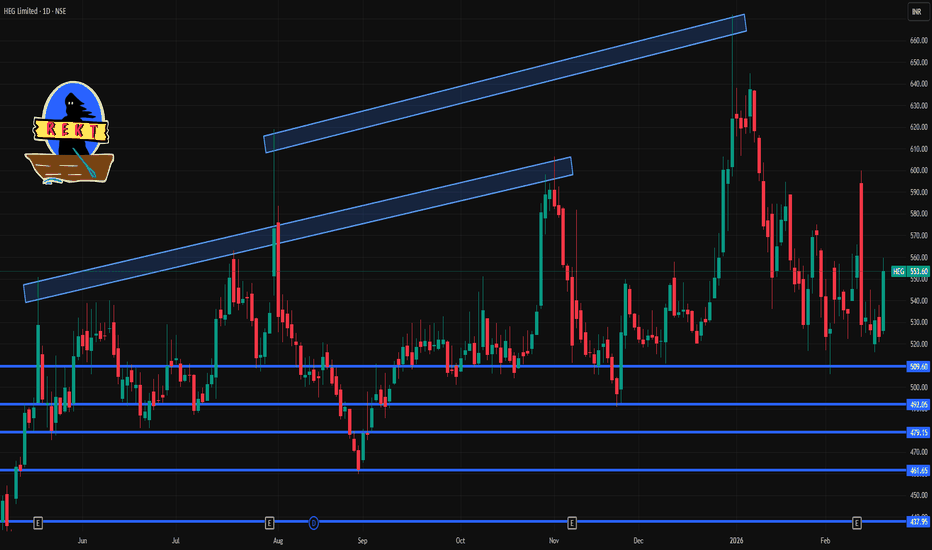
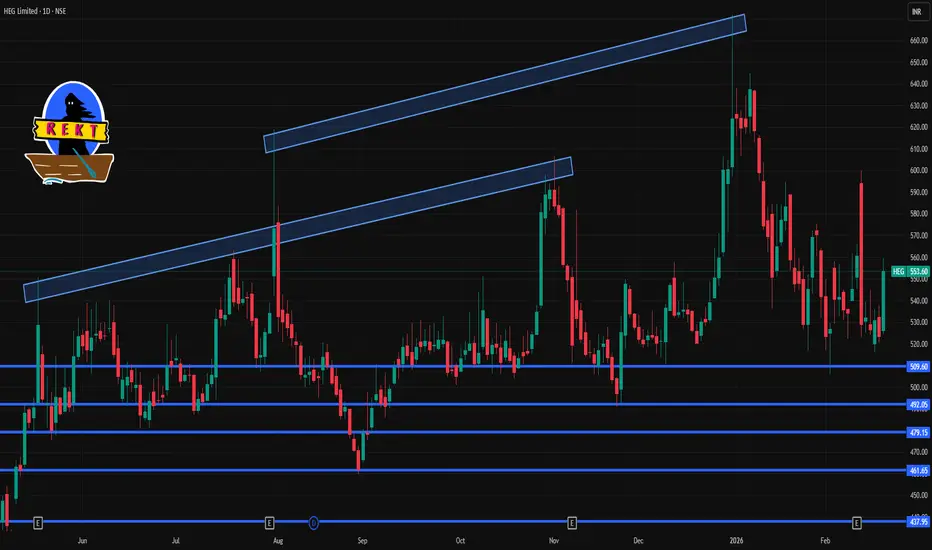
HEG 1 Day Time Frame 📊 Live Price Action Snapshot (latest)
Last traded range today: ~₹524.45 – ₹554.70 on NSE.
HEG has recently rallied on promoter buying news, lifting price toward higher intraday levels.
Overall RSI near mid-range (~42) suggests no extreme over-bought yet.
📌 Intraday Trading Guide
🟢 Bullish Scenario
If price holds above ₹540–₹547 early session → target ₹559+
Breakout on heavy volume increases likelihood of higher targets
🔴 Bearish Scenario
Failure to hold ₹519 → likely drift toward ₹507, then ₹
ETERNAL 1 Week Time Frame 📌 Current Context
Stock is trading around ₹275–₹285 range recently after weakening from higher levels.
Recent weekly action shows pressure near resistances and price dipping, indicating short-term weakness.
📊 WEEKLY Support Levels
These are key price zones on the weekly chart where the stock might find buyers:
🔹 ₹270–₹275 — Important near-term weekly support — previous consolidation area.
🔹 ₹260–₹265 — Secondary support cluster — historically a demand zone.
🔹 ₹245–₹250 — Major deeper support —
OLA Electric Mobility Limited 1 Week Time Frame 📉 Current Price Context
The stock recently traded around ₹28–₹30 range on NSE/BSE, having slid sharply amid weak sentiment and brokerage downgrades.
It has been near 52-week lows (~₹30-₹31) recently.
Daily technical indicators show bearish momentum and oversold conditions on RSI.
📊 1-Week Time Frame Levels (Short-Term Trading)
🔴 Immediate Resistance (Upside)
R1: ~ ₹29.50–₹30.40 – short-term price reaction zone.
R2: ~ ₹30.80–₹31.40 – near prior pivot areas.
R3: ~ ₹31.90–₹32.4
MPHASIS 1 Day Time Frame 📊 Daily Price & Range (Latest session)
• Mphasis has been trading roughly between about ₹2,438–₹2,501 intraday range in recent sessions. Current reference prices are in the ~₹2,450–₹2,510 zone.
📌 Daily Pivot & Levels (Classic / Pivot based)
Pivot Point: ~ ₹2,659
Upside Resistance (1D):
• R1: ~₹2,693
• R2: ~₹2,738
• R3: ~₹2,772
Downside Support (1D):
• S1: ~₹2,614
• S2: ~₹2,580
• S3: ~₹2,535**
(pivot based levels may vary slightly daily based on prior price range)
These pivots are calculated
NATCOPHARM 1 Month Time Frame 📊 Current & 1-Month Price Context
Over the past month the stock has traded roughly between ₹806 – ₹894 on the NSE, with observed closes in that range.
Recent prices have been volatile but staying within this ~₹800–₹900 band.
🔹 Near-Term Support Levels (1-Month Focus)
Key support zones you might watch:
₹806 – ₹810 — recent 1-month low area / first major floor.
₹817 – ₹821 — short-term pivot support and lower boundary of consolidation.
₹840 – ₹850 — mid-range support that has acted as a buf
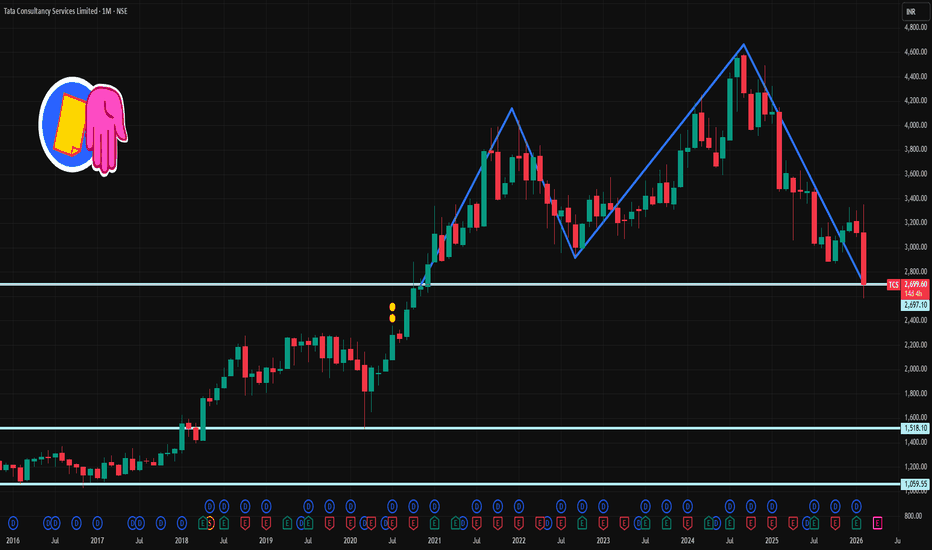
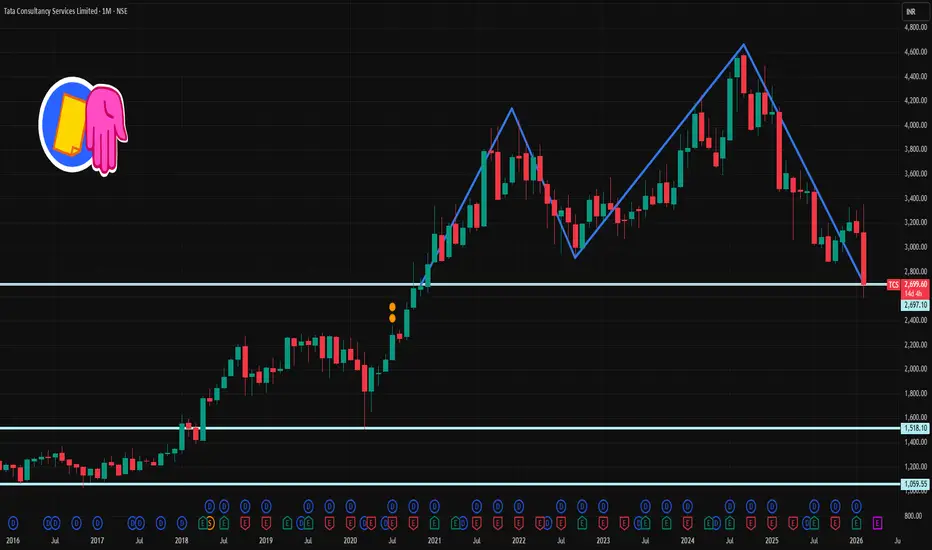
TCS 1 Month Time Frame 📌 Approx Current Price (Feb 2026)
• TCS price recently traded around ₹2,700–₹2,950 on NSE.
📉 Important 1-Month Levels — Support (Buy Zones)
• S1 ~ ₹2,910–₹2,915 — first support & pivot area.
• S2 ~ ₹2,880–₹2,880 — secondary support (near recent lows).
• S3 ~ ₹2,840–₹2,850 — deeper support zone if momentum weakens.
• Year-to-date low ~ ₹2,867–₹2,880 — structural weekly support.
📈 Important 1-Month Levels — Resistance (Sell Zones)
• R1 ~ ₹2,980–₹3,000 — first key resistance/pivot rejection zon
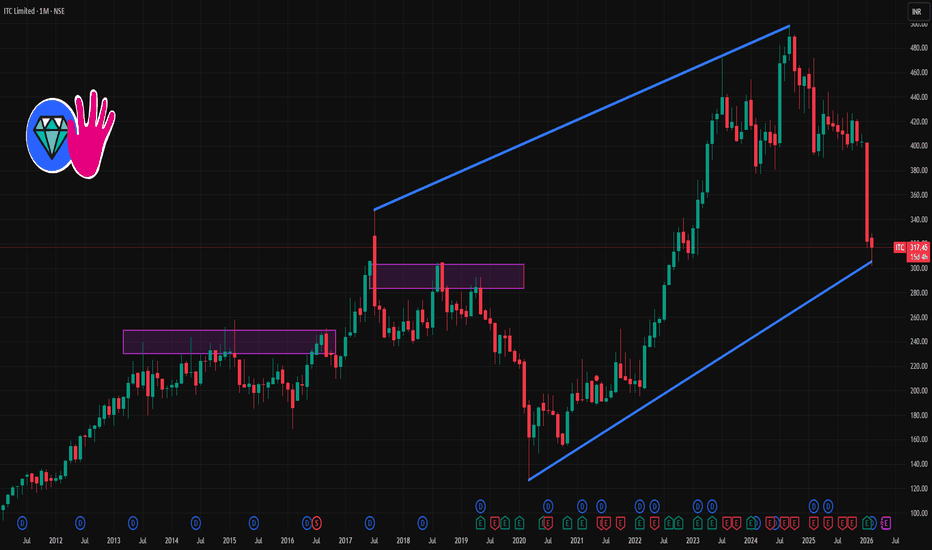
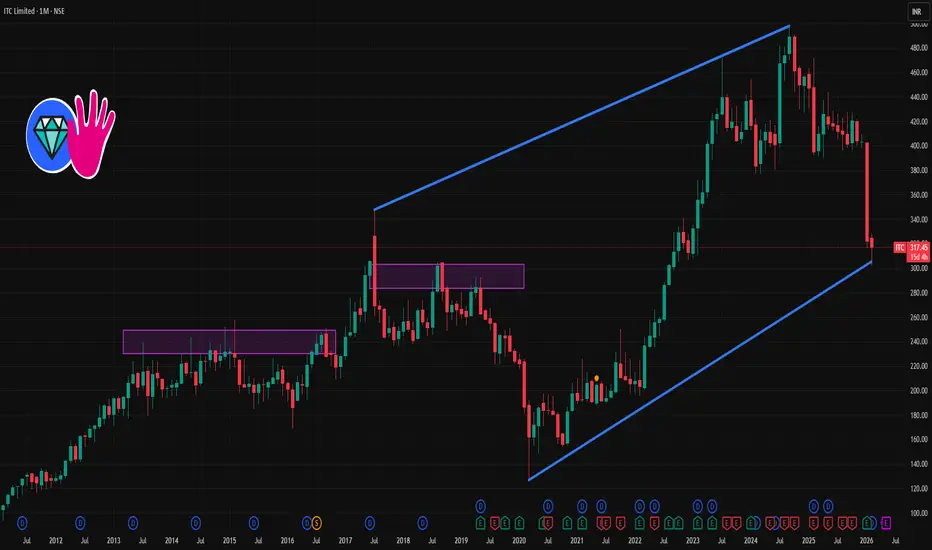
ITC 1 Month Time Frame 📌 Latest price context (today):
• Current stock price: ~₹317–₹320 range.
• RSI indicates weakness but oversold conditions.
📊 1-Month Support & Resistance Levels
🔵 Resistance Levels (Upside)
Short-term pullback levels where bears may push back:
1. R1: ~₹321–₹322
2. R2: ~₹324–₹325
3. R3: ~₹327–₹328
(These are near recent intra-day pivots and pivot extensions.)
👉 Above ₹328–₹330, the next range of interest becomes ₹335–₹340 (short-term supply zone from recent range).
🟢 Support Levels (Downside)
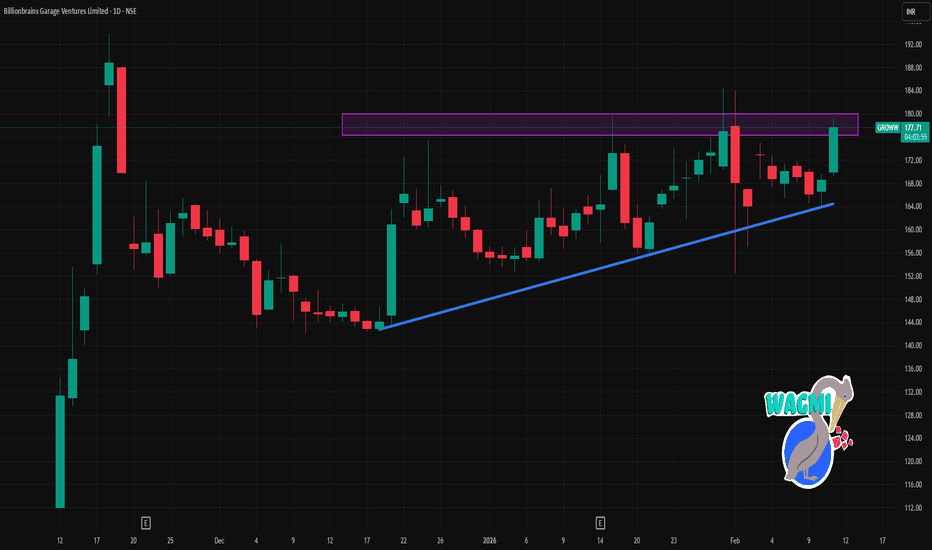
GROWW 1 Day Time Frame 📈 Daily Timeframe — Key Levels
🔁 Daily Pivot (Trend Reference)
Pivot Point (Daily): ~₹171.39 — central equilibrium price for the day. Above this suggests near-term strength; below suggests weakness.
🟢 Resistance Levels (Upside Barriers)
R1 ~ ₹175–₹176 — first resistance from pivot-based calculation.
R2 ~ ₹178–₹180 — higher resistance zone for continuation.
R3 ~ ₹203–₹235 — long-term structural resistance (classic pivot range).
👉 A clear daily close above ~₹176–₹178 would signal a stronger
CRUDEOIL 1HR SIDEWAYS DOWNTREND Crudeoil update
Oil prices slipped a 110+ points because traders are adjusting their positions after recent news.
On the one hand, talks between the U.S. and Iran last Friday showed some willingness to continue diplomacy, which reduced immediate fears of a U.S. military strike. That calmed the market, leading to mild selling in oil. On the other hand, Iran has not agreed to stop enriching nuclear fuel and has warned it could launch missile attacks across the Middle East if the U.S. attacks. S
Symmetrical Triangle Masterpiece : Multi-Layout W,DtfStep into this dynamic multi-layout window opened right in front of you—a split-screen showcase of pure price action artistry.
Left Side: Weekly Timeframe
Here, a symmetrical triangle (a classic continuation or reversal pattern formed by two converging trendlines of equal slope) takes center stage. Framing it are a green uptrend line (connecting higher lows for bullish structure) and a red downtrend line (linking lower highs for bearish pressure), creating a tightening coil of market indecision
INFIBEAM 1 Week Time Frame 📌 Current Price Snapshot
📍 Latest traded price: ₹16.25 – ₹16.30 approx. (last session)
📈 52-week range: ₹13.63 (low) – ₹22.02 (high)
📊 Near-Term 1-Week Technical Levels
🔰 Pivot Point (Reference)
Pivot: ~₹15.6 – ₹15.7 (neutral zone for short-term bias)
🛑 Resistance (Upside Targets)
These are levels where price may face selling pressure this week:
Level Mark (Approx) Notes
R1 ~₹15.8 – ₹16.0 First hurdle near current action zone
R2 ₹16.3 – ₹16.4 Key near-term resistance — breakout above this
SAMMAANCAP 1 Month Time Frame 📈 Current Snapshot (as reference)
Last traded / recent price around ~₹147 – ₹151 on NSE (varies with intraday moves).
52‑week range: ~₹97 – ₹192.9.
🔑 1‑Month Key Levels – NSE Pivot, Support & Resistance
Monthly Pivot Levels (short‑term framework):
These come from pivot analysis that captures intermediate trend areas over the past sessions — useful for 1‑month traders.
📍 Pivot Reference (Monthly)
Pivot (central reference): ~₹146‑₹147
This is the main gravity level — above it suggests bullish
CREDITACC 1 Week Time Frame 📌 Current Price Context (21 Jan 2026)
Approx current price: ~₹1,330 – ₹1,370 on NSE as of recent trading session.
📊 Weekly Technical Levels (1-Week Timeframe)
These levels are derived from recent weekly pivot analysis (reflecting highs/lows and average weekly trend):
Weekly Pivot Point: ~ ₹1,300 – ₹1,305
Weekly Resistance Levels:
R1: ~ ₹1,325 – ₹1,330
R2: ~ ₹1,350 – ₹1,360
R3: ~ ₹1,375+
Weekly Support Levels:
S1: ~ ₹1,275 – ₹1,280
S2: ~ ₹1,250 – ₹1,255
S3: ~ ₹1,225 – ₹1,220
(Classi