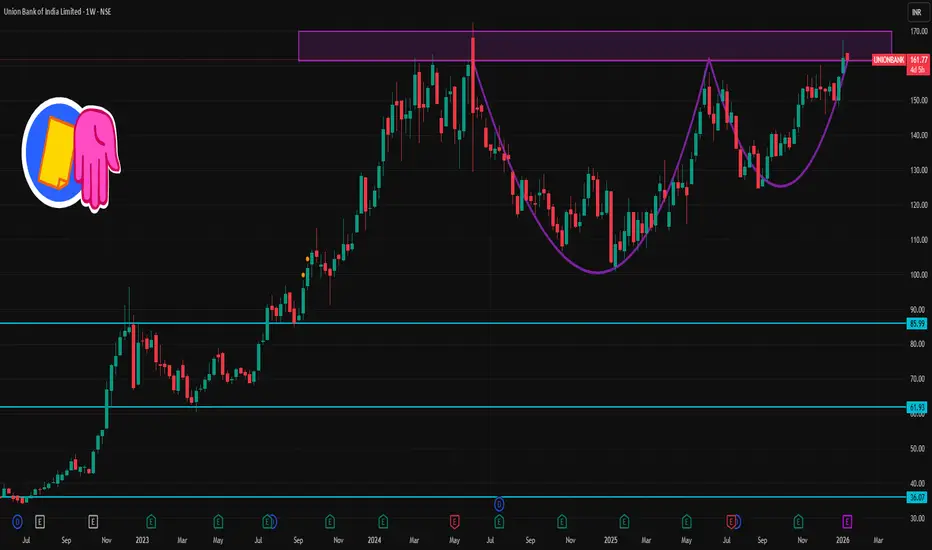
UNIONBANK 1 Week Time Frame ๐ Current Price (Weekly Context)
~โน162โฏโโฏโน163 per share (latest live/NSE quote).
๐ Weekly Support & Resistance Zones (Approx)
Resistance Levels (Upside)
These are key levels to watch if the weekly price continues uptrend:
โข R1 โ โน167โโน168 โ immediate resistance near recent 52โweek high.
โข R2 โ โน170โโน172 โ near psychological/upper range targets.
โข R3 โ โน175+ โ extended zone if momentum accelerates (trend continuation).
Support Levels (Downside)
Important weekly support levels where pullbacks
M-pattern
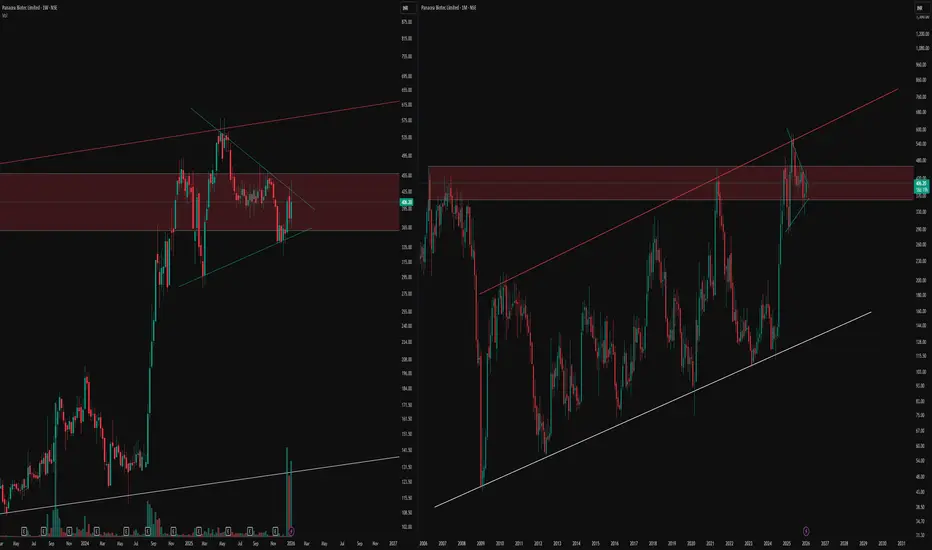
Multi-Timeframe Channel Mastery UnveiledTradingView's multi-window layout reveals pristine price action across weekly and monthly charts, highlighting structural precision without forecasts.
Both timeframes demonstrate unwavering respect for key lines and zones, underscoring market geometry's reliability.
Monthly Chart Insights
The right-side monthly view features a robust supply zone where sellers dominate, enforcing repeated rejections with textbook accuracy. A white trend line provides dynamic support, paired with the red paralle
Weekly Timeframe Price Action MasteryObserve the red supply zone where price consistently faces resistance, halting upward moves with precision. The green demand zone, formed after a decisive breakout from prior resistance, now acts as robust support for subsequent bounces. The white counter trend line serves as the pattern's key action line, guiding price movements with remarkable adherence across multiple tests.
Zone Dynamics
Supply zones in red mark areas of overhead selling pressure on weekly charts, often leading to rejection
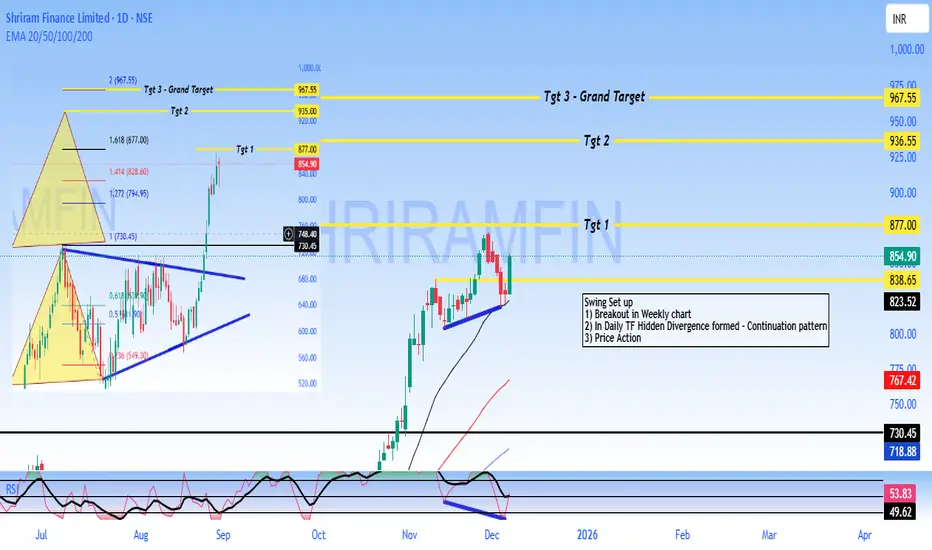
SHRIRAM - Buy - SwingTrading #Shriram Finance Limited - #Technical Analysis
Price: 854.90
#Technical Setup
Pattern: Continuation pattern with bullish hidden divergence following weekly breakout
Key Levels:
- Target 1: 877.00
- Target 2: 936.55
- Target 3: 967.55
- Support: 838 - 825 (critical)
- Major Support: 730.45
#Outlook
The chart shows a swing trading setup with upside potential toward 877 - 967 if support at 838 holds. A break below 825 would invalidate the bullish structure.
DISCLAIMER
This is NOT investm
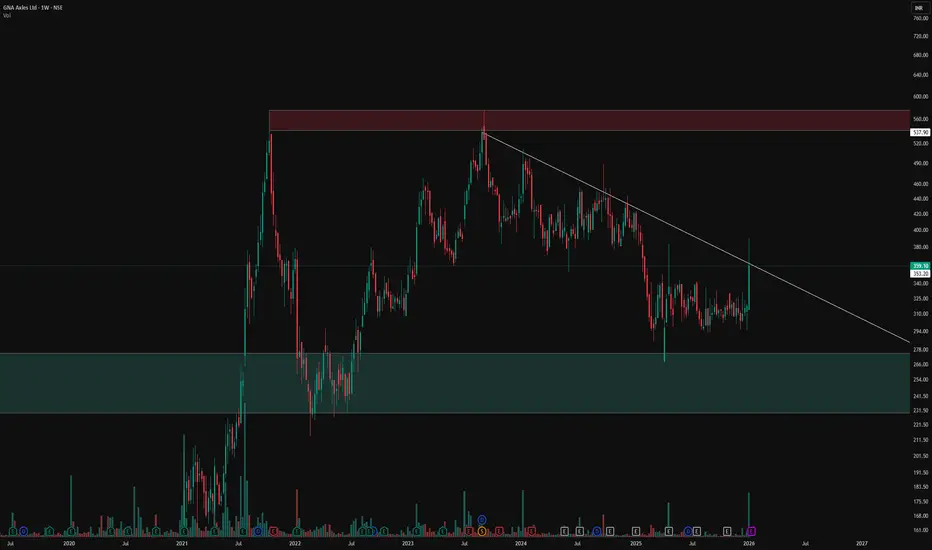
Classic Descending Channel With Clear Structural LevelsThe primary feature of this chart is the broad descending parallel channel marked by the orange lines, which frames the entire corrective phase in a neat, orderly manner. Price has repeatedly respected both the upper and lower boundaries, reinforcing the relevance of this channel as a dominant structure.โ
A trendโchanging resistance line is drawn in white, connecting swing highs and visually separating the prevailing downtrend from any potential shift in behavior. This line serves as a clear re
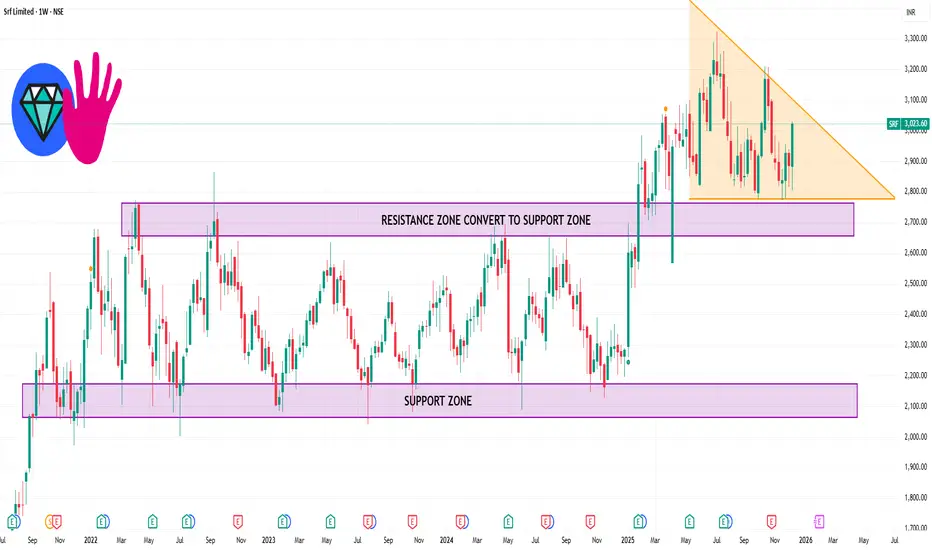
SRF 1 Week Timw Frame ๐ Current Price Context (as of latest close):
โข SRF was trading around โน3,023โโน3,024 recently.
๐ Weekly / Short-Term Key Levels
๐ Resistance Levels
These are possible upside targets where price may face supply pressure:
R1 (Immediate resistance): ~โน2,971โโน2,990 โ key level to break for near-term upside.
R2: ~โน3,007โโน3,031 โ next hurdle after R1.
R3 / Higher Resistances: ~โน3,060โโน3,100+ zones if momentum continues.
A close above โน3,000โโน3,030 on the weekly chart often signals s
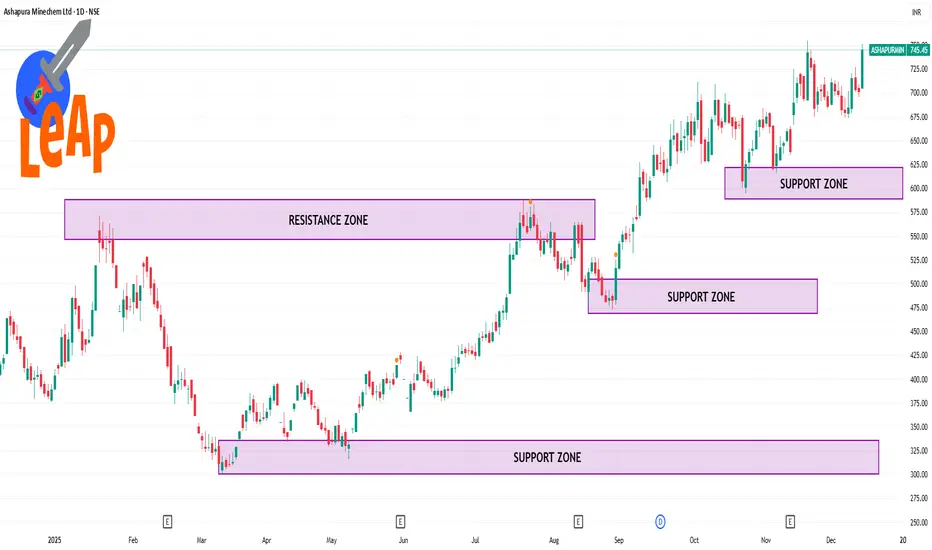
ASHAPURMIN 1 Day Time Frame ๐ Current Live Price (Daily)
Approx โน745.4 on NSE at latest available update.
This reflects the recent trading session where the stock moved between ~โน705 (low) and ~โน751 (high) before settling near โน745.45.
๐ Daily Technical Levels (Pivot / Support / Resistance)
๐น Pivot Point Levels (based on yesterdayโs range)
(These can be used for todayโs intraday bias)
Daily Pivot: ~โน733.8
Support 1: ~ โน716.6
Support 2: ~ โน687.8
Support 3: ~ โน670.6
Resistance 1: ~ โน762.6
Resis
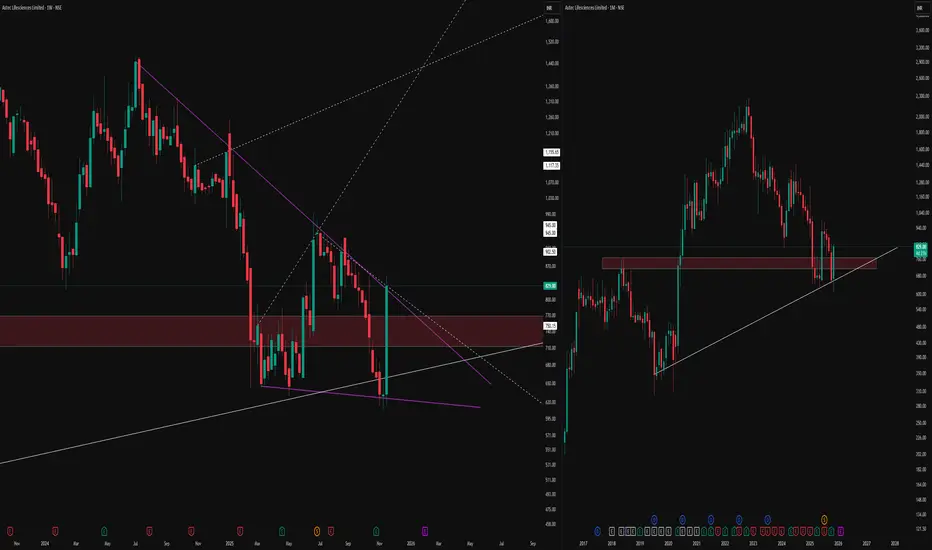
How to Observe Weekly and Monthly Chart StructureThe weekly (left) and monthly (right) timeframes, bringing attention to a confluence zone of technical interest.
On the weekly chart, price has developed a compressing pattern, defined by distinct purple lines, with dotted lines marking hidden channel boundaries and long-term levels for context. The highlighted supply-demand zone reflects previous market activity, where buyers and sellers actively shaped reversals and consolidations.
On the monthly timeframe, the same zone aligns with an estab
Inverted Head and Shoulders - Bullish Setup๐ Overview
The Inverted Head & Shoulders is a bullish reversal pattern that forms after a downtrend.
It signals that selling pressure is weakening and buyers are gradually gaining control.
The structure has three major lows: Left Shoulder, Head (deepest low), and Right Shoulder โ followed by a breakout above the Neckline, confirming a trend shift to the upside.
โโโโโโโโโโโโโโโโโโโโโโโโโโโโโโโโโโโโโโโโโโ
๐ How the Pattern Forms
1๏ธโฃ Left Shoulder
โข Price creates a swing low, then
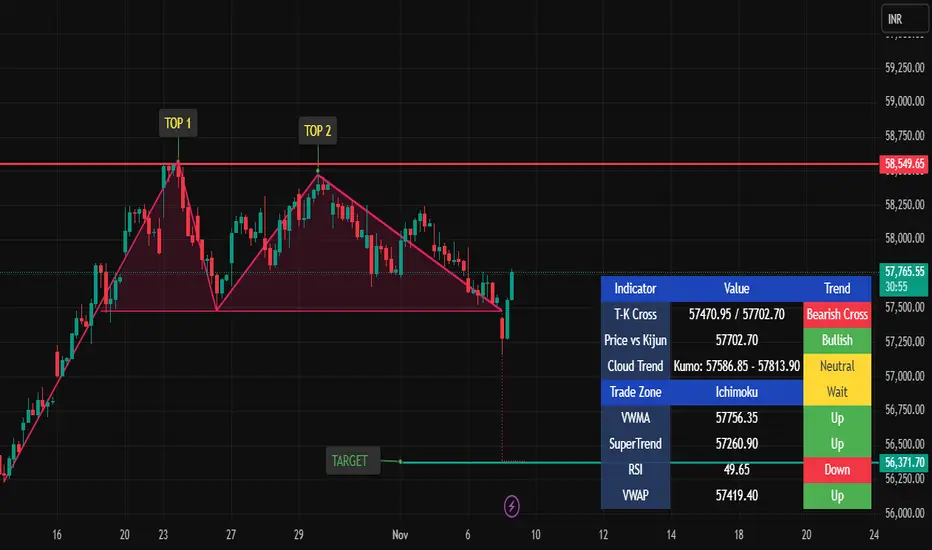
Bank Nifty โ Double Top Pattern Analysis๐ Bank Nifty โ Double Top Breakdown: Initiate Sell Signal
The chart confirms a Double Top pattern on Bank Nifty, signaling a bearish reversal from the recent highs near โน58,550. Both peaks faced strong rejection at this resistance, reflecting weakening bullish momentum.
๐น Sell Signal Trigger:
Initiate short positions once Bank Nifty breaks and closes below โน57,480 (neckline support).
This breakdown confirms pattern completion and potential start of a downward move.
๐ Trade Setup
Stop Loss: โน
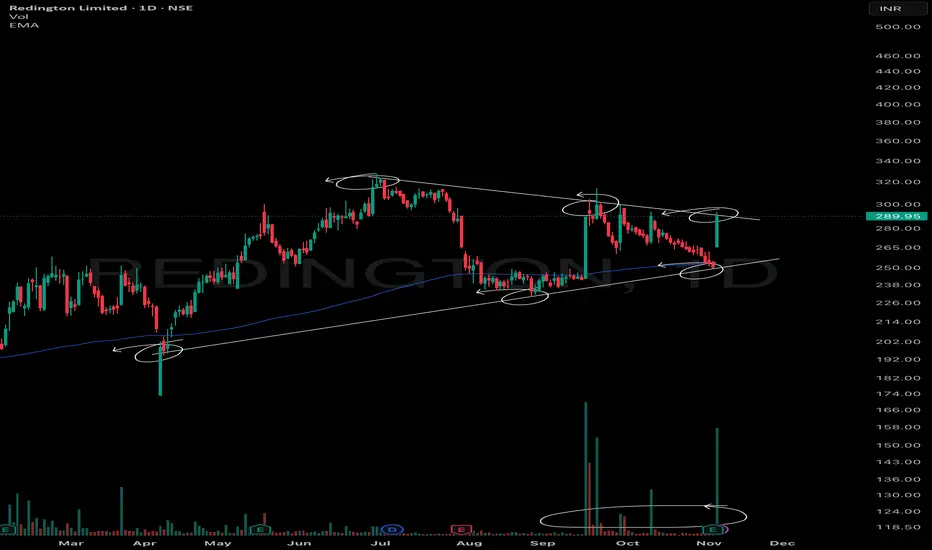
VCP Formation within Symmetrical Triangle above 200 EMAThis chart displays a Volatility Contraction Pattern (VCP) developing within a classic symmetrical triangle on the daily timeframe. Two sharply converging trendlines encapsulate the price action with the lower line connecting a series of higher lows (the trendline) and the upper line linking lower highs (counter trendline). Such convergence is characteristic of symmetrical triangles, which represent a period of price consolidation and equilibrium between buyers and sellers.
Volume tends to cont
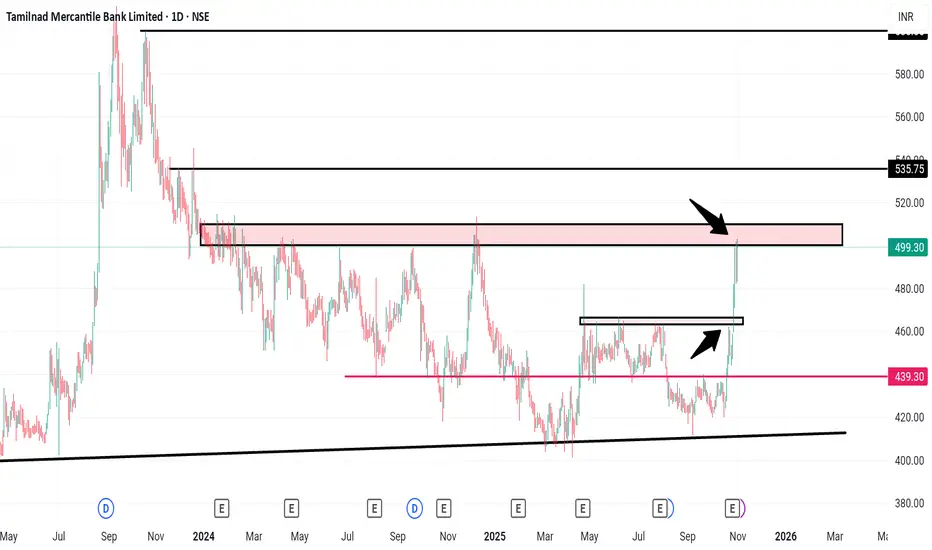
Tamilnad Mercantile Bank โ 1D Chart | Strong Resistance Zone๐ข Tamilnad Mercantile Bank (TMB) โ 1D Chart | Strong Resistance Zone Ahead
๐ Chart Setup:
TMB is testing its major 1-year resistance zone around โน510, a key level that has capped price movements for months. A strong daily close above โน510 could trigger momentum towards higher targets.
๐น Resistance: โน510 (Major 1-year resistance)
๐น Targets on Breakout: โน535 / โน600
๐น Supports: โน466 / โน440
๐น View: Price consolidating near breakout zone. Sustained close above โน510 can signal trend continuation.
๐ฆ
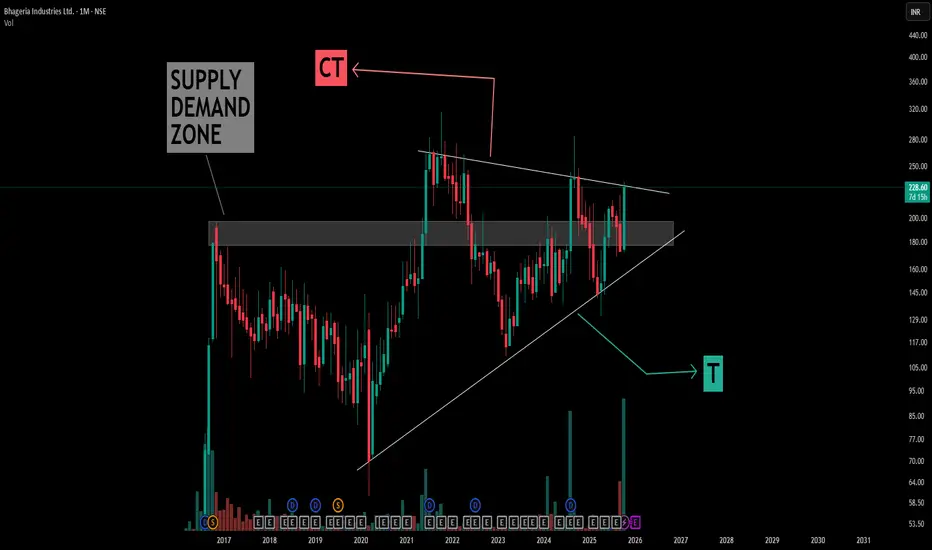
Understanding Symmetrical Triangle Patterns in depthThis chart illustrates a classic example of a symmetrical triangle pattern formed over several years, with simple compression trendline (CT) and trigger (T) lines drawn in white for clarity.
Key learning points from the structure:
- Symmetrical Triangle Formation: The pattern is defined by converging trendlines representing successive lower highs and higher lows, indicating a period of price consolidation and market indecision
- Supply Converts to Demand: The boxed area initially acted as suppl
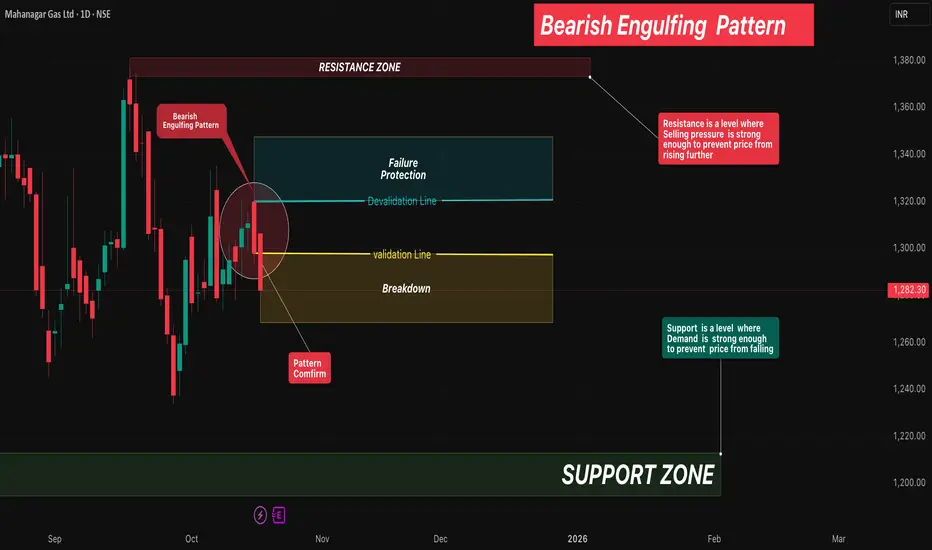
Bearish Engulfing Pattern๐ Overview
The Bearish Engulfing Pattern is a strong two-candle reversal formation that signals a potential shift from an uptrend to a downtrend.
It occurs when a small bullish (green) candle is immediately followed by a large bearish (red) candle that completely engulfs the prior candleโs body.
This shows a clear shift in market psychology โ buyers initially push the price higher, but sellers step in with force and erase those gains, marking the start of bearish momentum.
_________
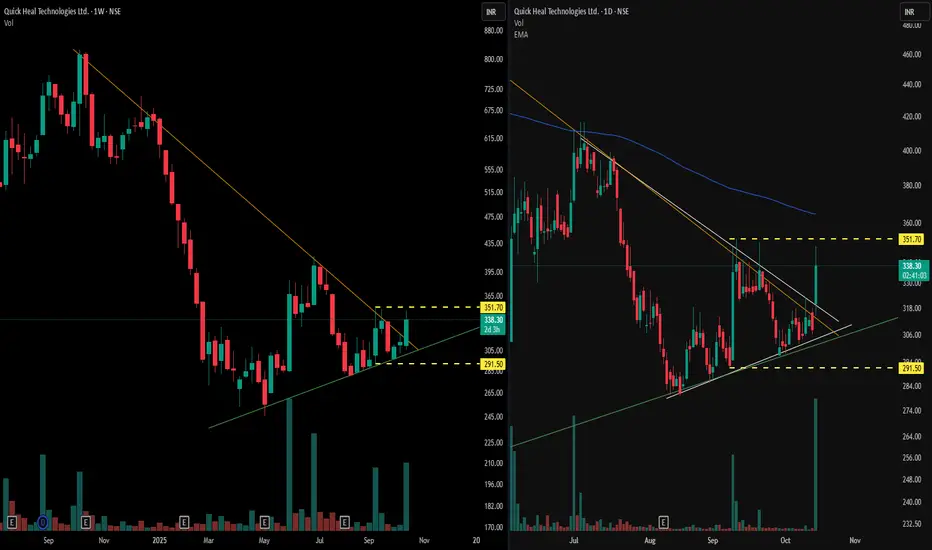
Multi-Timeframe VCP Observations๐ Weekly Time Frame Observations (left panel)
- It displays a visible pattern contraction structure, specifically a Volatility Contraction Pattern (VCP), formed over multiple months
- An orange trendline marking the descending resistance, and a green line depicting the rising support, which together highlight the range contraction of price
- Volume spikes coincide with specific price responses at these zones, denoting heightened activity during volatility periods within the VCP
๐ Daily Time Fr
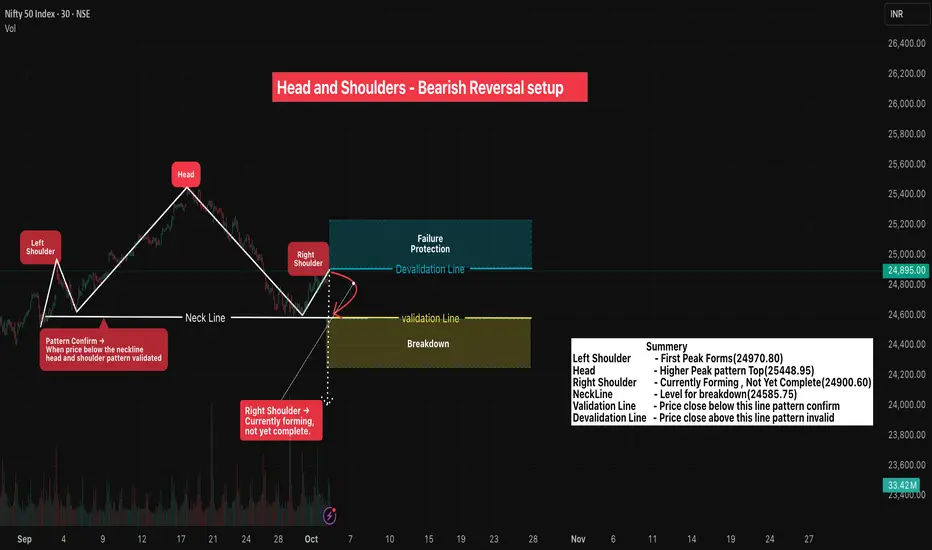
Head and Shoulders - Bearish Reversal Setup๐Overview
The Head and Shoulders Pattern is a classic bearish reversal formation that signals a potential change in trend from uptrend to downtrend .
It is formed by three peaks:
- Left Shoulder โ Price rises, forms a peak, then retraces.
- Head โ Price moves higher than the left shoulder, creating the tallest peak, then falls back.
- Right Shoulder โ Price rises again but fails to surpass the head, showing loss of momentum.
- Neckline โ A line drawn through the two troug
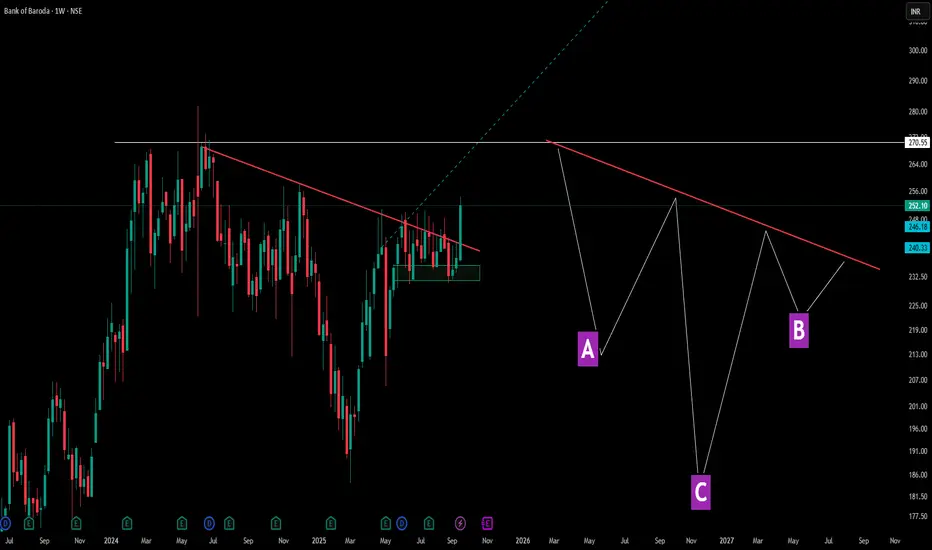
Decoding Angled Necklines in Inverted Head & ShouldersThis chart showcases a perfect example of how inverted head and shoulders patterns don't always follow textbook formations. Points A and B represent the shoulders, while C forms the deeper headโbut notice the crucial difference: the neckline (red line) is tilted rather than horizontal.
Pattern Education Points:
- Traditional vs Reality: While many educational materials show horizontal necklines, real market patterns frequently display angled necklines, which are equally valid
-Shoulder Structur
BALAJEE - Descending Triangle Meets Multi-Pattern ConfluenceOn the daily chart of Balajee, price action has formed a descending triangle right at the lower end of the trend:
๐ป Lower highs consistently pressuring horizontal support.
๐ฉ Price sitting within a clear demand zone, adding significance to the structure.
๐ Volume tapering off through consolidation, a classic triangle trait.
๐ Presence of a hidden counter-trend line (dotted) hinting at a potential broadening formation โ showing a rare multi-pattern overlap.
Such setups are important not for pred
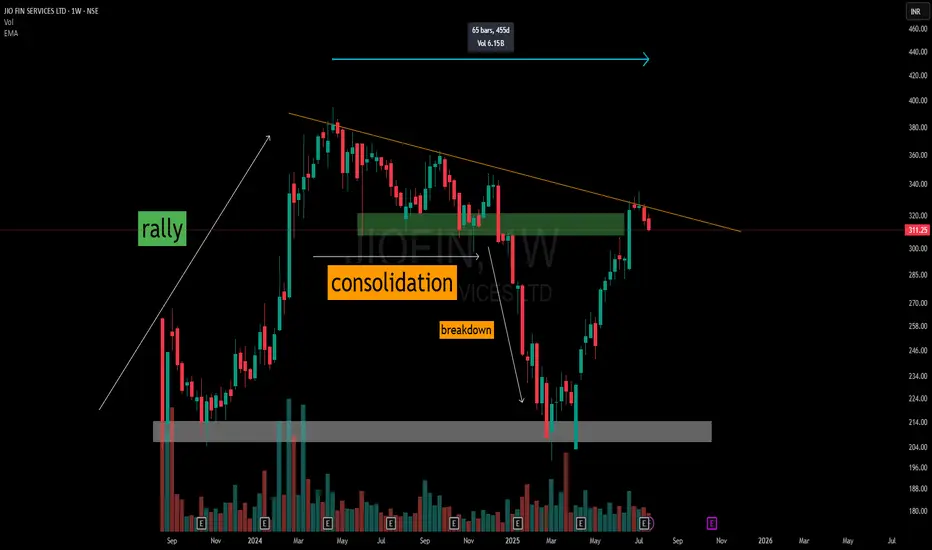
455-Day Counter Trendline | From Breakdown to V-RecoveryThis weekly chart of Jio Fin Services Ltd illustrates a multi-phase price structure over 455 days:
๐น Initial Rally โ Kicks off from a defined accumulation base (grey zone), marking the start of a strong impulse leg.
๐น Consolidation Phase โ Price enters a descending triangle formation just below a historical resistance band.
๐น Breakdown โ Clean breakdown from the triangle pattern sends price sharply downward.
๐น V-Shaped Recovery โ A strong reaction off the original base zone leads to a sharp rev
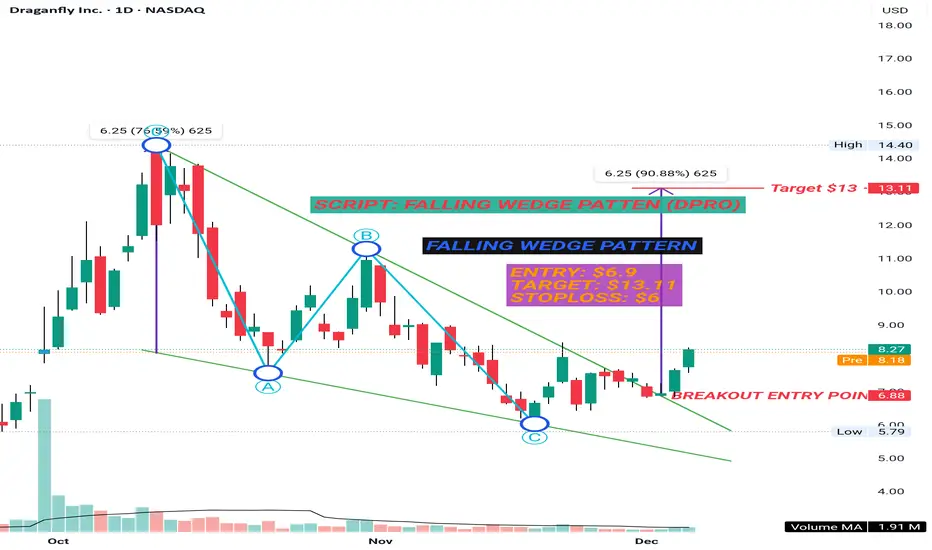
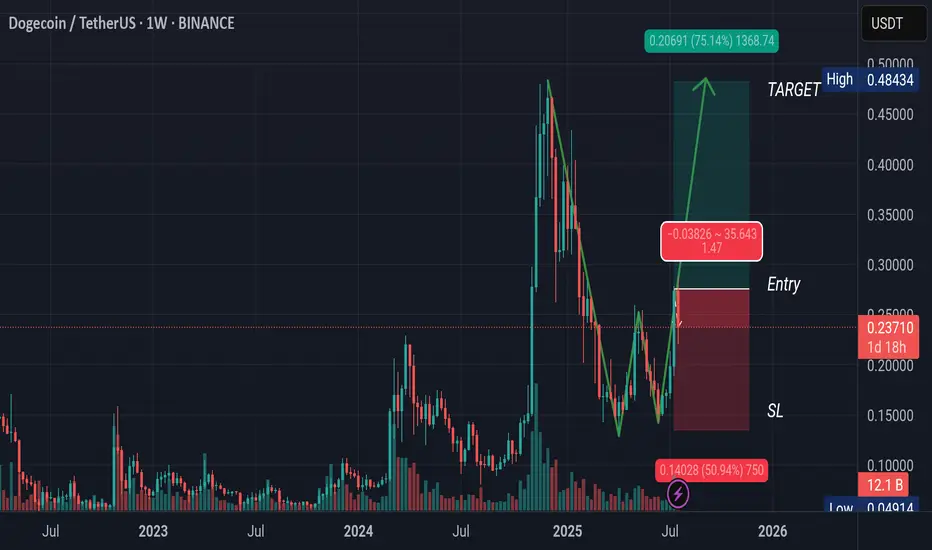
Clear W Pattern in DogecoinDogecoin is making W Pattern in Weekly time frame๐ฐ๐ฐ
SL๐, Target๐ฏ and Entry๐ Points are Mentioned in chart.
After completion of W Pattern, the Coin is Likely to make a big Cup and Handle Pattern too๐ฑ๐ฑ
Note: This analysis is for Educational Purpose Only. Please invest after consulting a professional financial advisor.