MACD Pullback Entry Framework📈 MACD Pullback Continuation & Momentum Reset Framework
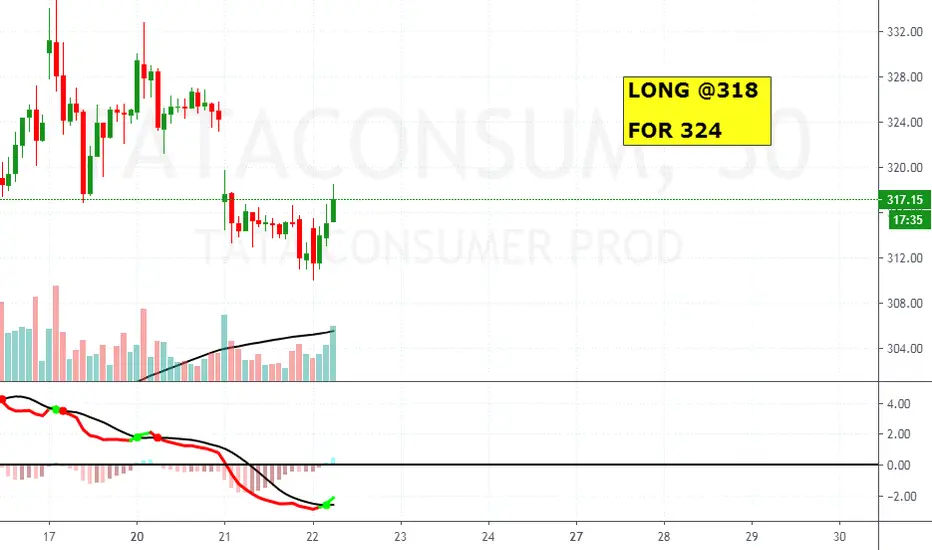
This chart demonstrates how MACD can be used effectively within a strong trend by focusing on pullback entries, not late breakouts or tops.
Unlike using MACD as a standalone buy/sell signal, this framework combines:
Trend direction
Price structure
Momentum reset below the zero line
This approach is designed to trade with the trend, not predict reversals.
⸻⸻⸻⸻⸻⸻⸻⸻⸻⸻
📊 Key Observations
1️⃣ Higher-Timeframe Trend Filter (Directional
Moving Average Convergence / Divergence (MACD)
OBV + MACD Confirmed FVG📉 Bitcoin – Bearish FVG Retracement With EMA200, OBV & MACD Momentum Confluence
This chart highlights a clean bearish structure on BTC, defined by a consistent sequence of Lower Highs (LH) and Lower Lows (LL). Throughout this downtrend, multiple Fair Value Gaps (FVGs) have formed — each created by sharp institutional displacement that leaves behind inefficiencies in price.
As price continues trending below the EMA200, bearish order flow remains firmly intact. Each time BTC retraces into an un
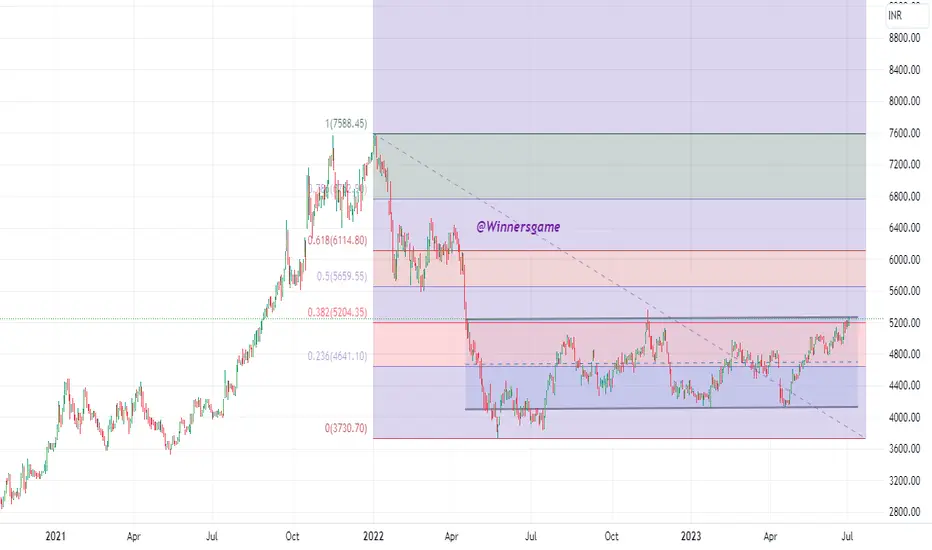
CONSOLIDATION BREAKOUT IN LTIMBuy LTIM (D) 5240, for 5700 and 6100. Add on dips till 5000 with stop at 4950 on weekly close. Stock ready to give breakout above 38.2% fibonacci levels and then will reach 50% and 62% eventually. Consolidation happening for last 12 months which shall give minimum 15% returns.
Both leading and lagging indicator MACD and EMA is indicating bullish momentum in LTIM
GIPCL: Short term to Mid term view-BullishDaily MACD Crossover, Weekly ADX positive trend, and all other indicators showing positive signals. Monthly MACD crossover happened but still price not yet moved much upside. Monthly indicators also positive. It may shootup anytime but patience is important to hold.
Vijayaraghavan.K,
Kovilpatti,Tuticorin Dist.
IOLCP: Short& Mid term view BullishRef chart. MACD crossover may happen on upcoming days in daily chart. This will trigger to price shoot-up. In daily chart Indicators are turning bullish from bearish . In monthly chart indicators are continuing the bullish momentum last few months. From this level it may move the further upside. Targets are given by using patterns.
****Note: If you noticed my earlier views, most of the views given before breakouts by using indicators. Risk takers no issues but Safe traders can take the trade a
MLong
GLong