NIFTY BANK Price Structure Analysis [For 15.06.2026: Monday]Probable Price Structure Analysis of NSE:BANKNIFTY for the 15th of June, 2026. The day is Monday.
(1) Bullish Scenario:
If the price stays above the level of 56500, then stay bullish. The probable bullish targets above the level of 56500 are - 56750, 57000, 57250, and 57500. The price will experience good resistance at the level of 57500. Next, if the price decisively breaks out above the level of 57500, then the probable bullish targets would be - 57750 and 58000.
(2) Bearish Scenario:
There is no observable bearish scenario. The level of 55750 is strong support. In case the price breaks down below the level of 55750, then the probable bearish targets would be - 55500, 55250, and 55000.
(3) No Trading Zone (NTZ): (56500 - 55750).
(4) Range of Consolidation (ROC): (57000 - 56000).
Here, the median of the ROC is 56500. If price stays above the median, then think only about executing bullish trades. On the contrary, if the price sustains below the level of 56500, then the price will be trading in the no-trading zone (NTZ). In that case, don't trade.
(5) Availability of an Unfilled GAP: (55750 - 55250).
We have to always discount the factor of an unfilled gap, as anything can happen in the market. There is a low probability of gap filling. Yet, we should keep it in mind while trading.
(6) Event:
There are no high-impact events or holidays in the week. However, we have to keep an eye on the geopolitical developments, Crude Oil Price, and USDINR.
(7) Establish intraday bias with respect to the opening price. If the price sustains above the opening price, then don't think of shorting. Look for bullish trades only. On the contrary, if the price sustains below the opening price, then don't think of going long. Look for bearish trades in that case.
Top-Down Analysis:
(1) Monthly TF:
The monthly candle is a strong bullish hammer candle trading above the level of 55000. Immediate strong resistance is 57500. The price is trading above the 20 EMA. The view is bullish.
(2) Weekly TF:
A strong perfect bullish marubozu is observable. It is a sign of strength and trend reversal (bearish to bullish). Considering the chart pattern of the period (March - June, 2026), the chart pattern is "Adam and Eve double bottom." It is a sign of trend reversal. Immediate resistance is the level of 57500. The price is trading above 9, 20, and 50 EMAs. There is no observable bearish setup. The view is bullish.
(3) Daily TF:
Candle formation trend in the period (01 June - 12 June, 2026) is higher-highs and lower-lows. The bullish trend is strong. Level 55500 seems to be a strong support level. Immediate resistance is 57500. The price is trading above upward-sloping 9, 20, and 50 EMAs. The price is also trading above the 200 EMA, but the 200 EMA is still flat. Since there is no sign of weakness, the view is bullish.
(4) 30-minute TF:
The price structure has formed a higher-highs and lower-lows formation. The strong support zone is (55000 - 56000). Immediate resistance is at 57500. There is no sign of weakness. The price is trading above upward-sloping 9, 20, 50, and 200 EMAs. The view is bullish.
NOTE:
(i) All the analyses would fail in the case of a major gap up, gap down, or price structure anomaly. Thus, practice PRAGMATISM in the live session.
(ii) Trade only if there is a set-up. Remember, not trading is an extension of the trading activity.
(iii) Mark your points. Trade your points. Price is GOD. Anything can happen in the markets. Thus, trade what you see, not what you believe.
(iv) Always PRACTICE RISK MANAGEMENT. Always PROTECT YOUR CAPITAL. Be RESPONSIBLE.
(v) Be Strategic. Be Courageous. Be Patient. Be Wise.
(vi) Every day is a new day. Thus, do not carry the baggage of past successes or failures. Leave the gardens of winning and losing. Establish yourself in equanimity. Always think from a new perspective.
(vii) Let the joy of trading drive your effectiveness, not greed or fear. Believe in Possibilities.
Happy Trading!
Marubozu
ASALCBR - 1.5 Months Downtrend / Consolidation Breakout - ATHAssociated Alcohols & Breweries Ltd
1) Time Frame - Daily.
2) The Stock has been in a downtrend / consolidation since (June, 2024) after breaking it's previous life time time of (653.65) . Now It has given a downtrend / consolidation breakout & Closed at it's Life Time High with good volume & good bullish momentum candle in Daily Time Frame.
3) The stock may find it's next resistance around the price (920 - 20% from the price 762.25).
4) Recommendation - Strong Buy.
Digvijay cement-A multibagger in making?Digvijay cement has given a beautiful cup and handle pattern breakout.
Recently, sock has also retested the breakout and formed huge bullish marubozu candle in weekly time frame.
Stock is looking very strong for a big bull run ahead.
Stock has good fundamentals as well and can be held for long term as well.
It is a good stock for multibagger investment as cement sector will definitely grow with growing infra and realty sector.
Ratios at CMP are attractive
PE ratio is around 18, Dividend yield is above 3%.Zero debt company.
ROE, ROCE is above 20.
Current ratio is above 1 and Price to sales is just around 2.
PURVANKARA - 3 Months Consolidation BreakoutPuravankara Ltd
1) Time Frame - Daily.
2) The Stock has been in a Consolidation since (January, 2024). Now It has given a Consolidation breakout & Closed above it's (January, 2024) High with good bullish momentum candle & with huge volume in daily Time Frame.
3) The stock may find It's next resistance around the (price 353) in short term
5) Recommendation - Strong Buy
PShort
DRREDDY, 1D Forms Bullish MarubozuNSE:DRREDDY Dr. Reddy's Laboratories is an Indian multinational pharmaceutical company based in Hyderabad. The company was founded by Kallam Anji Reddy, who previously worked in the mentor institute Indian Drugs and Pharmaceuticals Limited. Dr. Reddy manufactures and markets a wide range of pharmaceuticals in India and overseas.
DRREDDY forms Bullish Marubozu on support zone of Weekly TF
Entry : 5673.8
Target : 5890
SL : 5540
RR : 1.6
SBICARD, 1D forms Bullish MarubozuNSE:SBICARD SBI Cards & Payment Services Limited, previously known as SBI Cards & Payment Services Private Limited, is a credit card company and payment provider in India. SBI Card launched in May 1998 by State Bank of India and GE Capital. In December 2017, State Bank of India and The Carlyle Group acquired stake in the company.
SBICARD gave BO of Bullish Marubozu on 1D TF
Entry : 851
Target : 890
SL : 813
RR : 1
VEDANTA LTD, 1D - Bullish Marubozu BONSE:VEDL Vedanta Limited is an Indian multinational mining company headquartered in Mumbai, India, with its main operations in iron ore, gold and aluminium mines in Goa, Karnataka, Rajasthan and Odisha.
VEDL, 1D gave closing above Marabozu candle. The stock also formed triple bottom at 232 level and gave closing above neckline of triple bottom.
Entry : 241.40
Target : 255.50
SL : 231.50
RR : 1.4
Sun pharma,1D formed Bullish MarubozuNSE:SUNPHARMA Sun Pharmaceutical Industries Limited is an Indian multinational pharmaceutical company headquartered in Mumbai, that manufactures and sells pharmaceutical formulations and active pharmaceutical ingredients in more than 100 countries across the globe.
Sunpharma gave BO of Bullish Marubozu candle on Daily TF.
Entry : 1136.9
Target : 1169
SL : 1099
RR :0.85
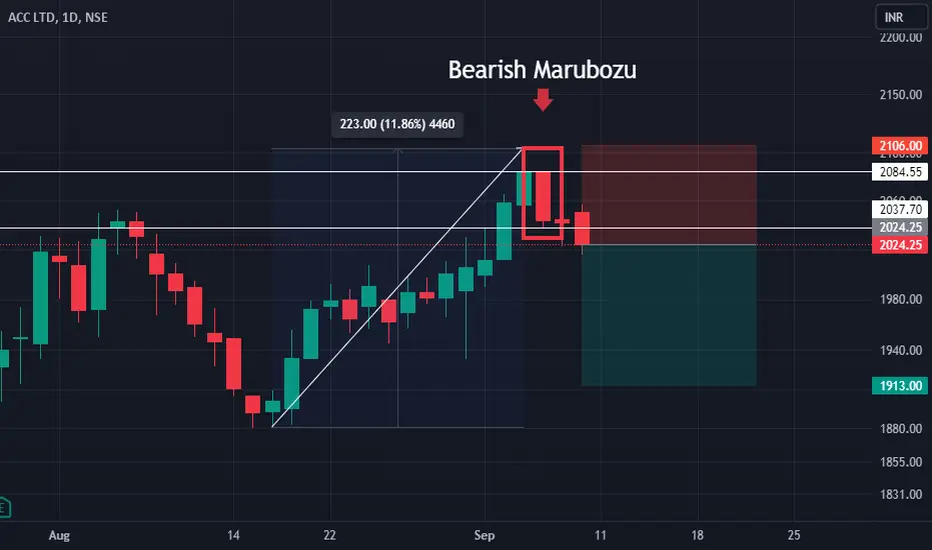
ACC formed Bearish Marubozu on 1DNSE:ACC ACC Limited (Formerly The Associated Cement Companies Limited) an Indian cement producer, headquartered in Mumbai. It is a subsidiary of Ambuja Cements and a part of the Adani Group. On 1 September 2006, the name of The Associated Cement Companies Limited was changed to ACC Limited. The company was established in Mumbai, Maharashtra on 1 August 1936.
ACC formed Bearish Marubozu and gave closing below it.
Entry : 2024.5
Target : 1913
SL : 2106
RR : 1.36
UPL Bearish way ahead ??!!!!Chart patterns convincing me to publish this above titled opinion
REASONS
1. UPL has been trading inside an Expanding Triangle pattern(10 year- from 2013) taking support and resistance at perfect levels till now.
2. Currently it is under the down swing move inside the pattern
3. Pink trendline from 2020 acting as support, Bears trying to get break that trendline ( June 2022 (1st time), Oct 2022(2nd try), now Dec 2022(3rd try)).
4. During the june 2022 and oct 2022, weekly candle broke that line(with wicks), but low didn't get tested and bulls took charge.
5. But, now the Breakdown candle(19 dec weekly candle) is more alike BEARISH MARUBOZU candle with LOW TESTED!!!!
6. This may be a sign of Bearish way ahead!!
7. In the Daily time frame, its been travelling in a channel pattern and respecting it too and currently an inverted cup & handle like pattern too formed in verge of a Breakdown!!(shown below)
8. It is better to not to Go long even if you don't short now!!!
9 . Strong day close above the 775 will pave way for weakness in Bears approach!!
If the stock goes as per levels shown, fib 0.382 , 0.5 can be the Target levels ahead!!
In the short term, we can have SL - day close above 738 and Target as 680
Let's wait and watch, how it is going to move!!!
Note - Just Sharing my view....not a tip nor advice!!!!
Bullish MarubozuThe bullish Marubozo candle (open equals low, high equals close) can signal a reversal when it is found at the end of a downtrend because it shows that the sentiment has changed and that the bulls are likely to continue pushing the asset higher.
Take High and Low of Candle . Take Position at Close. Target ( Total Length of Candle/2), SL : Low of Candle.
Risk Reward Ratio: 0.5
Feel free to share your feedback and queries.
If you want to know about your stock please mention in comment.
Note: This is not Paid only for Educational purpose.
Bearish MarubozuHello Friend
The bearish Marubozu candle signifies the complete control of the sellers on the market. Such is the level of the selling pressure that market participants are willing to sell their stocks or assets at every possible price point in the session.
Take High and Low of Candle . Take Position at Close. Target ( Total Length of Candle/2), SL : High of Candle.
Risk Reward Ratio: 0.5
To Learn Follow Us.
ABCAPITAL ANALYSIS IN 4H TF28/11/2022
LONG SIDE TRADE
SWING(4H)
ABCAPITAL
CUP&HANDLE pattern brekout in 4h tf with high volume.
Risk adverser can wait for retest and risk taker can initiate the trade with buy above the high.
ENTRY-136.1
SL-128.25
TARGET-144
R:R-1:1
It is ICING ON THE CAKE if it comes to 133.5.