One candlestick pattern - The MarubozuHey everyone!
In this post, we are going to talk about a candlestick pattern known as Marubozu, along with a few exhibits that may help you solidify your understanding of this pattern.
Please remember this is an educational post to help all of our members better understand concepts used in trading or investing. This in no way promotes a particular style of trading!
The candlestick charts offer a quick picture into the psychology of buyers and sellers. Before proceeding further, a few thin
Marubozu
Supply Zone Breakout in Tata Motors (D)Tata Motors has finally broken the previous supply zone of 460-475. With stock approaching all-time high levels looks very bullish. We can buy at the current price with SL@ 425. Possible targets are mentioned on the chart.
Tata motors is one of the fundamentally strong companies which is a leading global automobile manufacturer. It is a formidable player in the CV segment in India and offers a broad portfolio of automotive products including trucks, buses, coaches and defense vehicles. It is th
HDFC Bank :- Found Rarest and One of the most powerful candle NSE: HDFCBANK
Time Frame :- 1 Day
Patterns Name :- Parallel Channel
Conclusion :-
A Big Red Marubozu candle taking up resistance at the top of a parallel channel which most probably shows up a down trend as the "Relative Srength Index (RSI)"
We are not responsible for any profit or loss
Based on Your Own Risk this is only to Show you the Current Pattern
Comment Below If You want to ask me questions on this on any other idea
BTW Like and Follow if you like this awesome content
Made By MAYANKTEC
Indusind Bank What to do next ?NSE: INDUSINDBK
Time Frame :- 1 Day
Patterns Name :- Parallel Channel
Conclusion :-
A Big Red Marubozu candle taking up resistance at the top of a parallel channel which most probably shows up a down trend as this is a weak share too show here are two breakout which show the one scenario that could be done and here we have told about the marubozu candle who dont know
We are not responsible for any profit or loss
Based on Your Own Risk this is only to Show you the Current Pattern
Comment Belo
Target 1 achieved in Tcplpack | 9.5% mover This idea is a follow-up to Tclpack
You can check the Link to Related Ideas.
Disclaimer: The information provided is for educational purposes only. Our intention is not to give any financial advice, don't take any decision without consulting your financial advisor.
Colpal Long (14 Mar)Colpal Long (14 Mar)
RSI- 50
we can see support at 200 week EMA
Strong buying with good volumes seen last week
Buy at CMP- 1498
SL- 1390
Target- 1630, 1728 and more
Join us, Learn more, Earn more
Disclaimer- We are not SEBI registered advisor.
Charts and views are only for educational purpose.
GODREJCP long trade with multiple supporting reasonsGODREJCP showing some buying activity at demand zone and candlestick pattern(kind of marubozu) also indicates of a probable reversal as the 8th March and 9th March 2022 candles have same lows of 660.05. Buying around 700 with SL of 660 for target 770,830
Technical Analysis of Pacific BioSciences (PACB)Disclaimer: I own shares of PACB at the time of publishing this analysis.
The below analysis is not a trading or investment recommendation & is only for learning purpose.
1.PACB has been in a major downtrend like most other small caps & biotech stocks.
2.The stock is way below the 200DMA which sits around $25.
3.The spread between the 20DMA & 200DMA is also very wide indicating a pull back to the 200DMA.
4. The stock bottomed at $9.04 which was followed by some buying pushing the price up to $
Unionbank Long (02 Feb)Unionbank Long (02 Feb)
RSI- 59
taking strong support at 20 and 50 Day EMA's
Marubosu candle at breakout
Buy at CMP- 47.7
SL- 45
Target- 50.3, 53.4, 54.5
Join us, Learn more, Earn more
Disclaimer- We are not SEBI registered advisor.
Charts and views are only for educational purpose.
Technical Analysis: Bearish marubozu keeps AUDUSD seller hopefulDespite recently bouncing off a monthly low, AUDUSD remains pressured around 20-DMA during early Wednesday. The risk-barometer pair dropped the most in a week while flashing a bearish candlestick on the daily chart. The anticipated declines also gain support from the absence of the oversold RSI conditions. However, July’s low of 0.7288 acts as a trigger for the fresh fall. Following that, 23.6% Fibonacci retracement level near 0.7225 and 0.7155 could offer intermediate halts during the south-run
TLong
LOOKS GOOD FOR A SWING AND EVEN FOR LONG TERM!Stock gave a breakout a few weeks back and has been consolidating over the marubozu (breakout candle) from a decent time, has given a good weekly closing and the candle looks good, it has possibly bottomed out. Can go long with a stop-loss of 287 for the short term targets of 340 and 380.
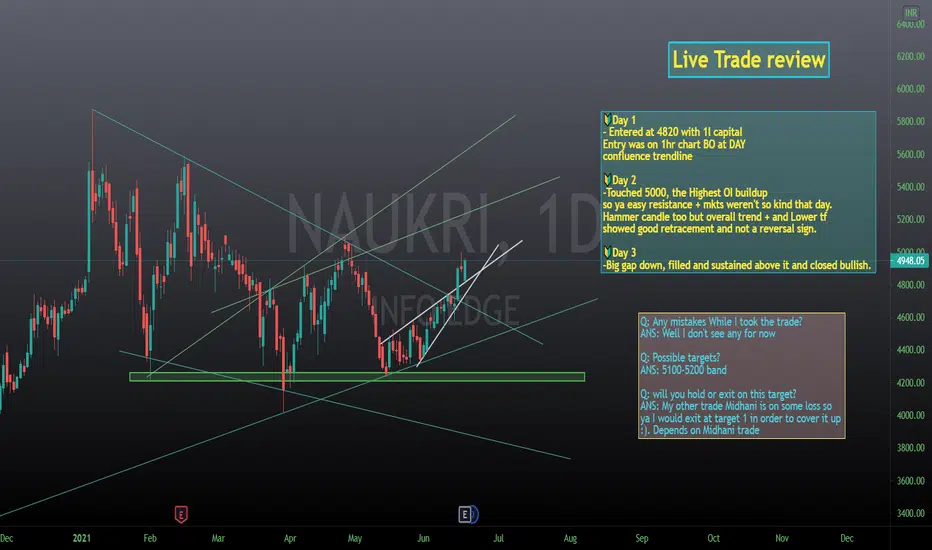
🔰 InfoEdge Analysis with Live trade and its review 💲Thanks for 500 Followers guys💲
💲💲 FOLLOW me @Averoy_Apoorv_Analysis and get these free analysis and Real-time trades that I take too :) 💲💲
🔰MY entry: 4820 ( 1 L invested with a risk of 5% ), I believe in my system and follow the process thus risk-reward is based on the edge of my system. So that's invariant still just for the psychological purpose.
🔰I too am a learner and would love to learn with you all :)
🔰Well, this is a transparency series created by me, here I will take the trades and