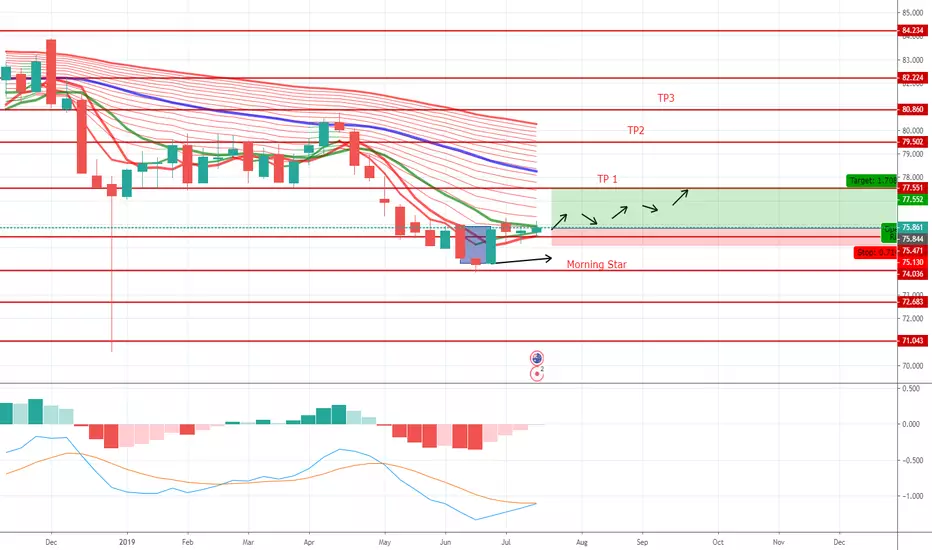
AUDCAD WEEKLY, Long After a morning star pattern.The morning star pattern is considered as a bullish reversal pattern, it
often occurs at the bottom of a downtrend and it consists of three
candlesticks:
-The first candlestick is bearish which indicates that sellers are still in
charge of the market.
-The second candle is a small one which represents that sellers are in
control, but they don’t push the market much lower and this candle
can be bullish or bearish.
-The third candle is a bullish candlestick that gapped up on the open
and closed ab
Morning Star
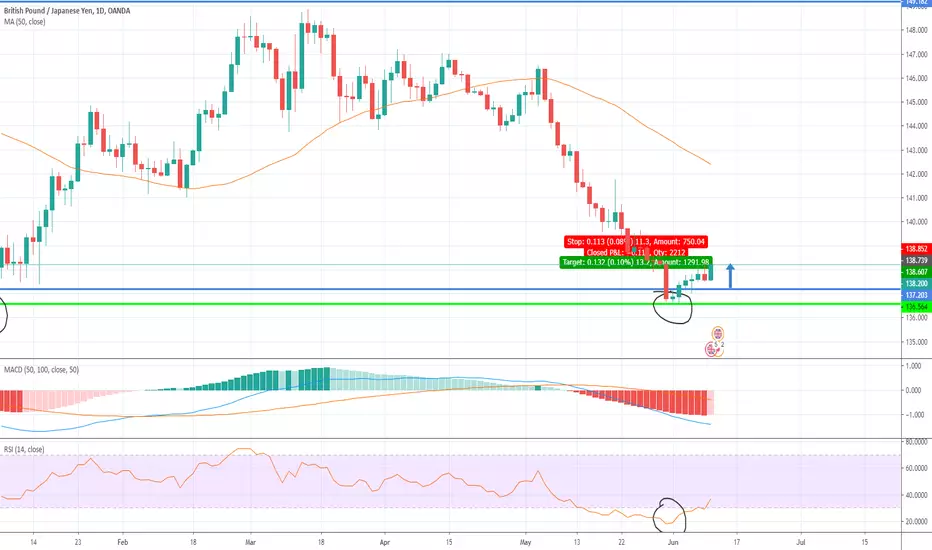
AUDJPY LONG WEEKLYAUDJPY goes long after a morning star pattern.
The morning star pattern is considered as a bullish reversal pattern, it
often occurs at the bottom of a downtrend and it consists of three
candlesticks:
-The first candlestick is bearish which indicates that sellers are still in
charge of the market.
-The second candle is a small one which represents that sellers are in
control, but they don’t push the market much lower and this candle
can be bullish or bearish.
-The third candle is a bullish cand
Looking like it's Nano timeNot sure if it was a pump & dump group but volume came like a tidal wave and seems to be sticking around. Either way, it'll be left with a strong daily candle for a mammoth rise in the next few days
NLong
Nano is set up to boomThe fastest crypto by FAR with No Transaction Fees
Faster than an SMS text it can be sent across the world
ATH $38.00
On sale now $1.52
NLong
AEO Long - Oversold and now has some momentumThis trade does have down potential as any trade does.
AEO has just gotten past the horrible 4th quarter sales from last year, and consumer buying power has risen. I think the stock has over sold, and if you look at June 11th, that looks closely like a modified morning star (bullish).
Now- the sad truth is that the very next day the stock went back down on June 12th, and this makes not a true morning star. On June 13 +14 stock prices rose up beyond the opening price of the 12th and I jumped
GBP/JPY Technical analysisThe counter is consolidating in a descending triangle pattern for the short term.
It bounced and tried to break the resistive trendline but its valiant effort was invain.
We expect the bearish strength to continue in the counter and so the descending triangle is set to render a bearish breakout, which can spur fresh sell off.
forexTrdr GBPUSD - MORNING STAR & BULLISH HARAMI AHEAD OF GDP Morning traders,
We have a British pound versus US dollar trade setup ahead of UK GDP at 9:30 (BST) where consensus is pointing to 1.8%. Should we see a beat then we would be looking for British pound to trade to mid 1.31 area before pulling back lower within the descending channel we have highlighted in our trading view chart.
The GDP data lines up with positive signals on the technical front with the pair trading around support levels at 1.30. On the candle pattern front we have had a bulli
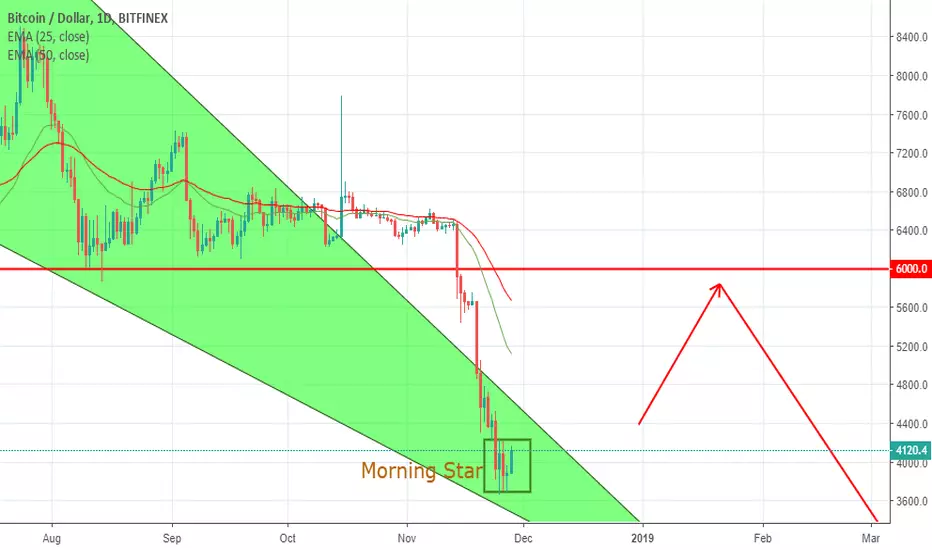
BITCOIN - "Morning Star" Made a Bullish Breakout!Around 10 days ago I mentioned that the BTC price will go into the $4,500. Today it is again on 'the table' and I will reveal those technical aspects why I think so!
The recent consistency on the Weekly chart is pretty impressive, currently running the sixth week while we may get a green candle. Consistency means that the FOMO (fear of missing out) players might kick in at some point which will help to guide the price higher but okay, let the mid-term technical analysis speaks for itself.
Fi
CADJPY SELL BROKE OUT OF WEDGE TREND
HIT SUPPORT AND WHEN BULLISH, HOWEVER WE HAVE NOW FORMED A SHOOTING STAR CANDLE STICK. FURTHERMORE THIS IS A STRONG CANDLESTICK SIGN OF A REVERSAL IN TREND.
WE HAVE ALSO JUST HIT THE 50% MARK IN FIBONACCI MEANING WE COULD EITHER GO BEARISH FROM HERE, OR IT MIGHT GO BULLISH AND THE 61.8% MARK AND OUR RESISTANCE LEVEL THEN BE A STRONG BEARISH TREND.
WE SHOULD GO BEARISH AND HIT THE 78.737 (-27.00 MARK).
BTC current candlestick patterns: Morning star vs. Bull PennantHi all,
I've been getting a few DM's and emails on what I think of the current price action. In past videos and written publications I have said that things got into extreme overbought territory on the shorter time frame charts. I mentioned that things could trade sideways and be a little choppy for a few days while momentum rolls back to neutral territory. If the bulls step up you'll see reactivation of the trend as momentum neutralizes before the next push.
I wanted to put out a quick ed