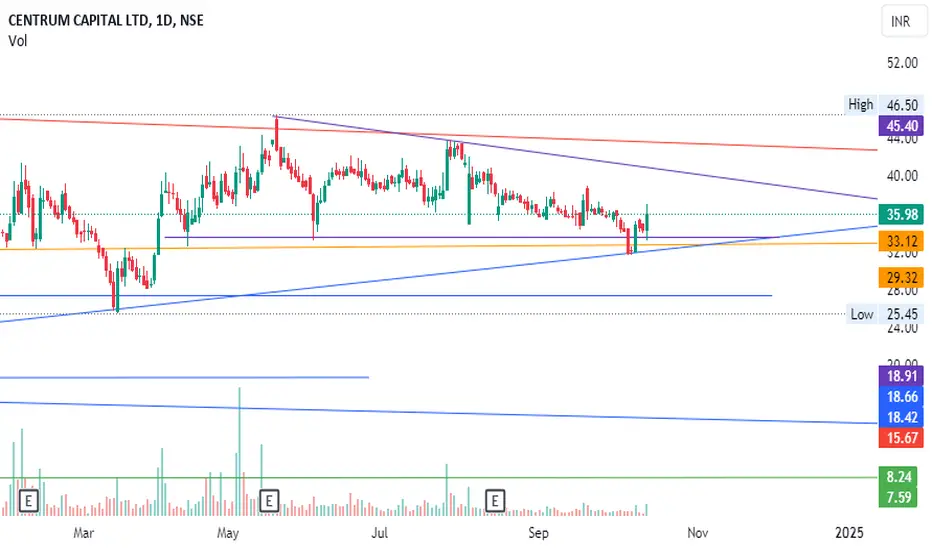
VERANDA - Breakout and RetestPrice breakout triangle and came back inside the triangle and it formed hammer like candle now (Weekly Timeframe). We should consider entering a trade only if a strong green candle forms in the next session. On the daily timeframe, it appears to be forming a morning star-like structure.
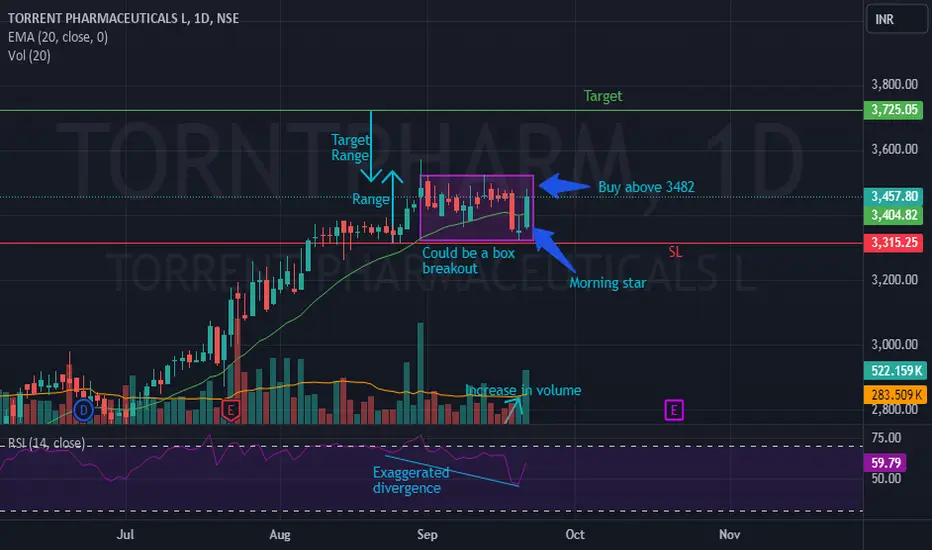
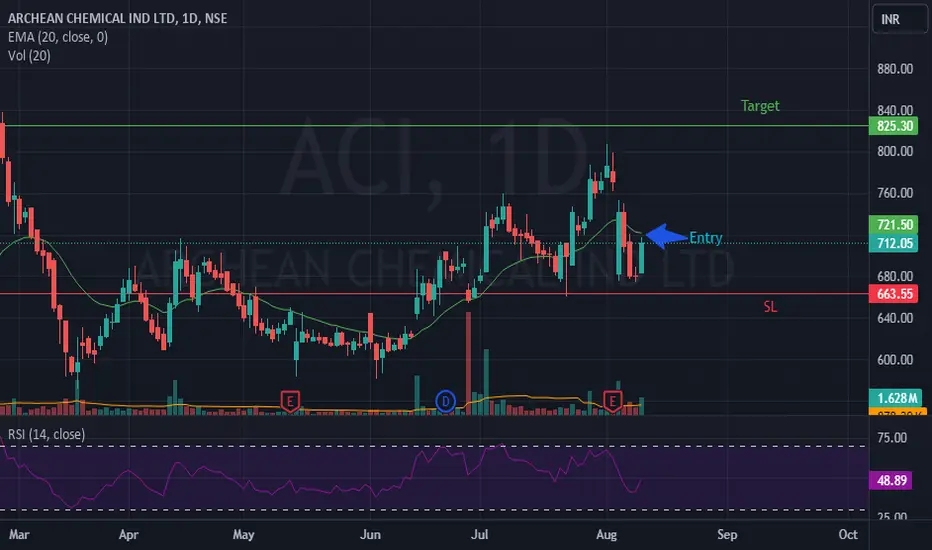
Morning Star
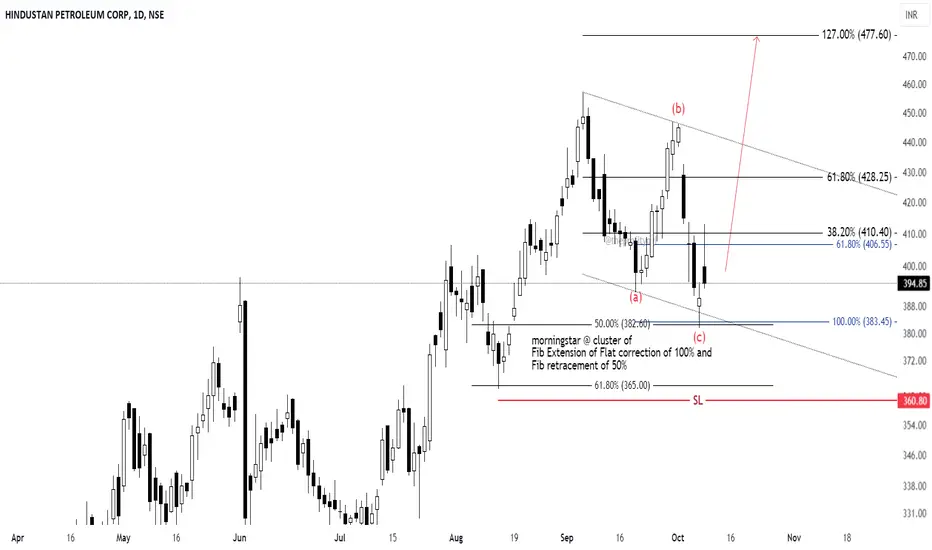
Morning Star at several Fib clusters in HINDPETRO Wave C of Flat correction has fulfilled the rule of equality (Wave A and Wave C are equal).
There is also a Fib level of fib retracement of the previous impulse at this level.
We can also see the Morning Star pattern forming at this cluster.
This suggests a high probability of a buy trade in HINDPETRO .
Stop-loss for this trade can be put below 61.8%, i.e., around 360 level.
This analysis is for educational purposes only.
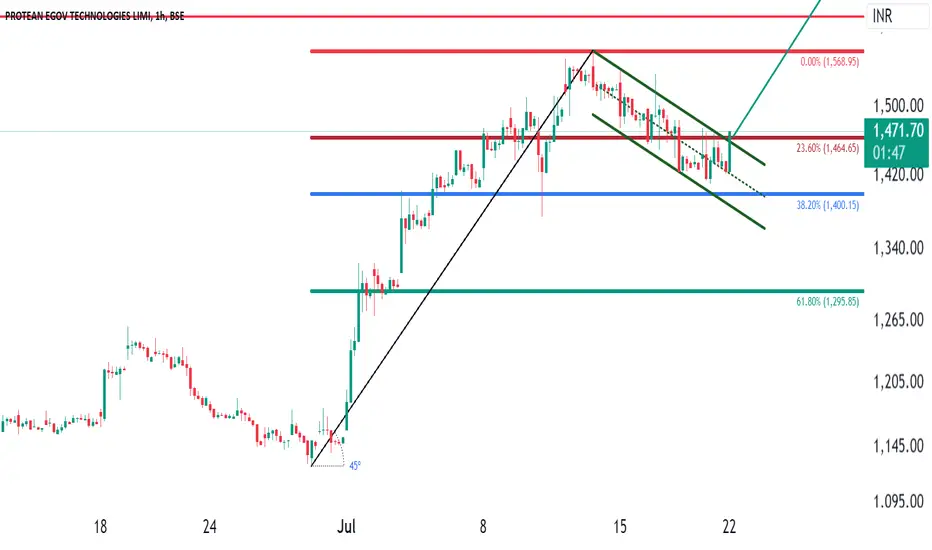
PROTEAN - Bullish Flag, Morning Star, Fibonacci Retracement 38.2In the chart of "PROTEAN," a Bullish Flag pattern has emerged, suggesting a potential continuation of its upward trend. The pattern is characterized by a sharp upward move (pole) followed by a consolidation period (flag), forming a rectangular shape on the chart.
The entry point for this pattern is identified above 1466, indicating a breakout from the consolidation phase. A stop-loss is set below 1410 to manage risk in case of a reversal.
The target for this trade is set at 2000, aligning with
Devyani-A risky support bounce trade!Devyani is looking a good candidate for support bounce
Logic:-Stock is trading in channel. The price action is impressive but a confirmation is not still visible.
The stock has delivered poor results and is available at PE multiple of 138x.
Only risky traders should be interested in this.
Mahindra & Mahindra - Bullish Head and Shoulder Chart PatternMahindra & Mahindra has formed a bullish head and shoulder pattern along with rounding pattern, but the concern is that bullish pattern should formed in downside or downtrend.
But here pattern formed in uptrend.
Point to be noted that head is formed with morning star candlestick pattern.
Entry on closing basis above 2000
SL below 1890
Target 2200
RRR 1:2
Confidence Level is moderate but not high
Gati Ltd - A Morning Star pattern perfectly formed on support.Swing - 113 to 177
Shallow Pullback - 38.20% retracement level
Chart Pattern - Morning Star
The price takes support from the level of 150 which is a 38.20% Fibonacci retracement level. This level is considered as a shallow pullback. And the price formed a morning star pattern on this support level. This type of structure indicates the start of an uptrend.
1st Resistance - 160
2nd Resistance - 177
These levels can be considered as targets.
Hit the like button!! Show some energy!!
Thanks
Er
GLong
CUMMINSIND, 1D formed Morning starNSE:CUMMINSIND Formed in 1962, the largest entity of Cummins in India, Cummins India Limited is the country's leading manufacturer of diesel and natural gas engines.
Cummins India formed morning star candlestick pattern and gave closing above it.
Entry : 1755.35
Target : 1821.40
SL : 1670
RR : 0.77
Reliance - Classic morning star pattern formationReliance Industries Ltd is trading in a price range of 2200 - 2800 since Sep 2021.
In between this a strong support and resistance formed where 2200 act as a support and 2800 as a resistance.
Last week a bullish candlestick pattern formed in Reliance called Classic Morning Star at support level.
Here are the characteristics of a classic Morning Star pattern:
1. The first candle is a long bearish candlestick, indicating that the bears are in control of the market.
2. The second candle is a s
NIFTY -- 3 BLACK CROWS vs MORNING STAR Chart patterns looks interesting from both bull and bearish point of view
REASONS
BEARISH VIEW
1. 3 Black crows (perfect closing) with rise in volumes ( www.tradingview.com)
2. February monthly candle looks like BREAKDOWN candle with low tested the next month
3. Weekly H&S pattern in progress
4. Bullish flag Breakout candle (october 2022 candle) low got tested....sign of bears strength
BULLISH VIEW
1. Overall it is in uptrend(making higher highs and higher lows)
2. Morning
Morning Star
A morning star is a visual pattern made up of a tall black candlestick, a smaller black or white candlestick with a short body and long wicks, and a third tall white candlestick.
The middle candle of the morning star captures a moment of market indecision where the bears begin to give way to bulls. The third candle confirms the reversal and can mark a new uptrend.
Script = Wipro
Time Frame = 1 Day
Morning StarA morning star is a visual pattern made up of a tall black candlestick, a smaller black or white candlestick with a short body and long wicks, and a third tall white candlestick.
The middle candle of the morning star captures a moment of market indecision where the bears begin to give way to bulls. The third candle confirms the reversal and can mark a new uptrend.
Script = ABFRL
Time Frame = 1 Day
Morning StarA morning star is a visual pattern made up of a tall black candlestick, a smaller black or white candlestick with a short body and long wicks, and a third tall white candlestick.
The middle candle of the morning star captures a moment of market indecision where the bears begin to give way to bulls. The third candle confirms the reversal and can mark a new uptrend.
Script = Ashok Leyland
Time Frame = 1 Day
Morning StarA morning star is a visual pattern made up of a tall black candlestick, a smaller black or white candlestick with a short body and long wicks, and a third tall white candlestick.
The middle candle of the morning star captures a moment of market indecision where the bears begin to give way to bulls. The third candle confirms the reversal and can mark a new uptrend.
Script = Cipla
Time Frame = 1 day
Morning StarA morning star is a visual pattern made up of a tall black candlestick, a smaller black or white candlestick with a short body and long wicks, and a third tall white candlestick.
The middle candle of the morning star captures a moment of market indecision where the bears begin to give way to bulls. The third candle confirms the reversal and can mark a new uptrend.
Script = HeroMotocorp
Time Frame = 15 min
VOLTAS - Monthly chart study - Morning star pattern at supportThe analysis is done on Monthly TF hence price may take few weeks to Few months in order to reach the targets.
Trade setup is explained in image itself.
The above analysis is purely for educational purpose. Traders must do their own study & follow risk management before entering into any trade
Checkout my other ideas to understand how one can earn from stock markets with simple trade setups. Feel Free to comment below this or connect with me for any query or suggestion regarding this stock or
Morning StarA morning star is a visual pattern made up of a tall black candlestick, a smaller black or white candlestick with a short body and long wicks, and a third tall white candlestick.
The middle candle of the morning star captures a moment of market indecision where the bears begin to give way to bulls. The third candle confirms the reversal and can mark a new uptrend.
Script = TCS
Time Frame = 15 min