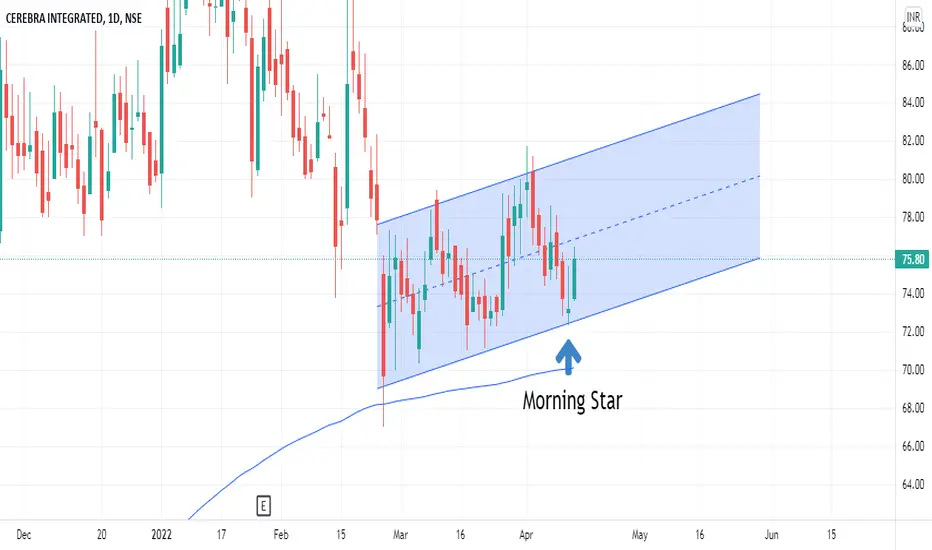
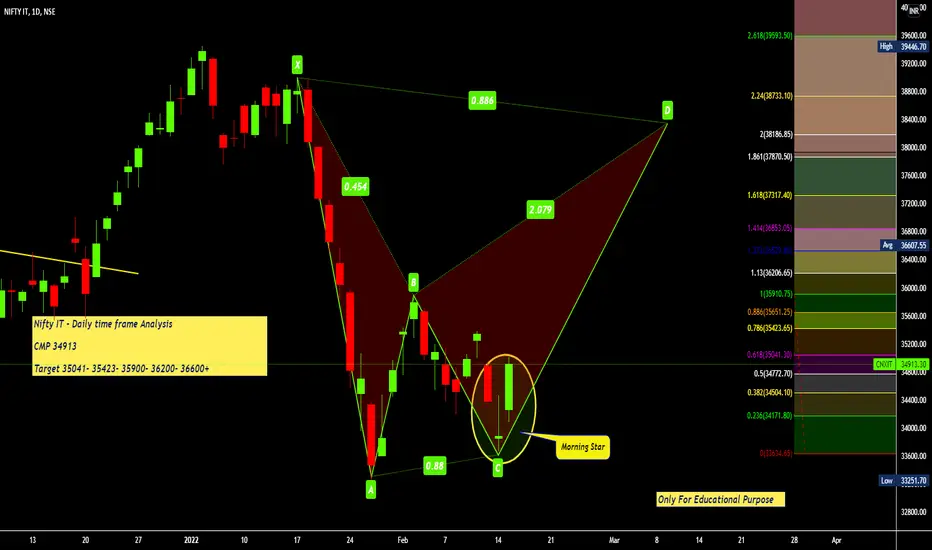
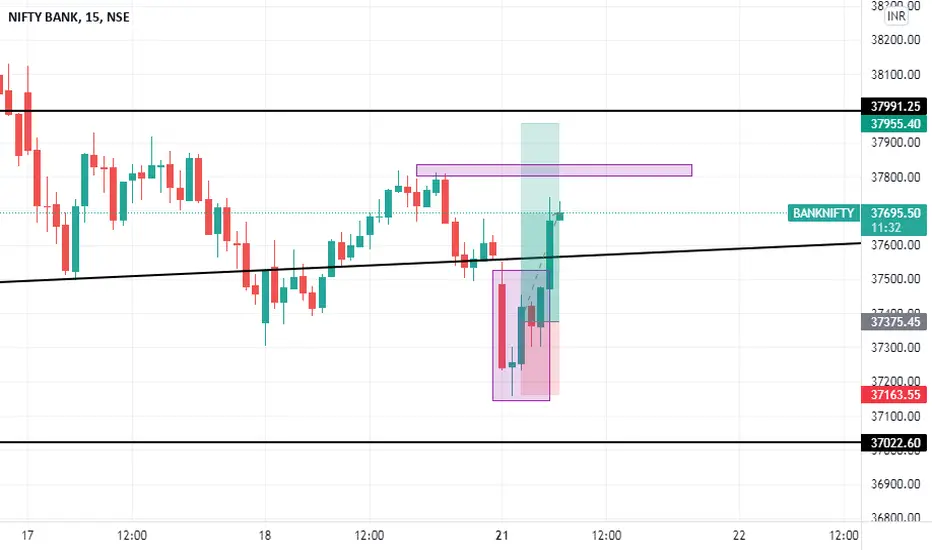
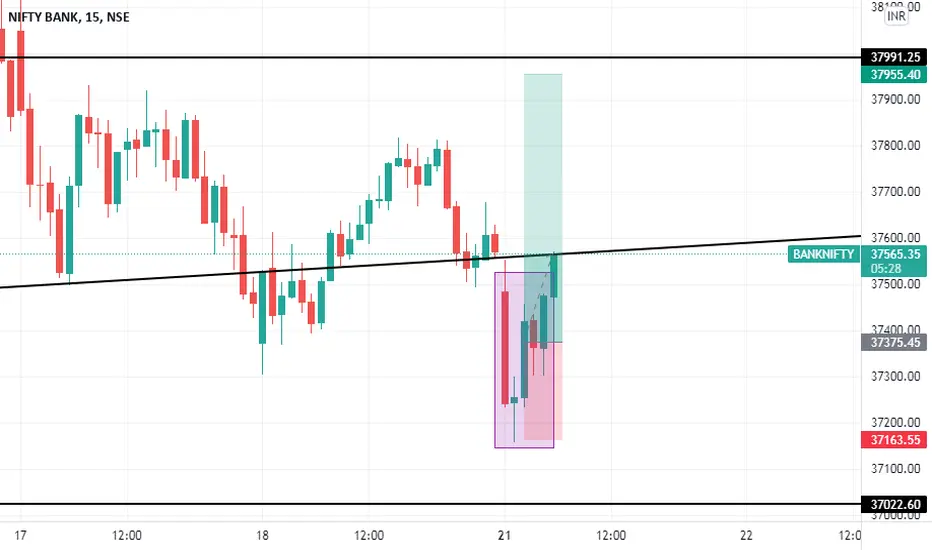
Morning StarA morning star is a visual pattern made up of a tall black candlestick, a smaller black or white candlestick with a short body and long wicks, and a third tall white candlestick.
The middle candle of the morning star captures a moment of market indecision where the bears begin to give way to bulls. The third candle confirms the reversal and can mark a new uptrend.
Script = TCS
Time Frame = 15 min
Morning Star
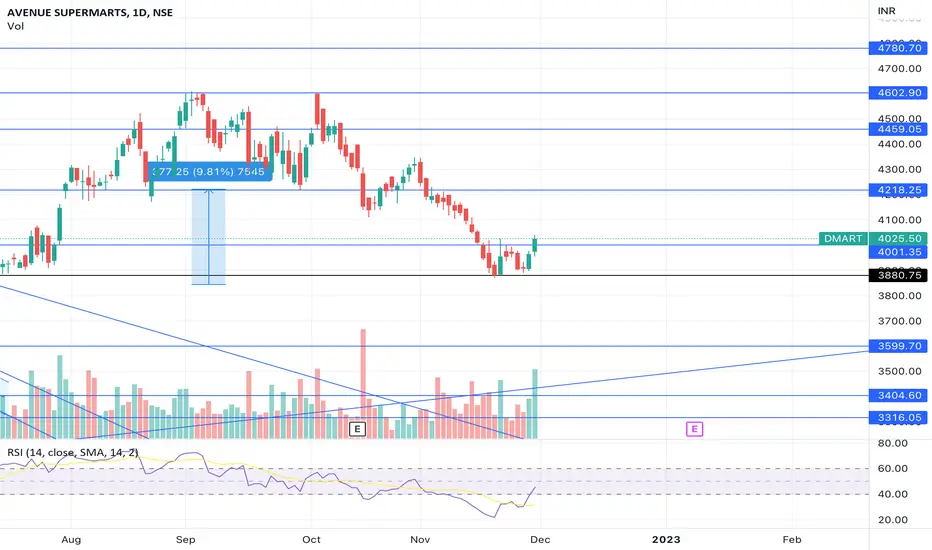
AVENUE SUPERMARTSNSE:DMART is a very good fundamental company with strong management.
on daily time frame after a sharp fall, Smart has made 2 reversal patterns one is bull slush and second is morning star respectively.
one can bought this stock for short term target of 4218 and mid term target of 4602
DISCLOSURE : I have this company in my portfolio
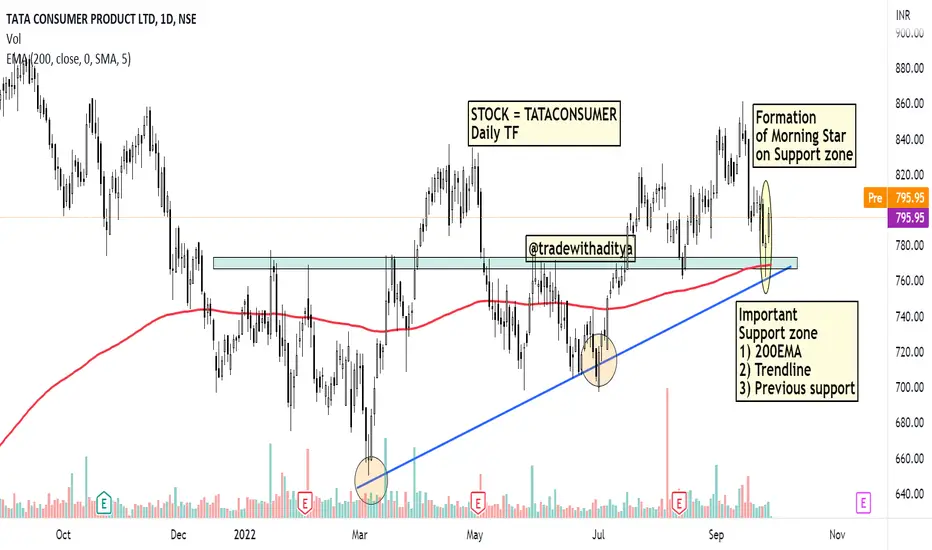
TATACONSUMER - Swing Trade - Morning Star FormationThe analysis is done on daily TF hence price may take few days to few weeks in order to reach the targets.
Trade setup is explained in image itself.
The above analysis is purely for educational purpose. Traders must do their own study & follow risk management before entering into any trade
Checkout my other ideas to understand how one can earn from stock markets with simple trade setups. Feel Free to comment below this or connect with me for any query or suggestion regarding this stock or Pric
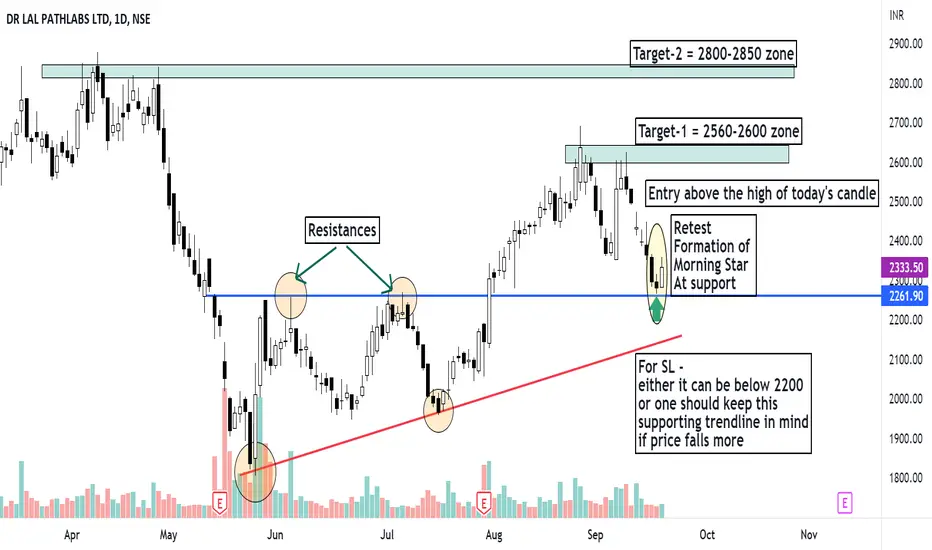
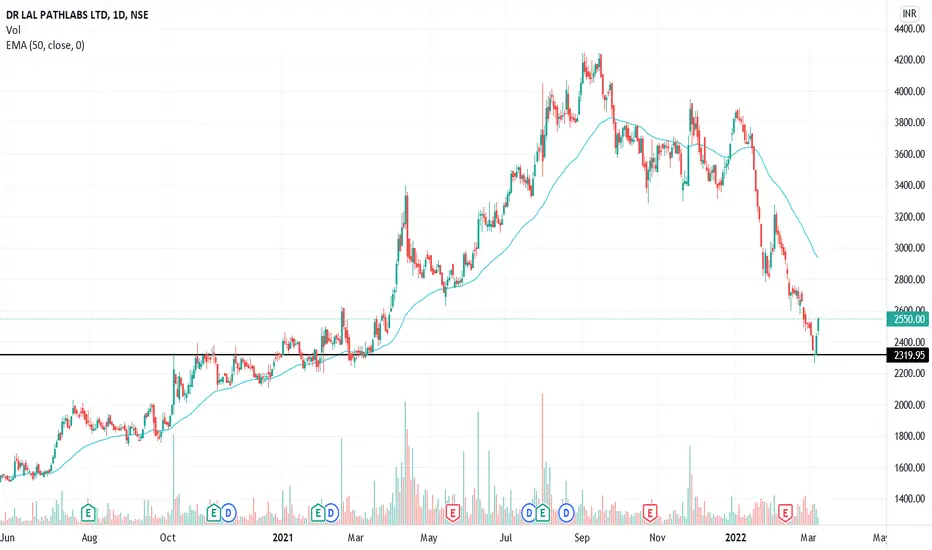
LALPATHLAB -Retest Structure & Morning Star pattern -Swing TradeThe analysis is done on daily TF hence price may take few days to few weeks in order to reach the targets.
Trade setup is explained in image itself.
The above analysis is purely for educational purpose. Traders must do their own study & follow risk management before entering into any trade
Checkout my other ideas to understand how one can earn from stock markets with simple trade setups. Feel Free to comment below this or connect with me for any query or suggestion regarding this stock or Pric
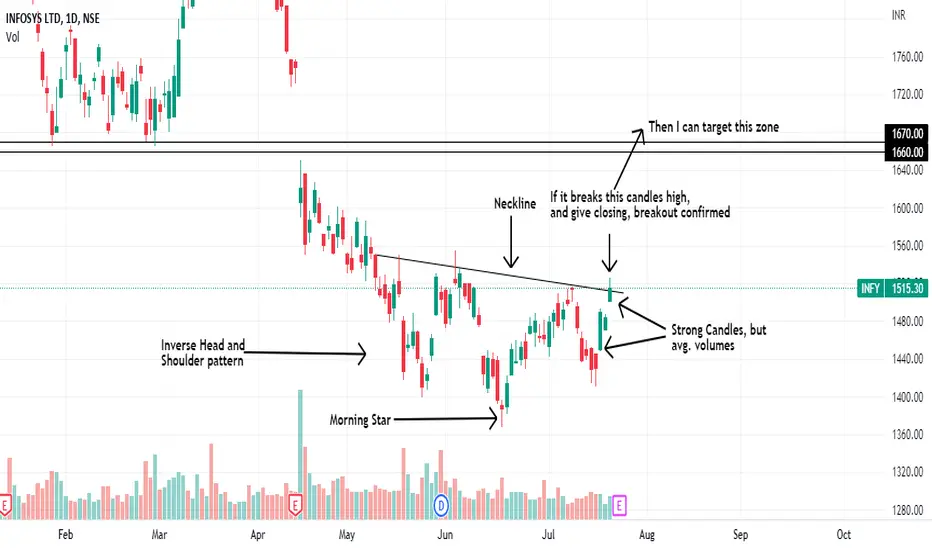
Inverse Head and Shoulder PatternThis is 1D timeframe.
Infosys have formed a inverse head and shoulder pattern with a morning star at bottom in head.
Last three days, 2 good bullish candles, but the volume is average so I need more confirmation to initate the trade.
Will wait to get a closing above 20th July candle with volume support.
Then I can target the 1660-1670 zone.
I can keep stoploss below neckline to gain good RR ratio.
This post is for information purpose only.
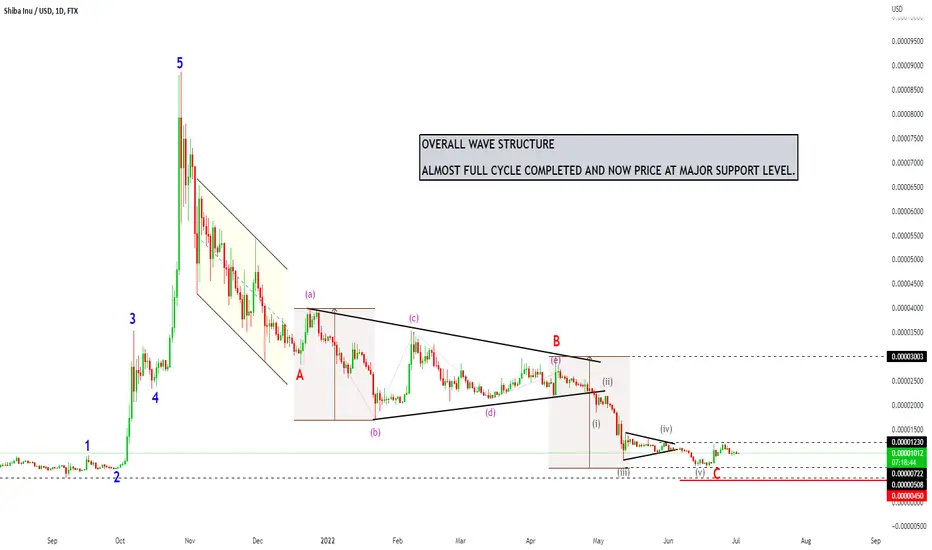
shibusd - Shiba inu usd Elliot wave countsShiba is trading at ideal support zone at the starting point of wave cycle, but to confirm low/support in place and bullish reversal,
we need to see a recovery at least back to 0.00001435 area and more strong above 0.00000200 area. (One can go long after these confirmations) on the way down 0.00000450 levels are major support to watchout for.
As per Elliott wave perspective, we have been tracking (A)-(B)-(C) correction from all-time highs and wave (C) is now possibly completed,
as we see a compl
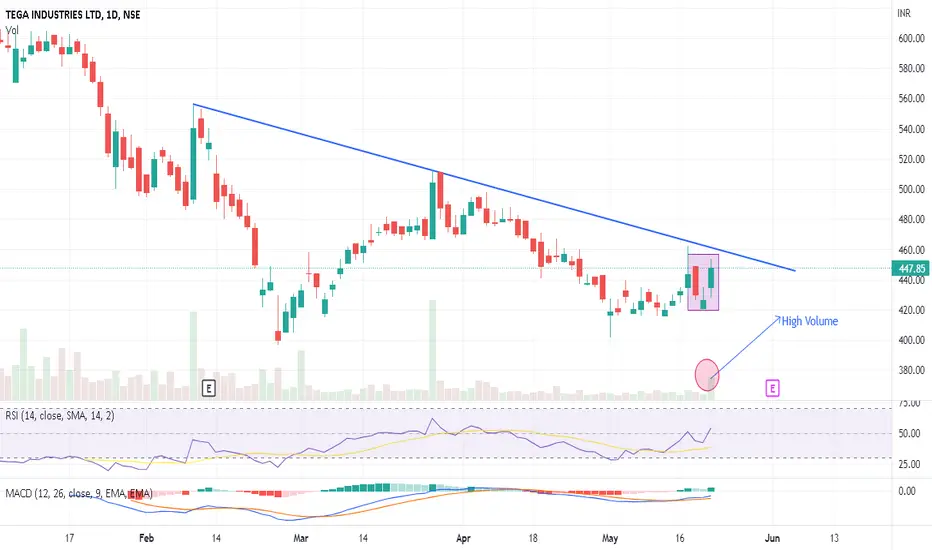
Tega Industries - Morning StarTega industries had listed at around 761/- ( 68% premium to its IPO price of ₹453 per share.)
Its now at 447 (almost 1% less than IPO price).
Chart shows Morning star pattern with a substantial high volume as indicated in the chart.
Looks set to go up in near term.
Trade Carefully !!
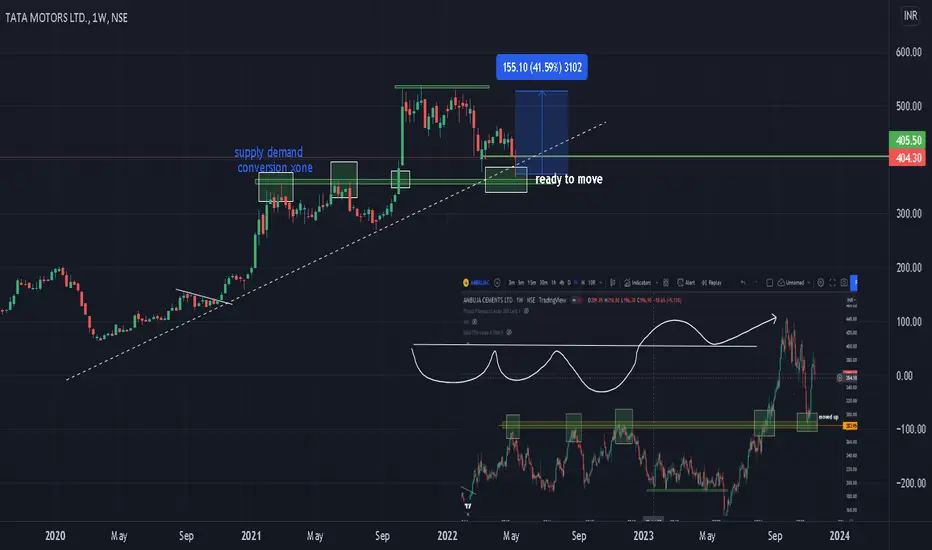
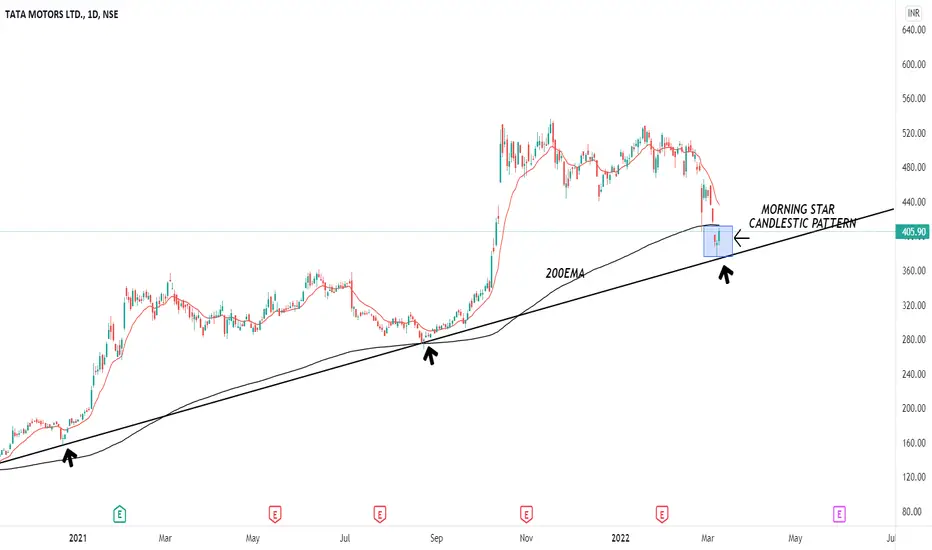
tata motors supply demand conversion zone The green zone is a supply-demand zone where tata motors took resistance two times and at the third time as it touches the zone gave breakout on higher side. It is the first time when it came back to the zone where the zone will behave as support.
It will move in the upcoming weeks if sustain above zone.
I attached a chart of NSE:AMBUJACEM , its chart also look like tata motors. Ambuja has taken support from zone and moved up by 40%.
So because of similarities, I am expecting this kind of move
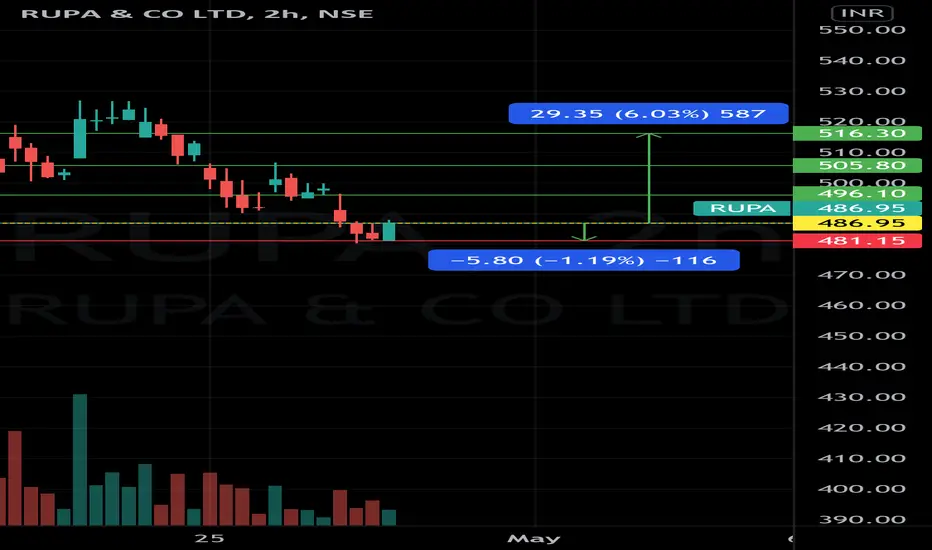
Expecting a Bullish Momentum in RUPAAs per the 2 Hour Chart of RUPA, we have witnessed the Formations of a “Bullish Engulfing” and a “Morning Star” Pattern on the downside levels.
Therefore, we are expecting to witness a bullish momentum in the stock in the upcoming trading sessions. Wherein, the stock is being expected to face a resistance initially at around the levels of 496.10, 505.80, and 516.30. Whereas, on the other hand, on the downside levels, the stock may face a support at the level of 481.15, on closing basis.
Closi
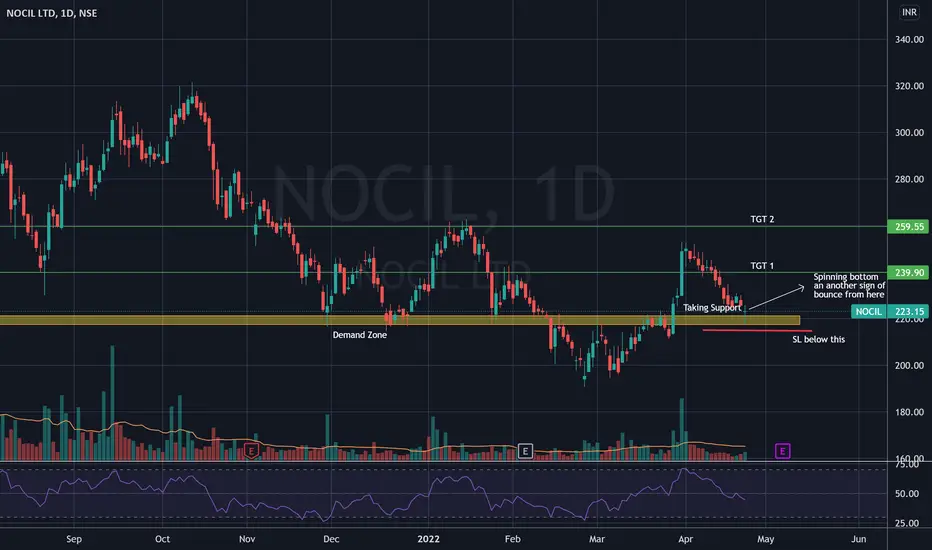
Nocil : Morning star expectedNOCIL is in formation of morning star pattern and is exact levels to take support and bounce from here. These kind of patterns are very much promising and good for swing trade.
levels are self explanatory on charts.
Disclaimer : This study is for educational purpose only & is not buying or selling recommendations. I am not SEBI registered. Please consult your financial advisor before taking any trade.
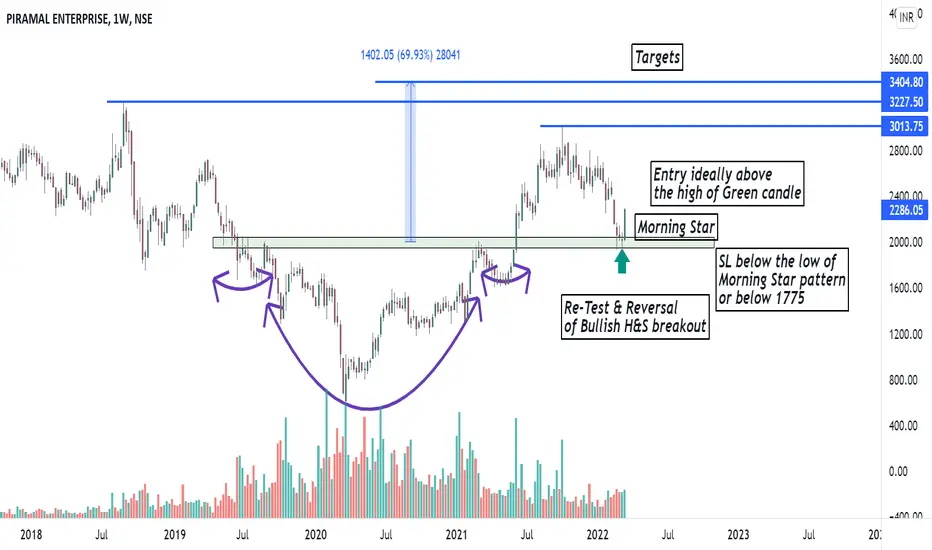
PEL - Retest & Reversal of Head & Shoulder Pattern - Swing tradeThe analysis is done on weekly TF hence price may take few weeks to few months in order to reach the targets.
Trade setup is explained in image itself.
The above analysis is purely for educational purpose. Traders must do their own study & follow risk management before entering into any trade
Checkout my other ideas to understand how one can earn from stock markets with simple trade setups. Feel Free to comment below this or connect with me for any query or suggestion regarding this stock or P
PLong
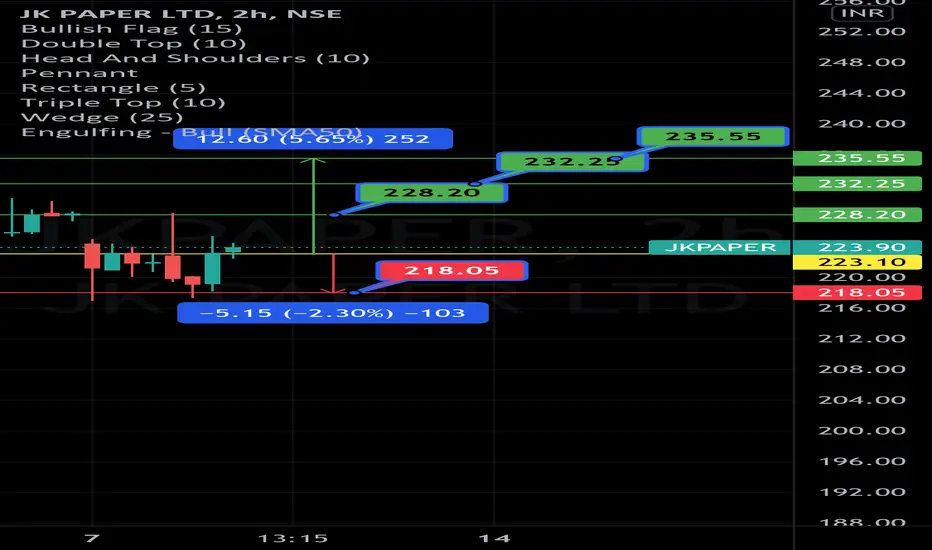
Expecting a Bullish Move in JK PAPERAs per the 2 Hour Chart of JK PAPER, we have witnessed a Formation of a “Morning Star” Pattern on the downside levels.
Therefore, we are expecting to witness a bullish momentum in the stock in the upcoming trading sessions. Wherein it is being expected to face a resistance initially at around the levels of 228.20, 232.25, and 235.55. Whereas, on the other hand, on the downside levels, the stock may face a support at the level of 218.05, on closing basis.
Closing Price (as on 08.03.22) : 223.1
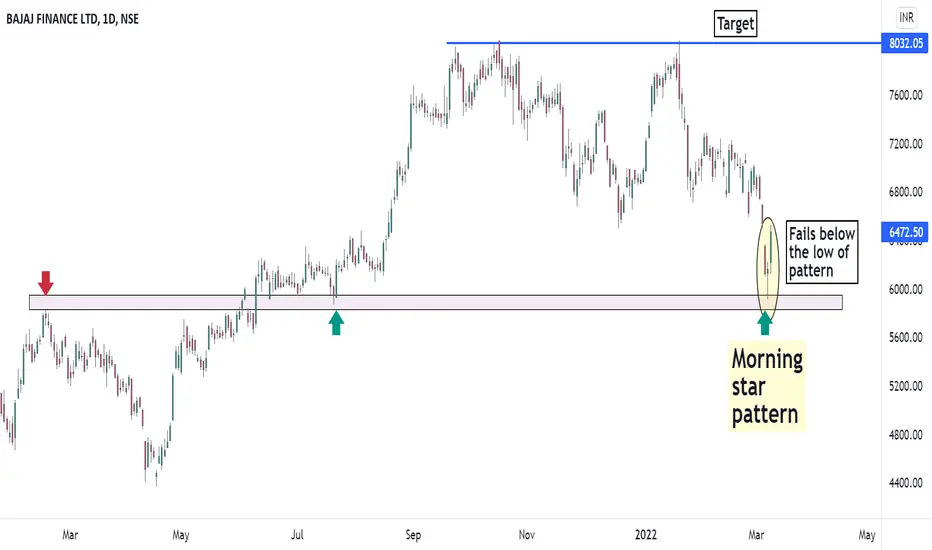
BAJAJ FINANCE - RETEST & REVERSAL - MORNING STAR PATTERNThe analysis is done on daily TF hence price may take few weeks to few months in order to reach the targets.
Trade setup is explained in image itself.
The above analysis is purely for educational purpose. Traders must do their own study & follow risk management before entering into any trade
Checkout my other ideas to understand how one can earn from stock markets with simple trade setups. Feel Free to comment below this or connect with me for any query or suggestion regarding this stock or Pr
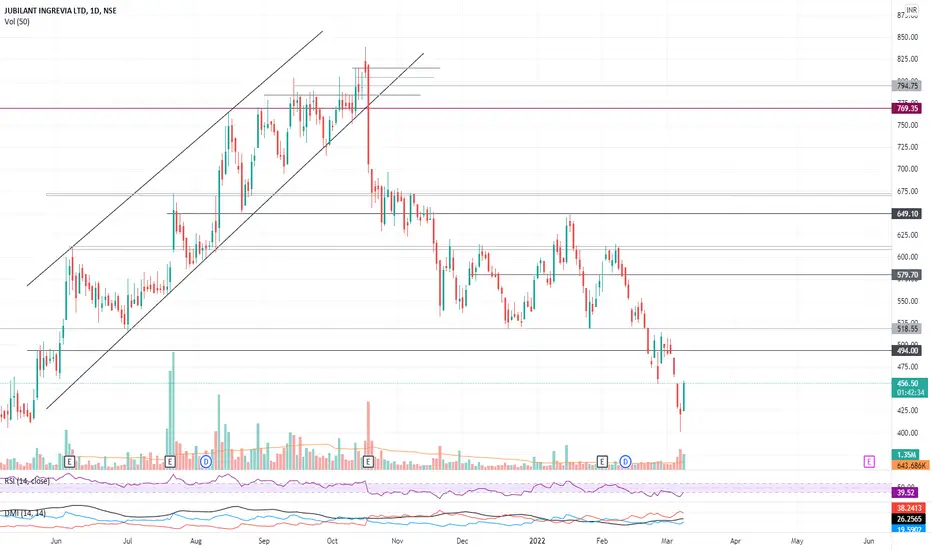
JUBILANT INGREVIA - LONG- Recent downside move of 34.33%
- ADX turning downwards (both adx & -ve DMI)
- "Morning Star" pattern on Daily chart with adequate volumes
- RSI at level 40 from below to upwards
Today's closing above the bearish candle on 14 march'2022 , should trigger an up-move and the target can be 513-518 levels (13%)
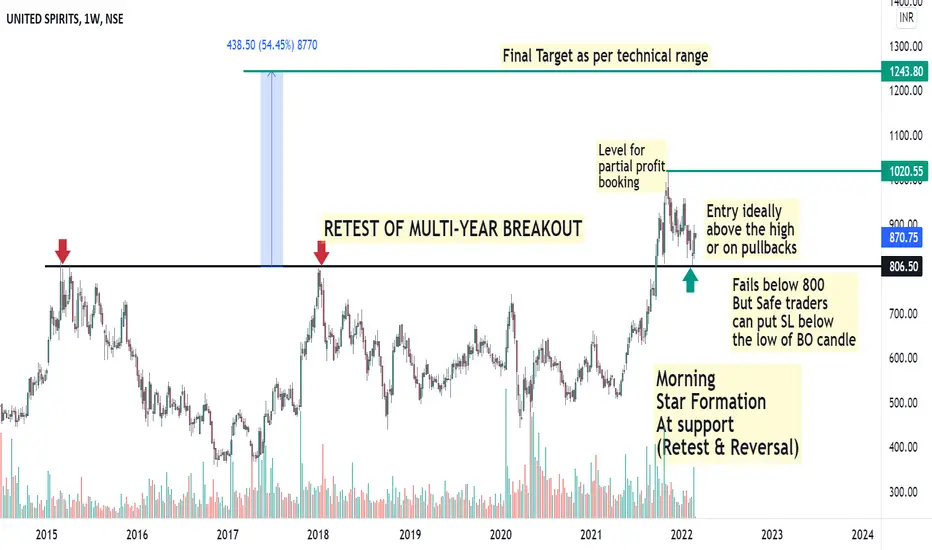
MCDOWELL - Multi year breakout Retest Structure + Morning Star The analysis is done on weekly TF hence price may take few weeks to few months in order to reach the targets.
Trade setup is explained in image itself.
The above analysis is purely for educational purpose. Traders must do their own study & follow risk management before entering into any trade
Checkout my other ideas to understand how one can earn from stock markets with simple trade setups. Feel Free to comment below this or connect with me for any query or suggestion regarding this stock or P