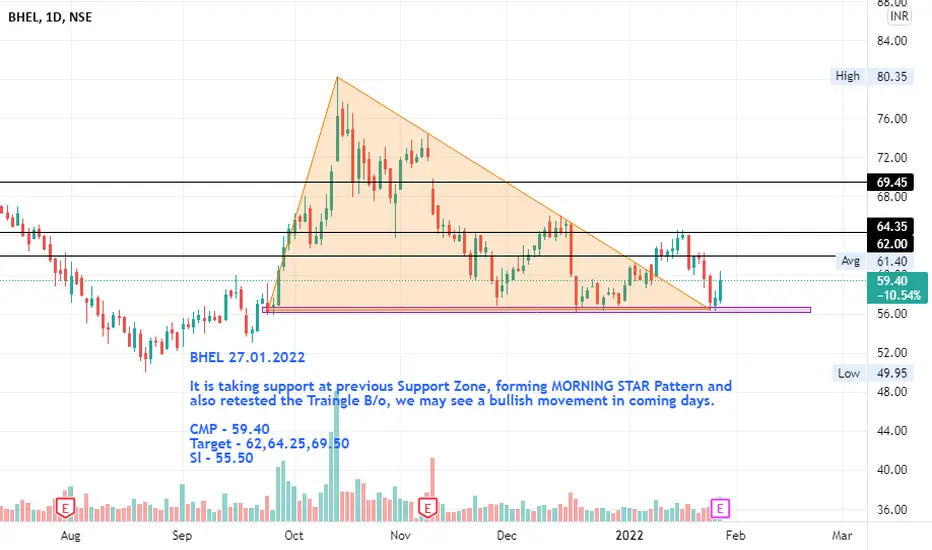
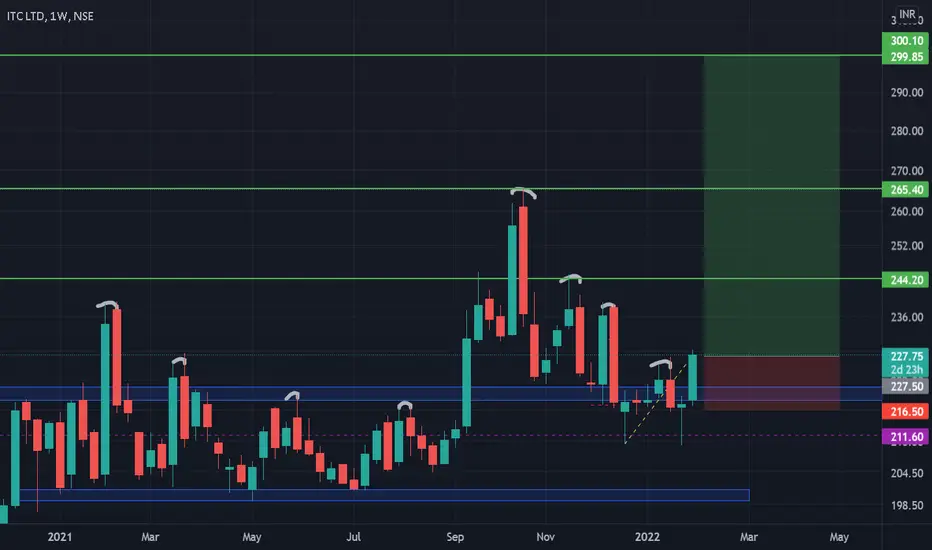
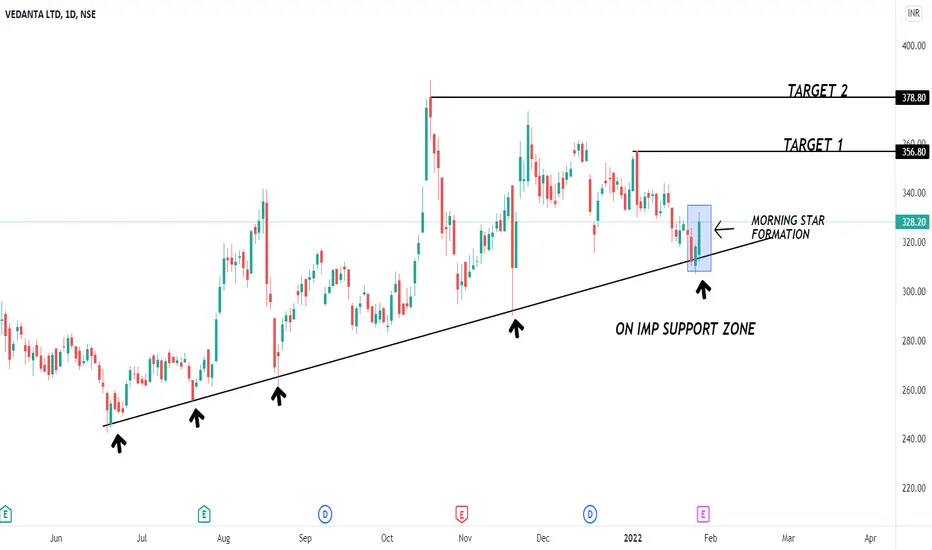
Morning Star
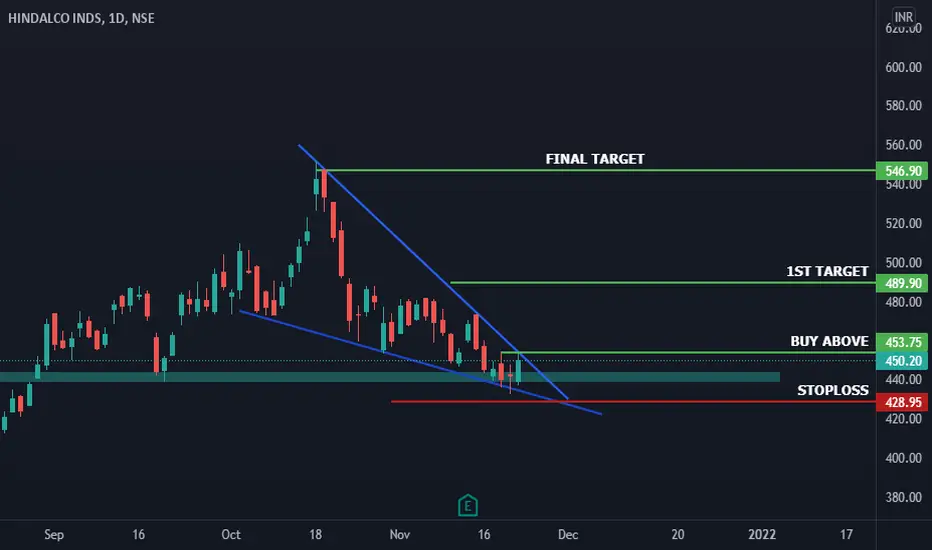
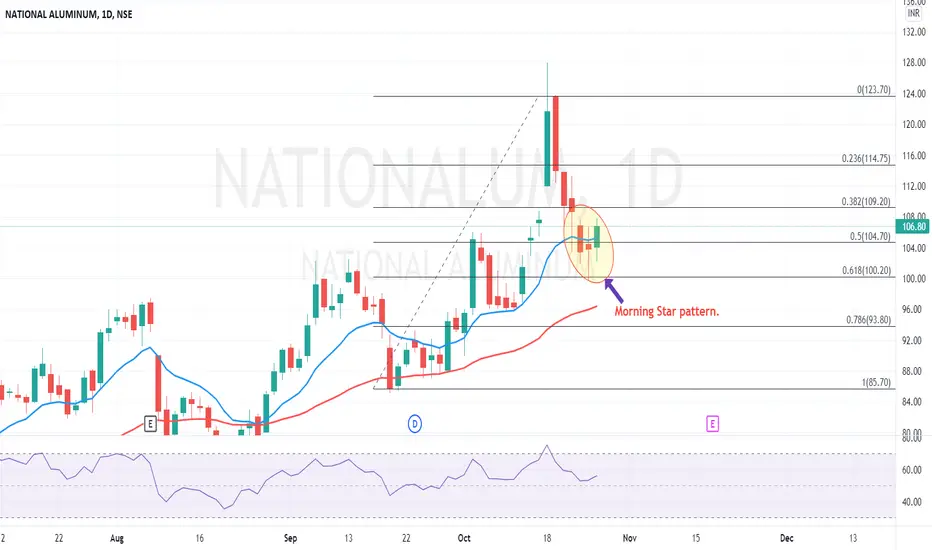
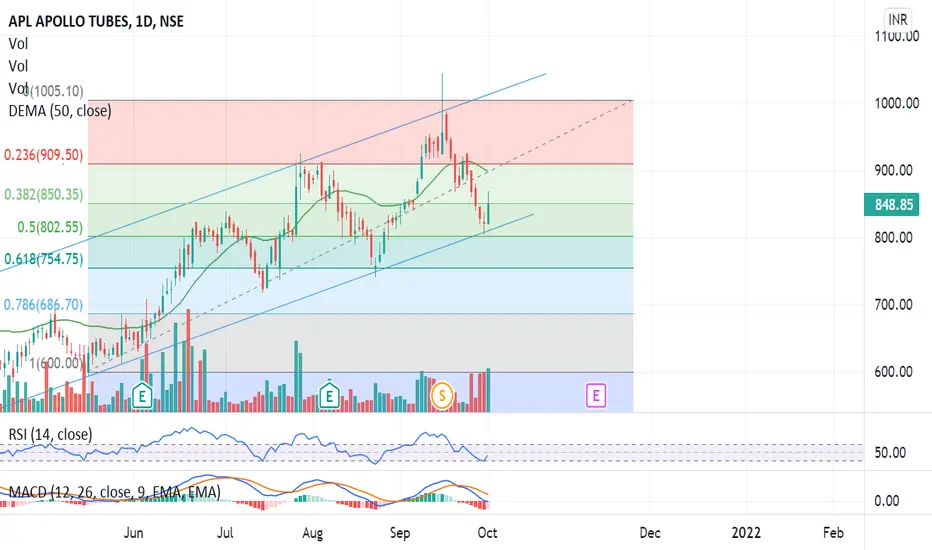
Only for study purpose ... Price was making a lower low from last weeks but finally, price one last low brokes out with a strong green candle also on daily time frame.
Some reasons for taking the trade :
1. Price-making historic pattern means breaking out of the last lower low with a strong green candle.
2. Morning star is there with engulfing candle and also hammer which is known as rejection candle.
3. There is also a neckline breakout of the Double bottom.
4. Price rejected two times .618 level of Fibonacci retracement
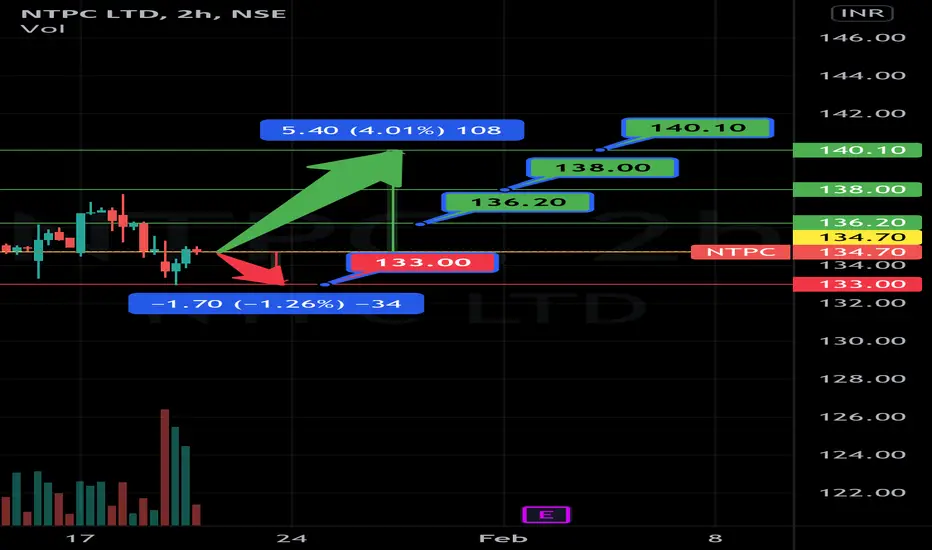
Expecting To Witness a Bullish Move in NTPCAs per the 2 Hour Chart of NTPC LIMITED, we have witnessed a Formation of “Morning Star”.
Therefore, we are expecting to witness a bullish momentum in the stock in the upcoming trading sessions. Wherein it is being expected to face a resistance initially at around the levels of 136.20, 138, and 140.10. Whereas, on the other hand, on the downside levels, the stock may face a support at the level of 133, on closing basis.
Closing Price (as on 19.01.22) : 134.70
Disclaimer: No financial inform
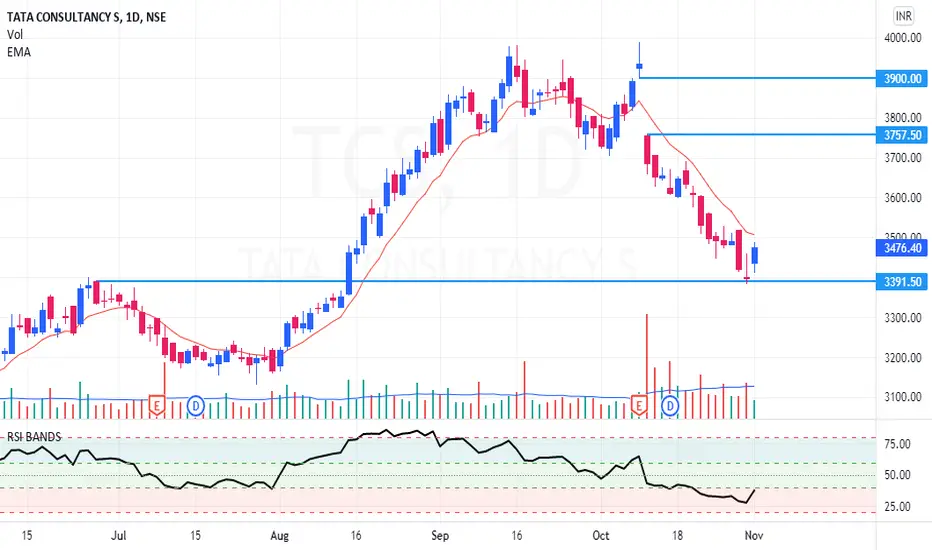
Morning Doji Star in TCS.After the result date TCS has fallen with a gap down, since a downtrending market is in place. With a long bearish candlestick, which is followed by a Doji Star shows an indecision and gives a sign of possible trend reversal. Just like the regular Morning Star, confirmation on the third day fully supports the reversal of trend. This type of Morning Star can represent a significant reversal. Therefore it can be considered as more significant than the regular Morning Star pattern. Aggressive trade
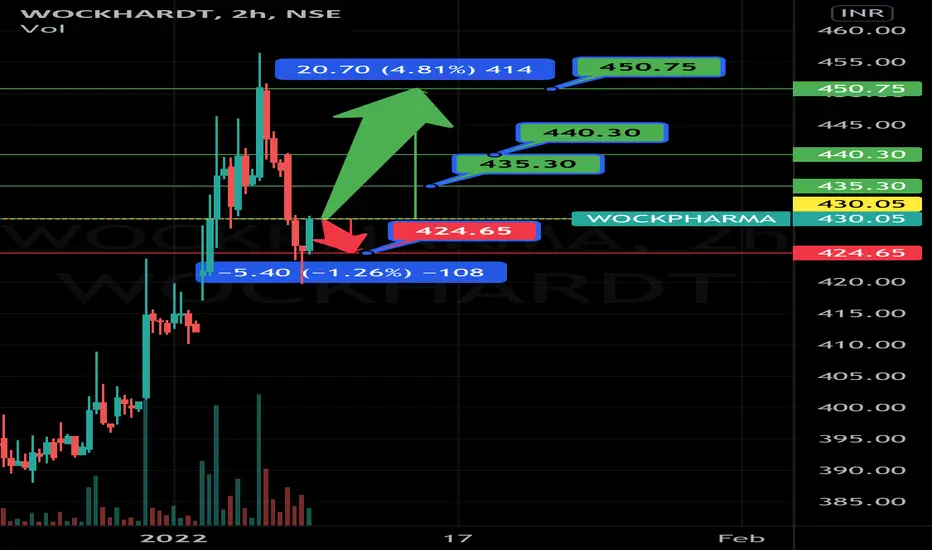
EXPECTING A BULLISH MOVE IN WOCKPHARMA As per the 2 Hour Chart of WOCKHARDT LIMITED, we have witnessed a Beautiful Formation of “Morning Star” on the chart.
Therefore, we are expecting a bullish momentum in WOCKPHARMA in the upcoming trading sessions. Wherein it is being expected to face a resistance initially at around the levels of 435.3, 440.3, and 450.75. Whereas, on the other hand, on the downside levels, the stock may face a support at the level of 424.65, on closing basis.
Closing Price (as on 07.01.22) : 430.05
Disclaim
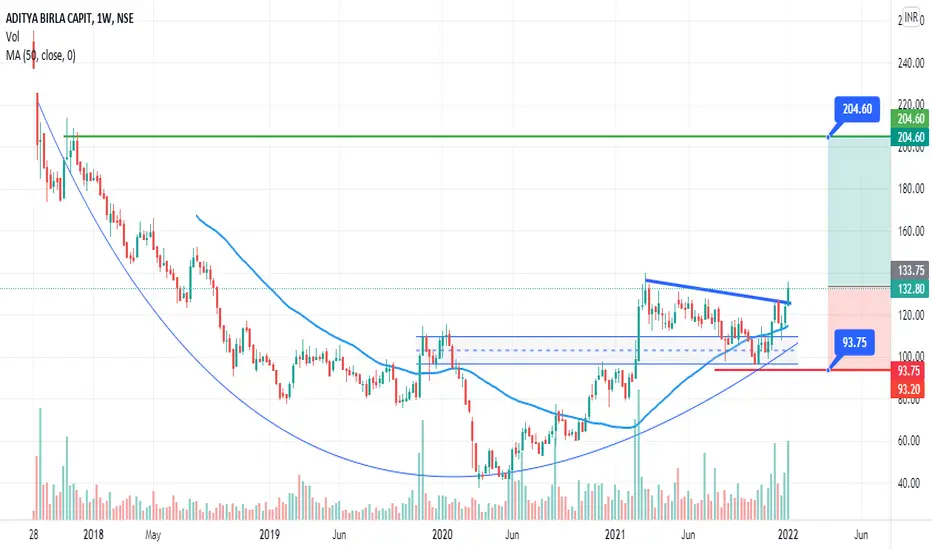
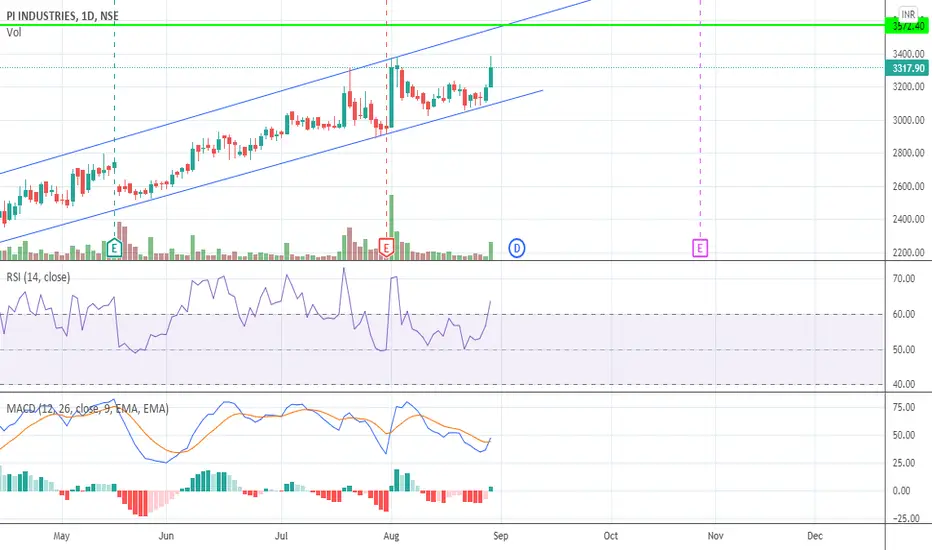
ABCAPITAL:WEEKLYBUY: SUCCESSFUL RETEST # FINANCIALFOOTPRINTSA very smooth and curvy reversal of weekly trend.
A successful retest and breakout of previous high will give momentum to the stock.
MACD & RSI indicator is very positive.
Its above 20 & 50 MA.
I am very confident on this trade in a long run.
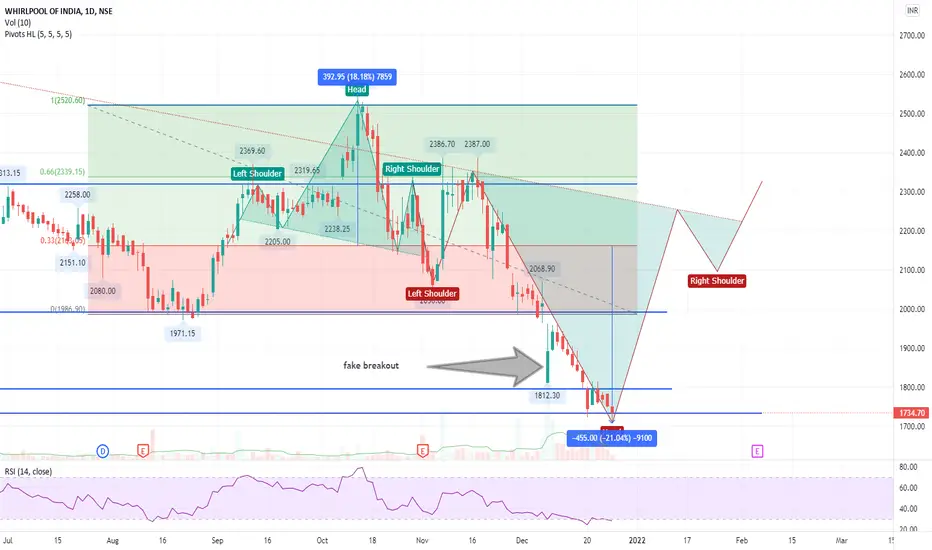
WHIRLPOOL - Hammer/Morning star has formed (12/27)WHIRLPOOL has formed hammer today, if the price moves up then the formation of Head for inverted H&S should form and the price might move up again.
+Deliver is 35.76%
+RSI is weak but if there is a strength in next two days in RSI the price should move up to complete the formation of Head.
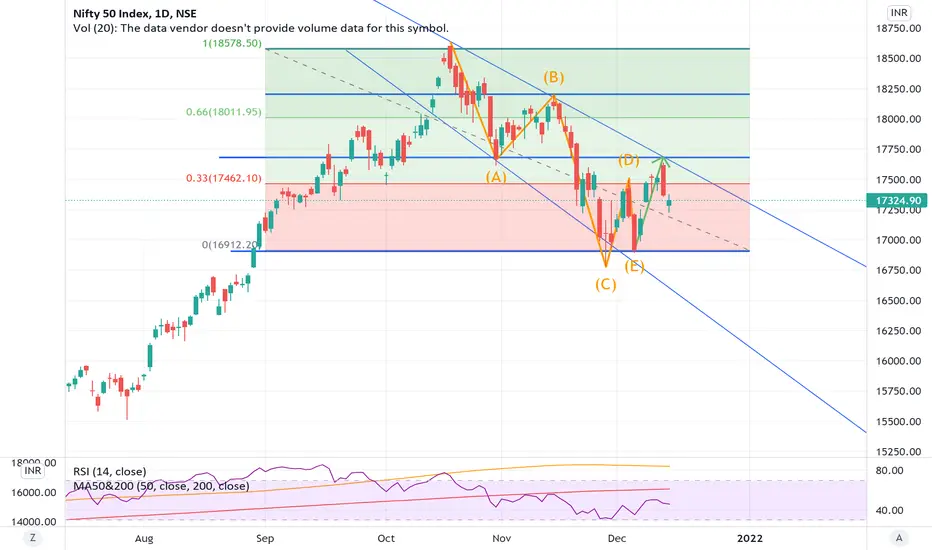
todays nifty50 - prediction - morning starnifty50 has formed a morning star which could state tomorrow nifty might endup green, however be careful while trading as the gap is still not filled if tomorrow ie 15-12-2021 the market remains in green then on Friday there could be a downtrend and gap filling might happen.
gap filling is not necessary will happen instantly it may take weeks or months but chances are very high for price to come down and fill up the gap..
lets wait and watch
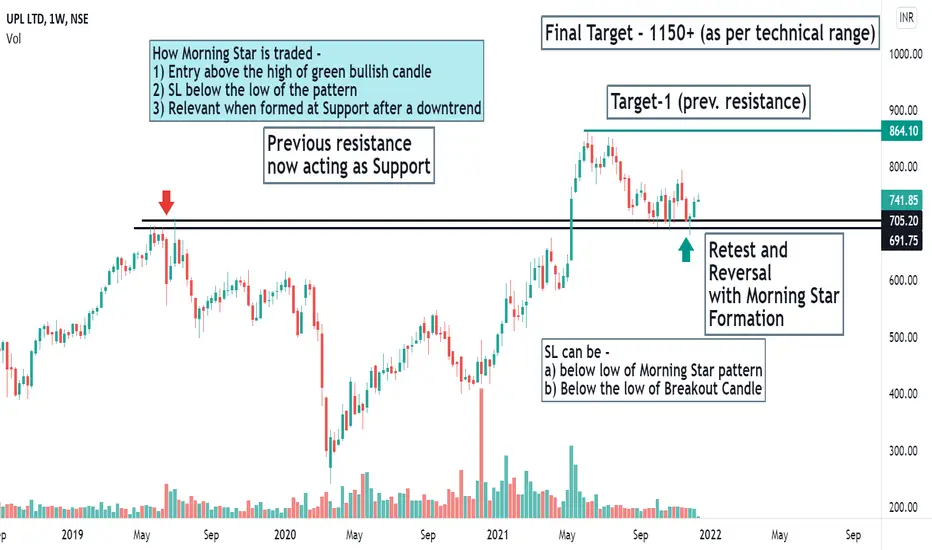
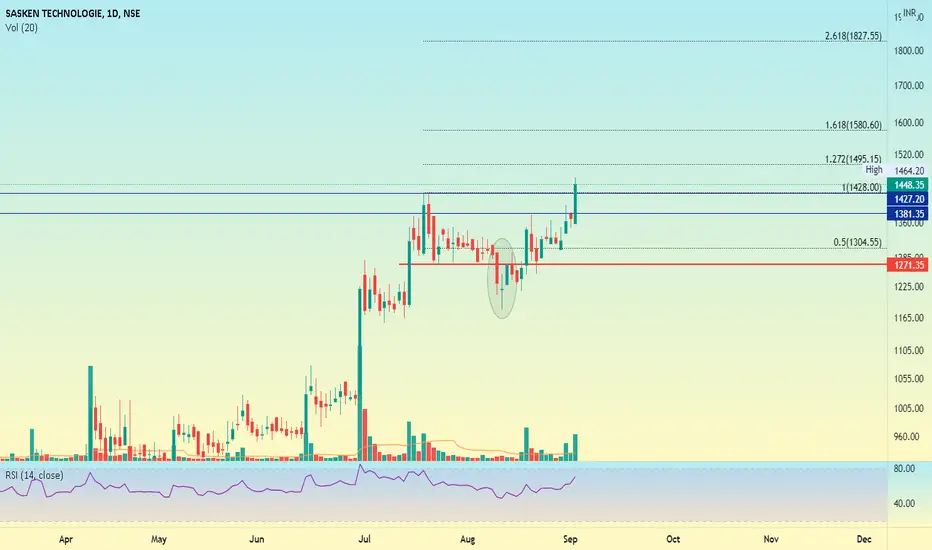
How to Trade Morning Star Formation - UPL - Swing TradeThe analysis is done on weekly TF hence price may take few weeks to few months in order to reach the targets.
Trade setup is explained in image itself.
The above analysis is purely for educational purpose. Traders must do their own study & follow risk management before entering into any trade
Checkout my other ideas to understand how one can earn from stock markets with simple trade setups. Feel Free to comment below this or connect with me for any query or suggestion regarding this stock o
DLF (Daily) - Bullish Flag DLF (Daily) - Bullish Flag
4th wave seems to be ending, making way for the 5th wave
Stochastic 14,3,3 is in positive crossover
+DI has just gone above the -DI in the Directional Movement Index (DMI) indicating the start of an uptrend
However before going long / buying, wait for the following to become a reality:
(1) Breakout of the resistance line (drawn in red)
(2) RSI to go over 60 and enter the overbought zone
(3) ADX to become uptick (though it is above 15 as of now)
Seems very likel
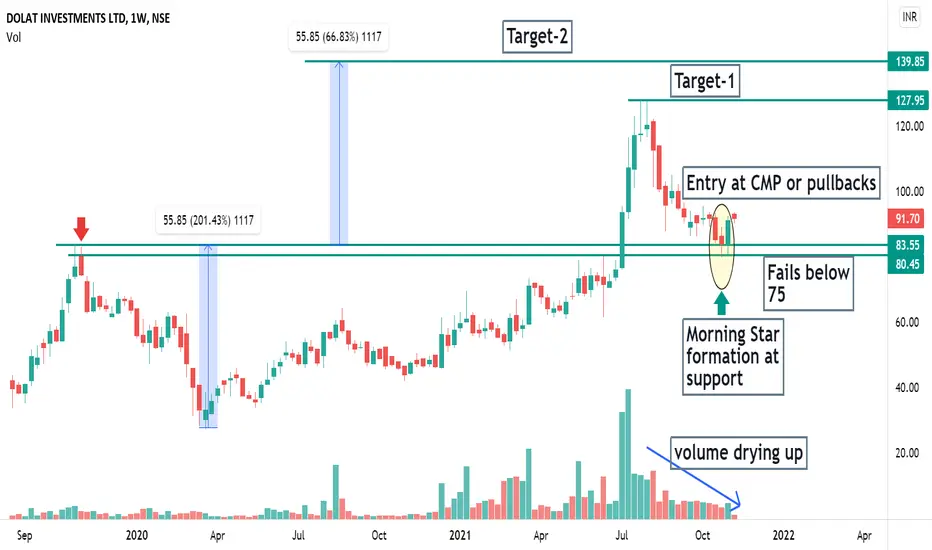
DOLAT - Retest Structure - Morning Star - Swing TradeThe analysis is done on weekly TF hence price may take few weeks to few months in order to reach the targets.
Trade setup is explained in image itself.
The above analysis is purely for educational purpose. Traders must do their own study & follow risk management before entering into any trade
Checkout my other ideas to understand how one can earn from stock markets with simple trade setups. Feel Free to comment below this or connect with me for any query or suggestion regarding this stock o
DLong
SUPPORT AND RESISTANCE WORKS VERY WELL - EDUCATIONAL PURPOSEOnly for Educational purpose.
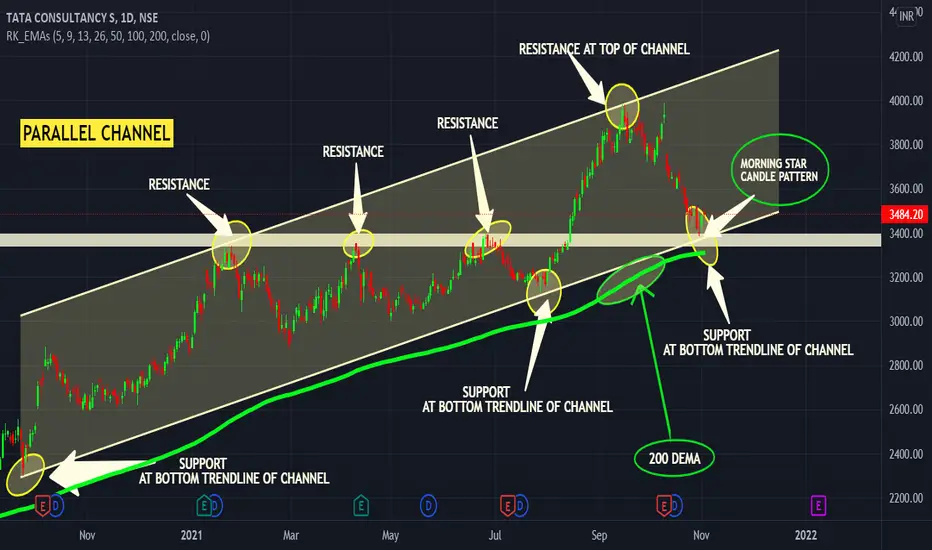
This stock TCS is right now in good area where buying could be initiated, we have noticed that the price is right now at lower point of parallel channel in daily time frame, where demand zone is also co-incidentally matches and 200DEMA is also at same level of that area zone, but its not confirmed yet to go long, if any type of bullish candle pattern is seen in lower time frame like 30 minutes or in hourly then it could be an opportunity to go long after checking a
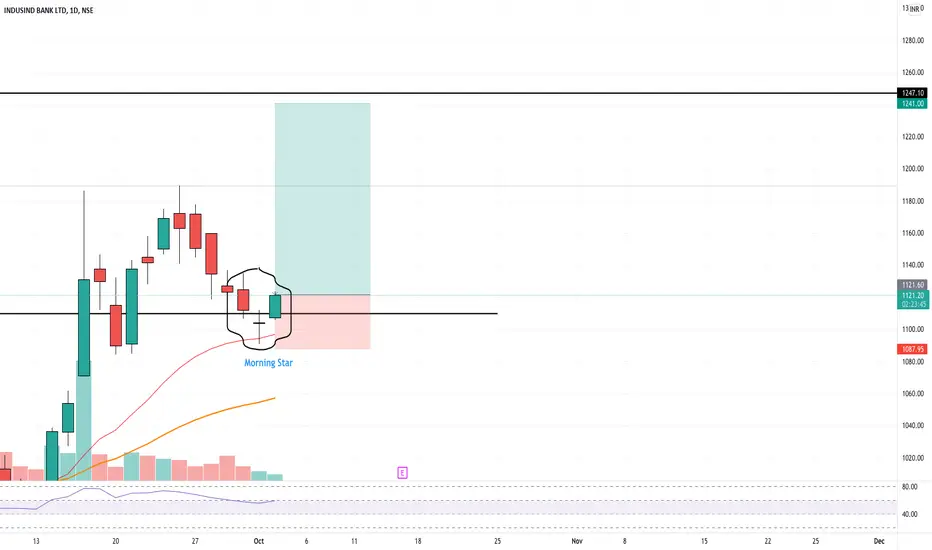
Morning star formation at the retest levelsIndusind bank is behaving no different than the other performers in banking. There is a morning star formation at the retest levels of the breakout that happened a few days ago.
I categorize this candlestick as a buy setup and this can give 10% in the coming days. SL should be at 1087 with a target of 1240-1250. This is a good RR setup of 3.5
Kindly note that this is not a recommendation and only for educational purposes. Consult your financial advisor before investing.
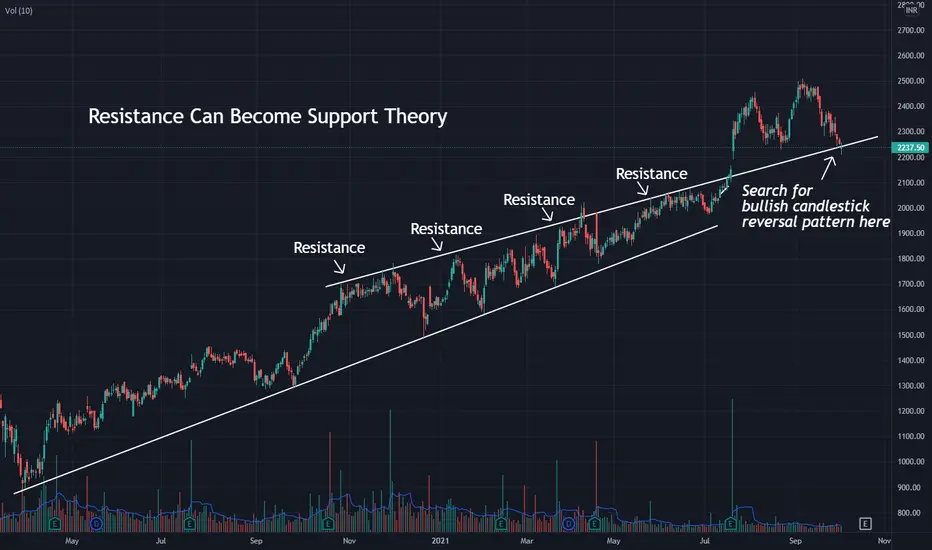
RESISTANCE CAN BECOME SUPPORT TOO !It is old theory of support and resistance that support can become resistance and vice versa. So if we apply that theory here on ACC , it can be a good entry as stock is near the resistance line.
All we need to do is look for a bullish reversal candlestick pattern.
Some of bullish reversal candlestick patterns are Morning star, Bullish engulfing , Hammer , Bullish Harami etc.
These type of entries are best because it provides us good Risk to Reward.
Target can be around 2428 levels , Which is go
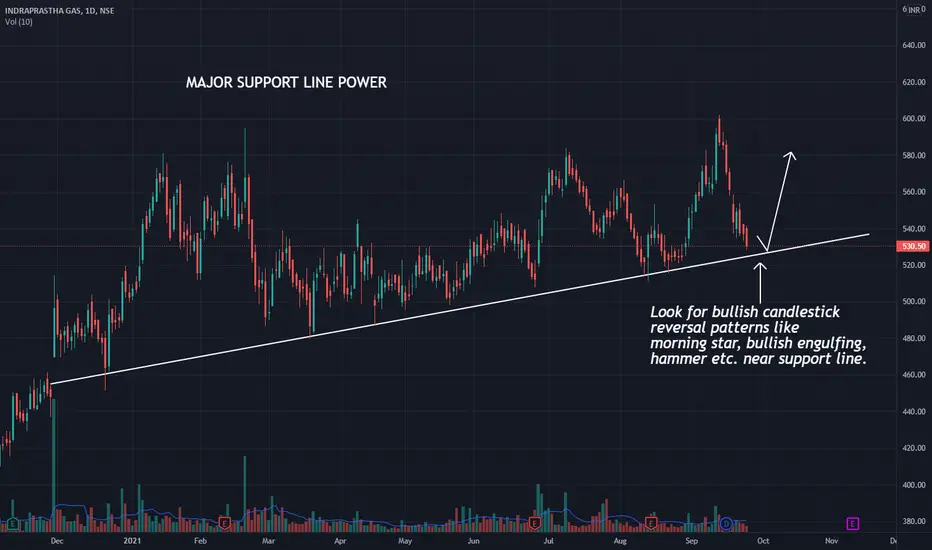
IGL RESPECTING ITS MAJOR SUPPORT LINE !IGL is clearly seen respecting its support line in the past.
This can be a good risk reward ratio entry, wait for formation of any bullish candlestick pattern on support line like morning star, bullish harami, bullish engulfing , hammer etc.
After completion of pattern long trade can be taken here.
Note : If support trend line breaks downside, avoid taking trade in this stock.
Also note that this analysis was done by me only for educational purpose , feel free to share your views.
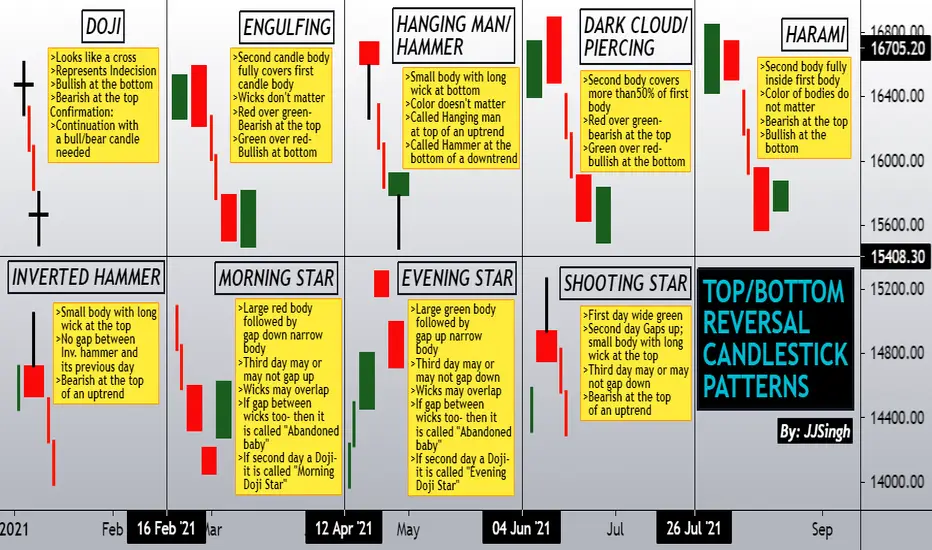
TOP/BOTTOM REVERSAL CANDLE PATTERNSHi
Its been a while since my last post. In this post I have represented selective candlestick reversal patterns.
In a candlestick, "body" represents the distance between candle OPEN and CLOSING price. Whereas "wicks" represent the entire range of the candle from TOP to the BOTTOM.
In most of these patterns only bodies are important. There are no conditions for wicks unless specifically mentioned like in abandoned baby star and (first two candles of) shooting star pattern. In an abandoned baby
Banknifty - Morning Star Pattern 10 AugWhat Does Morning Star Mean?
A morning star is a visual pattern consisting of three candlesticks that is interpreted as a bullish sign by technical analysts.
A morning star forms following a downward trend and it indicates the start of an upward climb.
It is a sign of a reversal in the previous price trend. Traders watch for the formation of a morning star and then seek confirmation that a reversal is indeed occurring using additional indicators.
The opposite pattern to a morning star is th