Indus Tower – Long Trade SetupIndus Towers has triggered a bullish breakout above a prior supply zone supported by strong momentum and confluence with the 21-day EMA.
🔍 Trade Thesis:
- Breakout Confirmation: Price has decisively breached the previous supply zone, indicating a shift in market structure.
- EMA Confluence: The breakout aligns with the 21 EMA (₹426.41), reinforcing trend strength. The 50 EMA serves as a deeper support and stop-loss buffer.
- Risk-Reward Setup: Defined stop-loss below the 50 EMA targeting a 1
Moving Averages
ATH Resistance to Support in NETWEB3000 level has been acting as resistance in 2024. Later it was broken in 2025 and now we see retest of the same level.
There is good buying interest seen at this level making it Low risk entry.
Also this support is near weekly 20sma which makes it high probability trade.
SL targets on chart. Note that holding time can be 8 to 20 weeks.
Maruti Suzuki - A Solid OpportunityMaruti Suzuki has entered into short term bearish mode.
It is down nearly 7% from the top in last 2 weeks, confirming a strong downside momentum.
Structure: Playing Wave C, of 4 in short term.
Trend: Bearish
Also a clear divergence in RSI indicator at the top
Trade Setup: Short
Target: 15270/-
StopLoss: 16500/-
Notes
This is a classic Elliot wave pattern. Wave C generally moves fast.
⚠️ Disclaimer: Not financial advice. Manage risk properly.
NIFTY Faces Pressure: Can 24,300 Hold?NIFTY has turned weak after falling around 2.5% on the weekly chart. The index has made a double top near 26,250, which usually means the market is finding it hard to move higher from that area.
On the weekly chart, the candles look bearish. NIFTY is currently holding near an important support around 25,000 (50 EMA). If this level breaks, the market may move lower towards 24,300 and even 23,900.
On the daily chart, NIFTY is trading below all major moving averages (20, 50, 100 & 200 EMA). In th
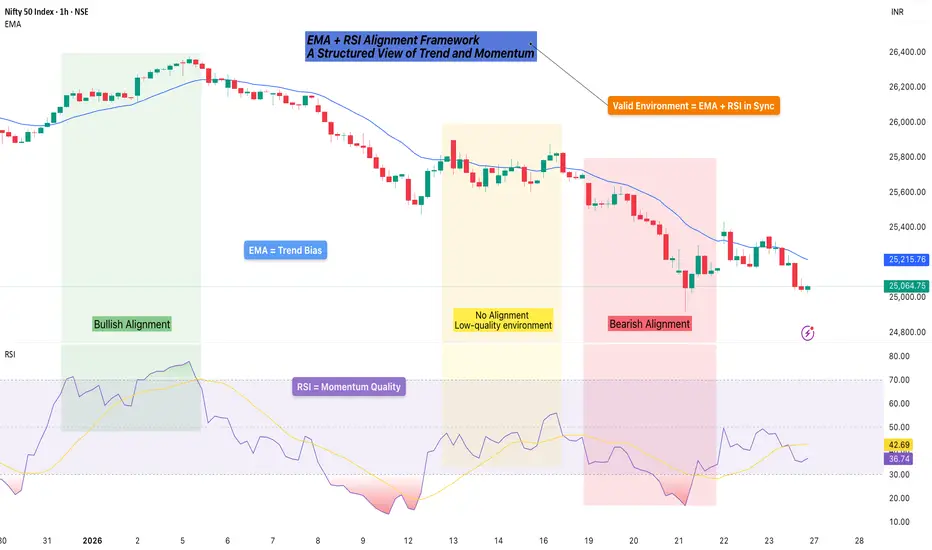
Evaluating Trend and Momentum Alignment with EMA & RSI🔎 Intro / Overview
This idea presents an EMA + RSI Alignment Framework designed to help traders understand market conditions rather than chase price movements.
Often, traders feel they have “missed the move”.
In most cases, this happens not because of late entries, but because market context was not clearly defined beforehand.
This framework focuses on evaluating trend direction and momentum quality first, so traders can better understand when conditions were supportive, unclear, or weakening
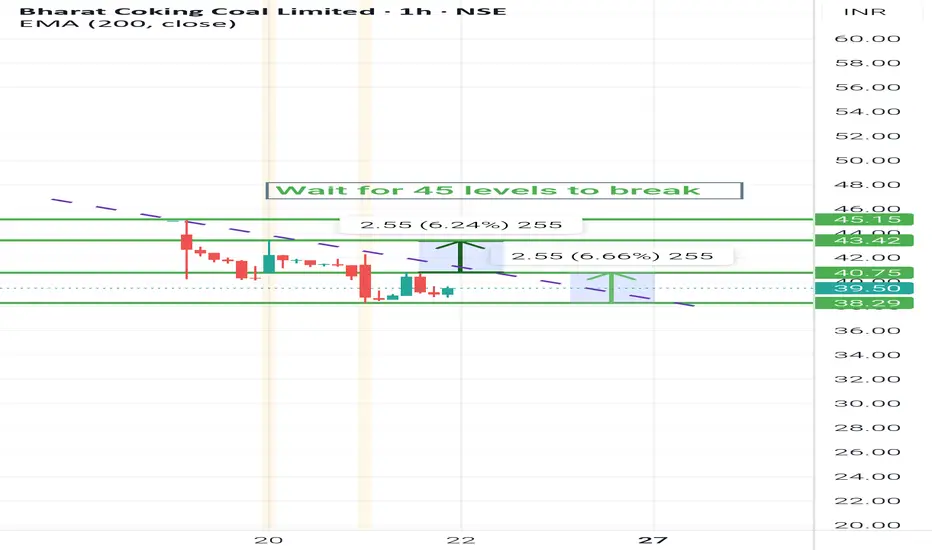
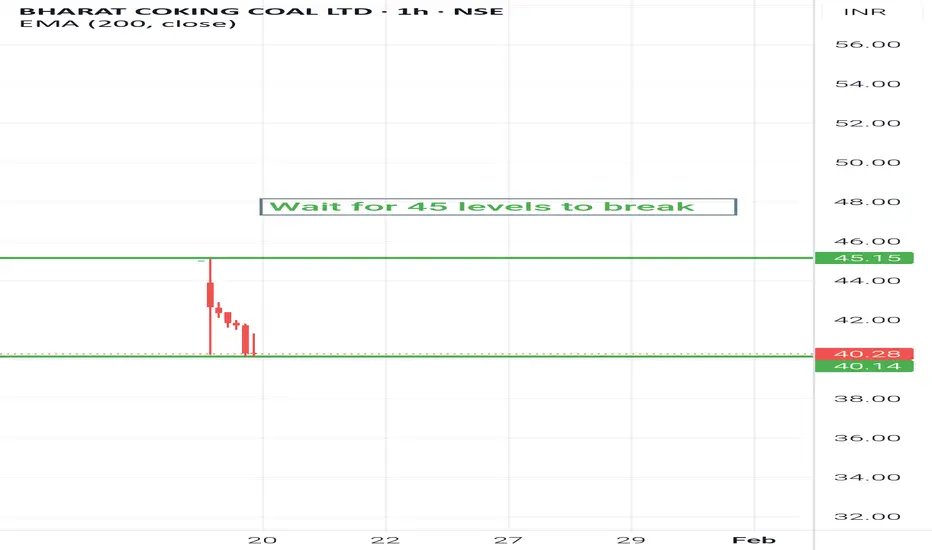
Bccl ipo day high 45 is next level of rally Today bccl made a debut and gave nearabout 90-100% of returns to there lucky investors.
Stock price made a high of 45 and then shown profit booking towards 40 rs level.
Now 45 is a good resistance, once that is taken out we may see more upside.
But looking at today's move after listing more profit booking and consolidation is anticipated.
Also looking at fundamentals stock is now trading near to 8-9 pe multiple which is close to it's parent coal India so doubling and all is not expected.
L&T: Wave 5 Exhaustion Signals a Corrective PhaseA clear 5-wave impulse has played out, with Wave 3 showing classic overbought RSI behavior while still respecting Elliott Wave rules.
Wave 5 ended with RSI divergence , signaling exhaustion near the highs.
Price has now slipped below the 100-DMA , reinforcing the view that the advance has likely stalled and a corrective phase is underway. The decline should unfold in at least a 3-wave structure . Importantly, Wave (a) may not be complete yet . Despite RSI reaching oversold levels, there
CAMS - Descending triangle + Head and Shoulders PatternA clear Head and Shoulders structure has formed over the recent months. The price has just breached the neckline support (horizontal dotted teal line) around the ₹720–₹730 zone.
The recent price action shows a breakdown below the neckline with a red candle, suggesting that the bearish momentum is gaining traction.
Also stock is trading below 200 EMA, which is a strong downward movement signal.
Traders should watch for a potential "retest" of the neckline before the continuation of the downwar
Dr reddy short idea
Short Trade Setup Description
This setup is based on a clean break of the prior pivot low around the level ₹1,246.61, confirming bearish momentum. Defined short entry zone just below ₹1,241.09, aligning with a weekly supply zone from the higher timeframe.
The zone confluences with a weekly 50 EMA also.
• 🔻 Entry: Short on retracement into the supply zone
• 🛡️ Stop Loss: Above the zone with a buffer of 15% DATR
• 🎯 Target: 1:3 Risk-Reward, aiming toward the ₹1,200 region
• ⚠️ Caution: Profit b
Market View & Trade PlanBased on current structure, NIFTY is trading inside a rising channel on both 5-minute and 15-minute timeframes, with short-term price action forming a potential bullish cup-and-handle pattern on the 5-minute chart. Momentum indicators and price behavior suggest a bias toward the upside as long as the index holds above the channel support zone. A buy-on-breakout can be considered above 26,175–26,185, with an initial stop loss below 26,110 (below the handle low and channel support). On confirmatio
Voltas Bullish viewThe 3% move created by Voltas, has changed the trend of the stock.
The demand zone at 1390 level and a trap zone at 1365 levels considered can be a bullish opportunity with the stock beginning to make up-move and at low range on higher time frame.
The move created has broken a prior pivot too.
Also the demand zone created lies on an area of 21 and 50 DEMA.
Torrent Power Ltd Bullish viewTorrent Power has created a 5%+ move followed by change in trend.
The stock has closed above EMA21/50 marking it as a bullish sign.
With such change in trend there can be 2 scenarios which can exist.
Scenarios1: The stock retraces to the demand zome formed at 1318 levels. In such a retracement going long would be a opportunity.
Scenario 2: A small daily inside candle if formed on the daily ( inside candle meaning a smaller range candle which has a high low with the range of previous candle),
LTIMThis analysis is for educational purposes only. LTIMindtree (LTIM) stock trades within a defined channel, recently finding support at the lower boundary and reversing upward, now positioned above key moving averages including the 50-150-200. It also holds above the channel's support level, signaling a bullish trend with potential for further upside; always use a stop-loss to mitigate risk
SAIL - Buy - Technical Analysis# Steel Authority of India Limited (SAIL) - Technical Analysis Report
Current Price: 136.92
Timeframe: Weekly Chart Analysis
Technical Setup Overview
SAIL is presenting a compelling technical picture with multiple bullish indicators aligning for a potential significant upward move. The stock is currently trading within a well-defined rising wedge pattern and has recently formed a **Hidden Divergence** on the weekly chart - a classic trend continuation signal.
Key Technical Observation
NMDC Positional Trading IdeaParallel channel:
The asset is currently trading within a defined parallel channel .
Selling pressure at resistance:
A high-volume bearish engulfing candle has formed at the channel's upper boundary, indicating significant selling pressure.
Two potential setups:
Price action is being monitored for two distinct trading opportunities.
Long entry:
A decisive breakout and close above the 84 price level would trigger a long position entry
Retracement opportunity:
Alternatively, a retrac
Solana Technical Reversal: MA Compression Resolves to the UpsideSolana is trading around 126 levels and there is a support which is being respected around 125 levels.
For last few weeks, no considerate candle is there. Only doji are being formed which shows the sideways moment in the charts.
If the market cycle changes, turning bullish, an entry can be made above 127 levels expecting a 10-11% movement in the crypto.
Major trend is bearish, Minor trend sideways.
The major support is around 100-110 level zone and there is not much of fall to capture as it
Resistance to support in Granules 540 levels have acted as good level of support which acted as resistance and now again as support.
Stock has taken support and seems ready to test all time high levels.
20 week SMA is also acting as support. Reward to risk ratio is working out favorable at 2.5.
With SL of about 7.5% position size should be controlled. Also this being weekly trade it can take 2 ~ 3 months to play out.