Bitcoin at Support: Bounce Likely, Trend Still WeakBitcoin has been sliding steadily and has now broken its first major support near 103k. The latest drop completed a clear A-B-C decline, with the final C-wave forming an ending diagonal — a pattern that often signals exhaustion at the end of a move. That’s why the selling pressure slowed as price entered the current demand zone.
Oversold Conditions
The RSI on the daily chart has dropped into deeply oversold territory. This is typically where Bitcoin produces a reaction bounce. It doesn’t conf
Moving Averages
Sequent (D): Strongly Bullish, Fundamentally-Driven BreakoutThe stock has confirmed a major breakout from a 3-year structural turnaround. The move is backed by a massive earnings beat, high-conviction volume, and aligned indicators across all timeframes.
📈 1. The Long-Term Structure (The Turnaround)
- The Crash (2021-2023): After hitting its All-Time High (ATH) in June 2021, the stock entered a brutal correction, falling ~81% to form a base around ₹62 in February 2023.
- The Recovery: Since March 2023, the stock has been in a steady uptrend,
Rico Auto (D): Strongly Bullish, 20-Year BreakoutThis is a high-conviction, "blue-sky" breakout setup. The stock has shattered a resistance confluence that includes a 20-year-old horizontal ceiling . This technical move is powered by a massive fundamental turnaround in the recent quarter.
🚀 1. The Fundamental Catalyst (The "Why")
The breakout is not random; it is a direct reaction to the company's Q2 FY26 Earnings report (announced recently):
- Net Profit: Nearly tripled (surged ~200-300%) compared to the previous year.
- Revenue:
JTEKT India Technical AnalysisHere's a comprehensive TradingView report for JTEKT India Limited:
Current Price:160.90
📊 TECHNICAL SETUP OVERVIEW
JTEKT India is displaying a compelling technical structure within a well-defined ascending channel pattern that has been in play since the 2020 lows. The stock is currently consolidating after a significant rally and appears to be setting up for the next leg of movement.
KEY TECHNICAL OBSERVATIONS
1. Channel Pattern Analysis:
- Long-term Ascending Channel: The stock has been respe
Persistent Technical Analysis#Persistent Systems Limited - Technical Analysis
Chart Overview
**Timeframe:** Weekly (1W)
**Current Price:** 5,708.20
Technical Setup
Trend Analysis
The chart displays a compelling technical setup based on higher highs and higher lows pattern analysis. After a significant correction from previous highs, the stock has formed a strong base and is showing signs of trend reversal.
Key Observations
RSI Classic Divergence
The Relative Strength Index is displaying a classic bullish divergence
Thyrocare (W): Strongly Bullish, Multi-Year BreakoutBased on Weekly Timeframe, Logarithmic Scale
This is a textbook, high-conviction breakout. The stock has decisively broken a 4-year consolidation, backed by strong fundamentals and a powerful confluence of high-timeframe technical indicators.
📈 1. The Multi-Year Setup
- The 2021 Peak: After its ATH in June 2021 (at ~₹1,465 ), the stock entered a steep, 2-year downtrend.
- The 2023 Bottom: This trend found its bottom in March 2023 .
- The Recovery & Base: Since then, the stock has
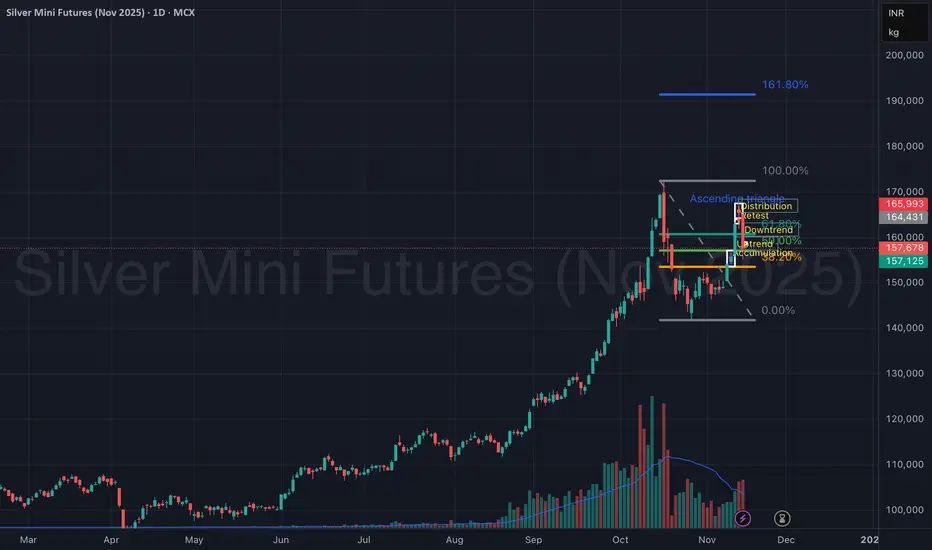
Silver Mini Futures (Nov 2025) – Accumulation to Distribution Silver Mini Futures on the 15-min chart clearly showcases a complete market cycle structure — transitioning from accumulation → uptrend → distribution → downtrend, providing an excellent study in price behavior and volume confirmation.
The move began with accumulation around ₹1,55,000, followed by a strong uptrend breakout, leading to a sharp rally. However, as price entered the ascending triangle near the ₹1,66,000 zone, momentum weakened, signaling distribution.
An exhaustion gap and a faile
Silver Mini Futures (Nov 2025) – Accumulation to DistributionSilver Mini Futures on the 15-min chart clearly showcases a complete market cycle structure — transitioning from accumulation → uptrend → distribution → downtrend, providing an excellent study in price behavior and volume confirmation.
The move began with accumulation around ₹1,55,000, followed by a strong uptrend breakout, leading to a sharp rally. However, as price entered the ascending triangle near the ₹1,66,000 zone, momentum weakened, signaling distribution.
An exhaustion gap and a faile
Data Patterns (D): Strongly Bullish, Fundamentally Driven BOThis is a high-conviction breakout event. The stock has decisively broken its 17-month angular resistance, driven by blockbuster quarterly earnings. All indicators are aligned, but the stock now faces its final horizontal resistance, which will determine the next major leg up.
🚀 1. The Fundamental Catalyst (The "Why")
Today's move is not speculative. It is a direct response to record-breaking Q2 2026 earnings :
- Revenue: Surged 238% year-over-year to ₹307.46 crore.
- Net Profit: Grew
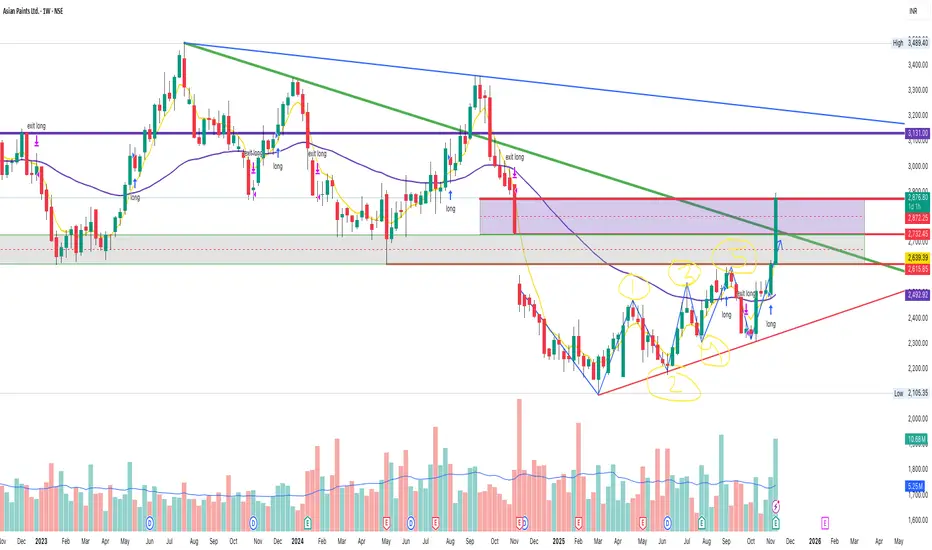
Asian Paints #Screener — Trend Reversal Before The Crowd Asian Paints Ltd (NSE: ASIANPAINT) has given a strong breakout from a long-term descending trendline with a sharp momentum candle.
This move signals a trend reversal after months of consolidation and price compression — supported by solid weekly volume.
Chart Structure #Screener
📌 Breakout from descending trendline
📌 Volume surge confirming buyer interest
📌 Price holding above 50 EMA on weekly
📌 Formation of higher lows since early 2025
📌 Strong bullish candle closing above key supply zone
Biocon (D): Strongly BullishThis is a high-conviction breakout in progress. A major fundamental catalyst (record-breaking earnings) is providing the "great momentum", driving the price to challenge a critical multi-year resistance. All indicators are aligned for a major new uptrend.
🚀 1. The Fundamental Catalyst
The primary driver for today's move is a blowout Q2 2026 earnings report :
- Net Profit: Surged 392% year-over-year.
- Revenue: Grew 20% year-over-year.
- Today's Action: The market reacted with a g
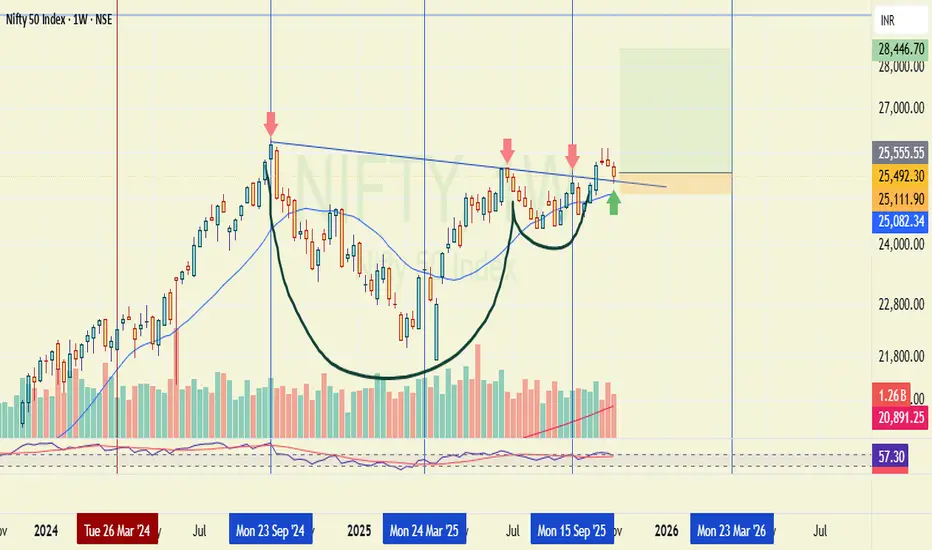
Possible Nifty Resistance to supportMultiple bullish confluences in Nifty at current level is seen.
1. There is good resistance to support possible in Nifty nr ATH.
2. Good cup and handle pattern.
3. There is support nr weelky 20sma.
If nifty closes above Friday's high than it will trigger buy which can take nifty to 29000+ levels.
We need to wait for next week close. Target and SL marked on chart.
Nestle India – Retest Before the Final Push HigherNestle India appears to be unfolding a clean five-wave impulsive structure. After a powerful Wave 3 rally backed by strong volume expansion, the stock has entered a typical mid-trend pause — a falling wedge consolidation representing Wave 4.
The correction has so far retraced near the 0.382 Fibonacci level around ₹1,247, perfectly aligning with the prior breakout zone from Wave 1 highs. This overlap suggests that the current dip is more of a healthy retest than a trend reversal.
As long as the
Bajaj Finserv rides a long-term bullish waveTopic Statement:
Bajaj Financial Services continues its evergreen bull run, supported by strong technical structure and improved affordability following its June 2025 stock split and bonus.
Key Points:
1. The stock is trading within a bullish up-trending channel, making it ideal for structured channel trading
2. Price rarely dips below the 200-day EMA, and such moments have historically been excellent long-term accumulation opportunities
3. Dips below the 50-day EMA offer favorable entry points
Lloyds Engineering Works Ltd – Ready to Blast from Support Zone!Lloyds Engineering is showing a textbook Inverted Head & Shoulders pattern on the weekly timeframe — a strong reversal formation that often precedes a major uptrend.
The support zone near ₹57–₹58 has held firmly for months, acting as a base for accumulation.
A bullish structure is clearly visible, with both shoulders aligning near the same horizontal support and increasing volumes hinting at smart money participation.
Once the stock decisively breaks above the ₹64 neckline zone, a powerful b
Eicher Motors Ltd – Distribution Zone & Golden Support Level (D)Eicher Motors is showing signs of short-term distribution after a strong uptrend. The price has been consolidating near the ₹6,850–₹7,050 resistance zone, which has acted as a supply area multiple times in recent sessions.
Following an extended rally from the breakout of the symmetrical triangle, the stock appears to be entering a cool-off phase — likely testing lower supports such as the golden zone (₹6,300–₹6,450) or mid support (₹5,900–₹6,000) before resuming its larger trend.
🎯 Key Levels:
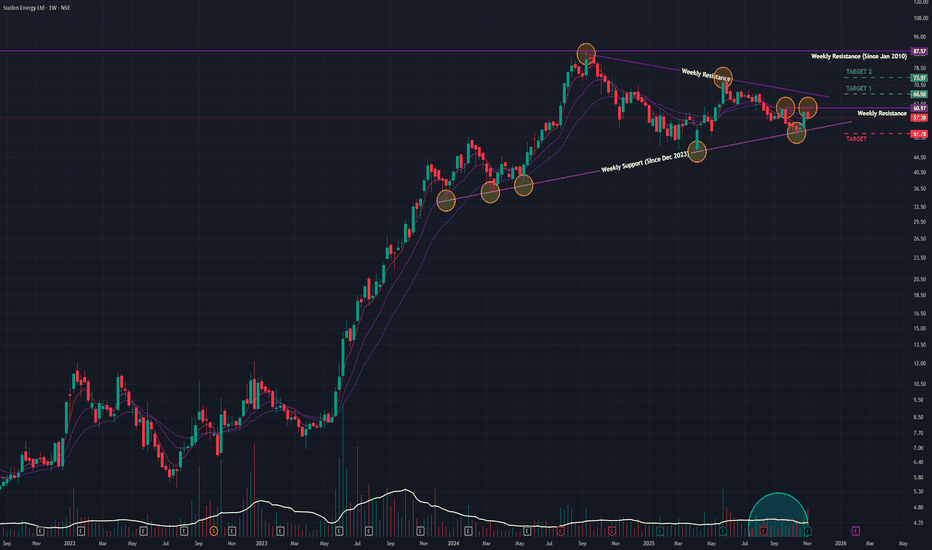
Suzlon (W): Cautiously Bullish, Pending BreakoutThis is a classic "wait and watch" scenario. The stock is coiling in a major, year-long consolidation pattern, and the pressure is building. A powerful fundamental catalyst (record-breaking results) is now meeting a critical technical resistance, setting the stage for a significant move.
📈 1. The Long-Term Context
- The Run-Up: After hitting its all-time low in March 2020, the stock has been in a massive, multi-year uptrend, which paused in September 2024.
- The Pattern: The stock has b
Thangamayil (M): Strongly Bullish, Blue-Sky BreakoutThis is a high-conviction breakout. The stock has broken out of a year-long consolidation base, created a new all-time high, and is supported by explosive volume and powerful fundamental results.
📈 1. The Long-Term Context (The "Big Picture")
- Logarithmic View: On a long-term logarithmic chart, this move is a continuation of a major uptrend.
- The Consolidation: After hitting its previous All-Time High (ATH) in October 2024, at ₹2,567.50, the stock entered a year-long sideways consoli
Mamata Machinery Ltd – Support Reversal & Retest Zone (75-min)Mamata Machinery is showing early signs of reversal from a strong support zone around ₹425–₹430. After forming a double-bottom-like structure, the stock has bounced sharply with rising volumes, indicating a possible short-term trend reversal.
Currently, price action is approaching a retest zone (Target-1) near ₹465–₹470. Sustaining above this level can open the path toward the next resistance cluster (Target-2) near ₹505–₹515.
🎯 Key Levels:
CMP: ₹452.30 (+3.81%)
Support Zone: ₹425 – ₹430
Targe
Bharti Airtel climbs relentlessly but risks overbought correctioTopic Statement:
Bharti Airtel is on a strong bull run, maintaining momentum within a defined channel, though overbought conditions hint at a potential correction risk.
Key Points:
1. The stock is moving in a bullish up-trending channel, making it ideal for channel-based trading
2. Price generally remains above the 50-day EMA, signaling continued strength
3. The stock is currently highly overbought, and a sharp correction may be on the horizon as risk builds
Sun Pharma trades sideways within a defined rangeTopic Statement:
Sun Pharma has remained in a sideways zone throughout the year, presenting recurring opportunities for accumulation at key technical levels.
Key Points:
1. The stock is rangebound between 1550 and 1800, with no clear breakout direction so far
2. It consistently takes strong support at the 23.6% Fibonacci retracement level at 1568
3. The stock can be accumulated when it dips below the 50-day EMA, with heavier investment opportunities when it falls below the 200-day EMA
WOCKPHARMA | Strong 200 EMA Support – Bounce Trade Setup Active🧠 Analysis Summary:
The stock has bounced from 200 EMA support (~₹1,200) multiple times historically.
Current price action shows a bullish candle forming near this key level.
This setup has offered 2X+ gains in past instances.
🔍 Key Levels:
Action Price
CMP ₹1,251.60
Entry Zone ₹1,210–₹1,230
Stop Loss ₹1,170
Target 1 ₹1,350
Target 2 ₹1,400
200 EMA ₹1,200
🔄 Historical Bounces from 200 EMA:
📍 Aug 2024 – Bounce from ₹700 to ₹1,400+
📍 Oct 2024 – Bounce from ₹850 to ₹1,200+
📍 Mar 2025 – Bounce
City Union Bank (M): Strongly Bullish, Testing All-Time HighThis is a powerful long-term breakout setup. After a 4.5-year consolidation, the stock has broken its primary resistance and is now challenging its 2020 all-time high. The bias remains strongly bullish as long as the key support at ₹200 holds.
📈 1. The Long-Term Context
- The 2020 Peak: After hitting its All-Time High (ATH) in January 2020, the stock experienced a significant fall, losing nearly half its value.
- Multi-Year Base: For the next 4.5 years (from late 2020 to 2025), the sto