Bharti Airtel is still in a bull run?Major trend of the stock is bullish and repitition of a previous pattern is a possibility.
In this trade I will be trading a pattern, in fact 2 candle and 5 candle patterns.
Rising Three Method is there in the monthly charts
Bullish engulfing pattern formation on the 3 month chart.
Entry:- 1970
Risk :- 1880 (4.523960-%)
Reward :- 2360 (19.8%)
R:R is good, pattern setup is good.
Wait for the price to approach around my buying area.
Moving Averages
Good bearish setup on the higher time frame.Asian paints is one of the leading paint manufacturer in country and for the last few months the stock is trading in a parallel channel there are chance of it trying to retest the previous support zone of around 2700 levels before entering into another bearish leg.
Fundamentally stock shows some negativity as ~45% YoY decline in consolidated net profit in Q4 FY25.
Revenue slipped 4.3% YoY in this quater. Net profit fell 23.3% YoY in Q3 FY 2025.
Technically too the stock look to form bearish F
Vedanta (M): Bullish, but at a critical decision point.The stock is currently consolidating in a tight range after a historic, multi-decade breakout. The price is now coiling for its next major move. The key is whether the old resistance at ₹490 holds as new support.
📈 1. The Long-Term Context (The "Big Picture")
- Historic Breakout: After a long sideways trend, the stock finally broke its 14-year resistance line (dating back to April 2010) and subsequently set a new All-Time High (ATH) in December 2024.
- Consolidation Phase: Since that A
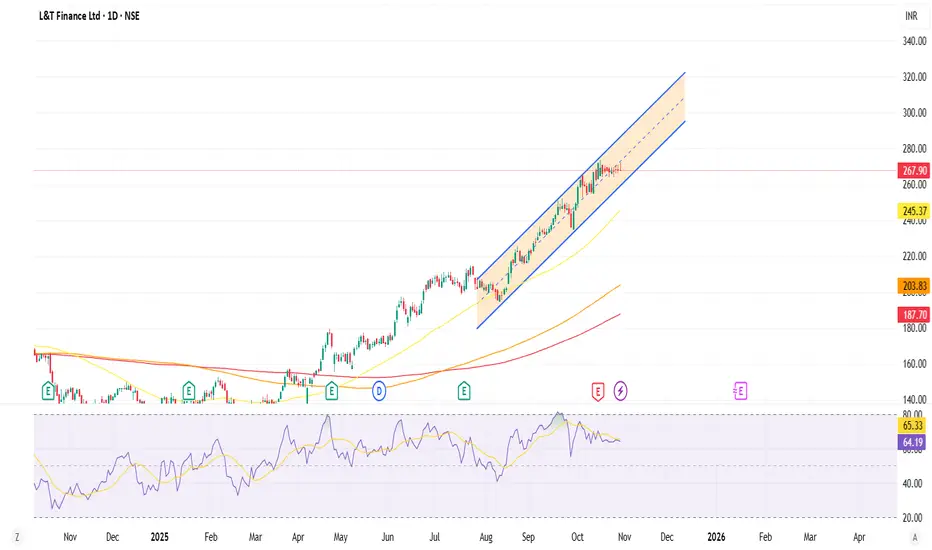
LTFLTF shares have been trading within a defined channel and are currently positioned above their 200-day, 150-day, and 50-day moving averages. Over the last three months, this positioning—combined with a gradual price increase—indicates a potential for further upward momentum.
However, to manage risk effectively, implementing a stop-loss strategy remains essential.
Graphite (D): Mighty Dual-Resistance Breakout Signals Major RevAfter being in a multi-year downtrend since its All-Time High (ATH) in August 2018, Graphite India (GRAPHITE) is showing compelling signs of a major trend reversal. Today's powerful price action has broken through two critical resistance levels, suggesting a new uptrend may be underway.
The Long-Term Bottoming Process
While the stock peaked in 2018, a very long-term bottoming process has been in place. Since April 2020, the stock has been forming a pattern of Higher Lows (clearly visible
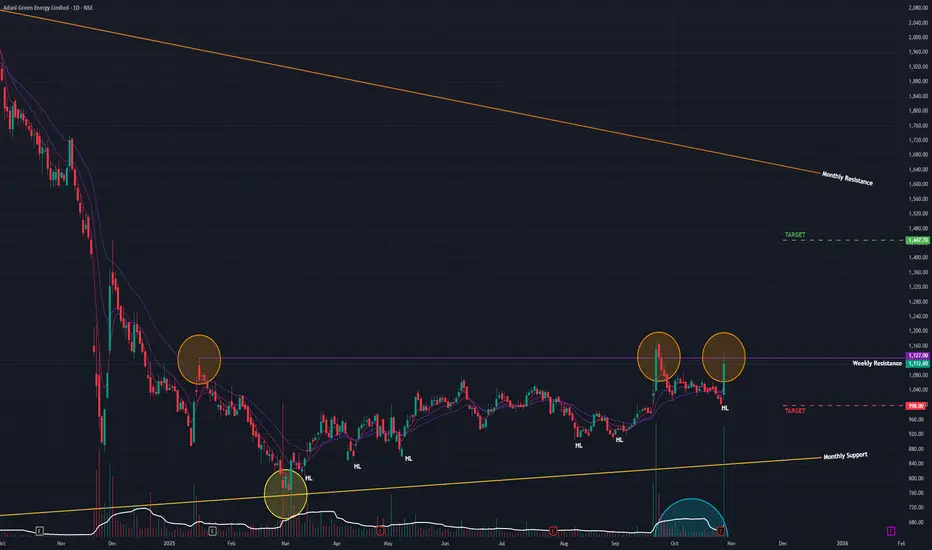
Adani Green (D): Surges 10.79% But Fails at Key ResistanceAfter being in a downtrend since June 2024, Adani Green is showing clear signs of a potential trend reversal. Since March 2025, the stock has been building a bullish base by forming a constructive pattern of Higher Lows . However, this new uptrend is now facing its most significant test.
Today's Battle at Resistance
The stock's upward progress has been blocked by a major horizontal resistance trendline . Today's session (Wednesday, October 29, 2025) saw a powerful attempt to break this le
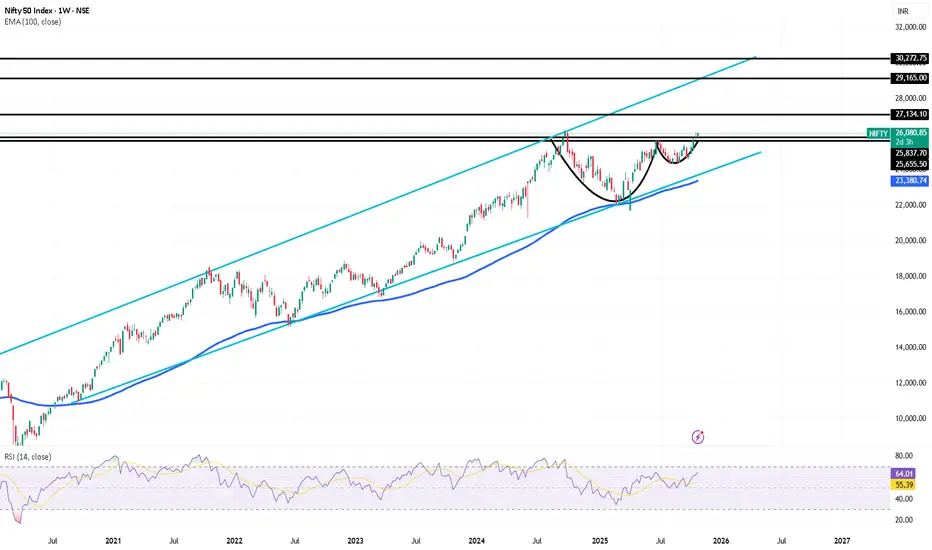
NIfty Positional on the verge of Breakout PatternHello everyone,
Nifty weekly forming Cup & handle pattern and about to break along with lifetime high with Good RSI strength is 64. Nifty corrected 16% from preivous high of 26270 falls continue for almost 6 month and in next 6 month recovered fully....possible trading in channel above 26600-700 there is 27500 and the 30000 is the targets.
Sai Silks (D): Confirms Major Breakout with Successful RetestAfter a long downtrend that ended in May 2025, Sai Silks (Kalamandir) has been in a clear trend reversal, establishing a constructive pattern of Higher Lows . This new uptrend has now achieved a significant technical milestone.
The Breakout and Confirmation
The stock's primary challenge was a long-term horizontal resistance trendline that had been in place since May 2024. This level has now been decisively cleared in a two-step process:
1. The Breakout (Yesterday): The stock successf
BPCL (D): Forms Bullish MorningStar, Challenges Major ResistanceAfter reversing from a short-term downtrend, BPCL (Bharat Petroleum Corporation Ltd) has flashed a powerful bullish signal. However, this newfound momentum is now running directly into a major, long-term resistance trendline that has capped its progress, setting the stage for a critical battle.
The Bullish Setup: A Morning Star at Support
Today's price action (Monday, October 27, 2025) was highly constructive for the bulls:
- Price & Volume Surge: The stock rallied +3.80% on a strong v
Jayneco (W) - Breaks Out on Massive VolumeAfter an incredible 181%+ rally since April 2025, Jayaswal Neco Industries (JAYNECO) has been consolidating in a sideways trend for the past few weeks. This period of consolidation has now been decisively resolved to the upside.
This Week's Powerful Breakout
The past week's price action (ending Oct 24, 2025) was a significant win for the bulls:
- Strong Price Surge: The stock rallied by +15.95% for the week.
- Enormous Volume: This move was backed by a massive volume of 67.09 mill
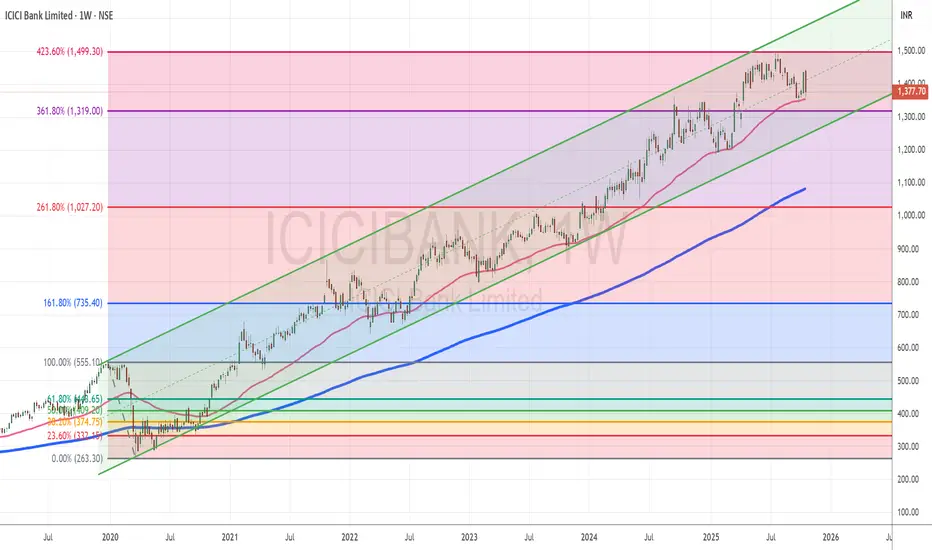
ICICI Bank marches upward, nearing major Fibonacci resistanceTopic Statement:
ICICI Bank continues its long-term bull run, supported consistently by technical levels, but now approaches a key resistance near the 1500 mark.
Key Points:
1. The stock trades reliably within a well-defined up-trending channel, maintaining long-term bullish structure
2. Price is repeatedly supported by the 50-day EMA, acting as a dynamic floor throughout its rallies
3. It has only dipped below the 200-day EMA during rare deep corrections, like the COVID crash of 2020
4. Based
Torrent Power - Short Term Investment IdeasTorrent Power Limited - Technical Analysis Report
Current Market Price: 1,328.40
Opportunity: The Stock is Trading at 40% discount to intrinsic value, presenting a potential value investment in the #Integrated #powersector.
Technical Setup: Stock testing critical 20 #EMA support on monthly timeframe after forming #HiddenDivergence #pattern. Recent decline suggests caution but oversold conditions emerging.
Technical Snapshot
Trend: Monthly chart shows trend continuation pattern with classic d
Bank of India (D) - Breakaway Gap Signals New MomentumAfter a severe, decade-long downtrend from its All-Time High in September 2010, Bank of India has been in a slow and steady reversal phase since June 2020. This bottoming process has become more evident since June 2022, with the stock consistently carving out a bullish structure of Higher Lows , indicating a gradual shift in control from sellers to buyers.
Today's Decisive Breakaway Gap
Today's session (Thursday, October 23, 2025) provided a powerful confirmation of this new strength. The
Reliance eyes breakout as bulls return post earningsTopic Statement:
Reliance has gained bullish momentum following strong earnings and a market rally, now approaching a key resistance zone with breakout potential.
Key Points:
1. The stock is climbing toward a triple top formation, which carries a high probability of a bullish breakout
2. It is trading above both the 50-day and 200-day EMAs, indicating strength but also making it relatively expensive in the short term
3. Price continues to move comfortably within its established up-trending chan
eClerx (D) - Gathers Momentum for All-Time High BreakoutAfter a lengthy consolidation phase, eClerx Services is showing strong signs of renewed bullish momentum, positioning itself for a potential breakout to new all-time highs.
The Context: A Healthy Consolidation
Since reaching its All-Time High (ATH) in April 2025 , the stock has been trading within a well-defined sideways range, consistently respecting the upper resistance and lower support trendlines. A key bullish characteristic of this consolidation phase has been the noticeable drying
Infy remains under pressure, stuck in long-term sideways rangeTopic Statement:
Infy has struggled this year with repeated price declines, remaining stuck in a wide sideways zone while trading at heavily oversold levels.
Key Points:
1. The price has fallen to the 38.2% Fibonacci retracement level multiple times, where it continues to receive support
2. It is currently trading below both the 50-day and 200-day EMAs, marking the stock as highly oversold
3. Infy has been range-bound between 1300 and 2000 since 2022, reflecting a prolonged phase of consolidati
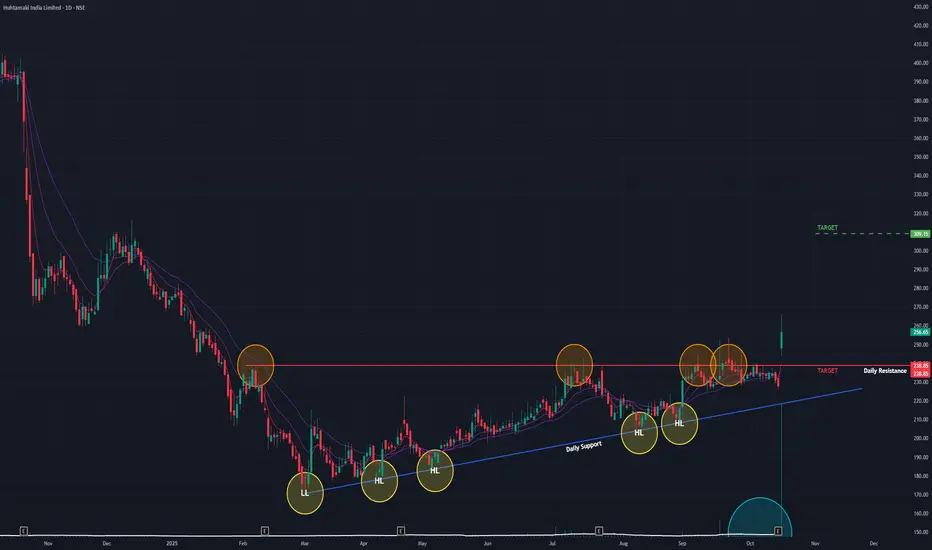
Huhtamaki (D) - Explosive 12% "Gap-and-Go" BreakoutAfter a steep downtrend from its all-time high, Huhtamaki India has signaled a powerful bullish reversal, executing a massive "Gap-and-Go" breakout from a classic accumulation pattern today.
The Setup: An Ascending Triangle
Following its downtrend, the stock began a bottoming process by forming an Ascending Triangle . This bullish pattern is characterized by a series of Higher Lows pushing up against a flat horizontal resistance, indicating that buying pressure was systematically building
XAUUSD // Liquidity Grab // ATH# Gold Spot / U.S. Dollar - Liquidity Analysis
Market Structure Analysis
Key Liquidity Zones Identified
The chart highlights two critical liquidity zones where significant price action is anticipated:
**Upper Liquidity Zone: $4,212 - $4,219**
This zone represents an area of accumulated buy-side liquidity, typically formed by stop-losses from short positions and buy-stop orders. The red shaded area indicates where institutional players may target for liquidity capture before potential rever
HCLTech shows signs of reversal after global-policy-driven correTopic Statement:
HCLTech, like other IT peers, has been dragged down by global economic policies but now shows early signs of recovery from key support levels.
Key Points:
1. The stock corrected down to the 38.2% Fibonacci retracement level at 1385, where it found strong support
2. Price reversed after touching the lower boundary of its bullish channel, reinforcing the trend structure
3. Currently trading below the 50-day EMA, the stock is oversold in the short term and presents a possible accu
Landmark (D) - 100%+ Rally from Lows Now Faces Key ResistanceLandmark Cars is at a critical juncture after a spectacular recovery from its all-time lows. A powerful surge today has brought the stock right up against a major resistance level, setting the stage for a potentially decisive breakout attempt.
The Context: A Dramatic Turnaround
After peaking at its All-Time High (ATH) in February 2024, the stock entered a significant downtrend, culminating in an all-time low in April 2025. From that bottom, however, the stock has staged an incredible reversa
GM Breweries (W) - An Explosive 22% Breakout Signals New UptrendAfter a corrective downtrend from its September 2024 all-time high, GM Breweries has executed a powerful, high-volume breakout, signaling that its consolidation phase is over and a new uptrend is likely underway.
The Bullish Setup
Following its reversal from a low in March 2025, the stock began constructing a solid base. It formed a clear pattern of Higher Lows , indicating a gradual absorption of supply and a shift in control from sellers to buyers. This constructive price action set the
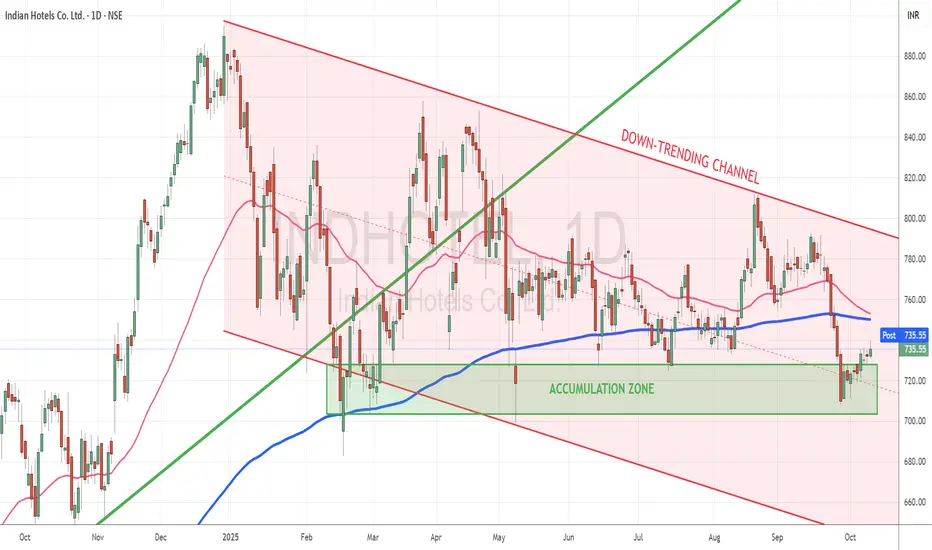
India Hotels enters bearish zone under heavy selling pressureTopic Statement:
India Hotels has faced persistent selling since the start of the year, breaking its uptrend and entering a bearish phase.
Key Points:
1. The stock is now moving within a down-trending channel, making channel-based trading effective
2. Price is trading below both the 50 and 200-day EMAs, marking it as highly oversold in the short to medium term
3. Strong support has been established at the 700 level, which serves as a key accumulation zone for long-term investors