Tech Mahindra Consolidates in a Wedge After Strong Support at KeTopic Statement:
TechM has been stuck in a consolidation zone, rebounding from strong support levels and forming a wedge pattern that may signal an upcoming breakout.
Key Points:
* The stock corrected up to the 30% Fibonacci retracement level, finding strong support around 1314
* It touched the 200-day moving average, which acted as a support and triggered a rebound
* The candlestick formation resembles a wedge, clearly marked on the chart with blue trend lines, indicating potential for a decis
Moving Averages
Banknifty analysis for the upcoming movement in the index.Banknifty has been trading in a range for a long time and is now trading around the support levels of 56600.
The RSI indicator on the daily charts is showing some bearish divergence and today the market has taken a halt after 2 days of fall.
If the market starts travelling on the lower side there are chances of testing the lower support level of 56120.
The market has been trading in a range of 56600 to 57600. And the support is tested many a times.
Bullish trades can be initiated for intrada
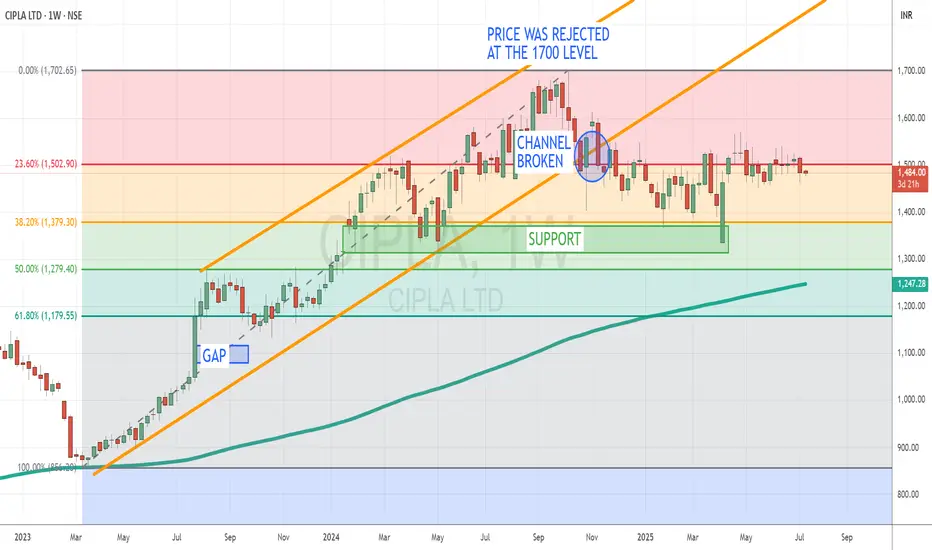
Cipla Trades Sideways Within Defined Range, Eyes Possible DoubleTopic Statement:
Cipla is currently stuck in a sideways zone, consolidating between key retracement levels while setting up for a potential move higher.
Key Points:
* The price is moving between 1502 (23.6% retracement) and 1380 (38.2% retracement), forming a clear horizontal range
* It remains fairly above the 200-day EMA, indicating underlying strength despite consolidation
* The stock may move up toward 1700 to form a double top, where it is likely to face strong resistance
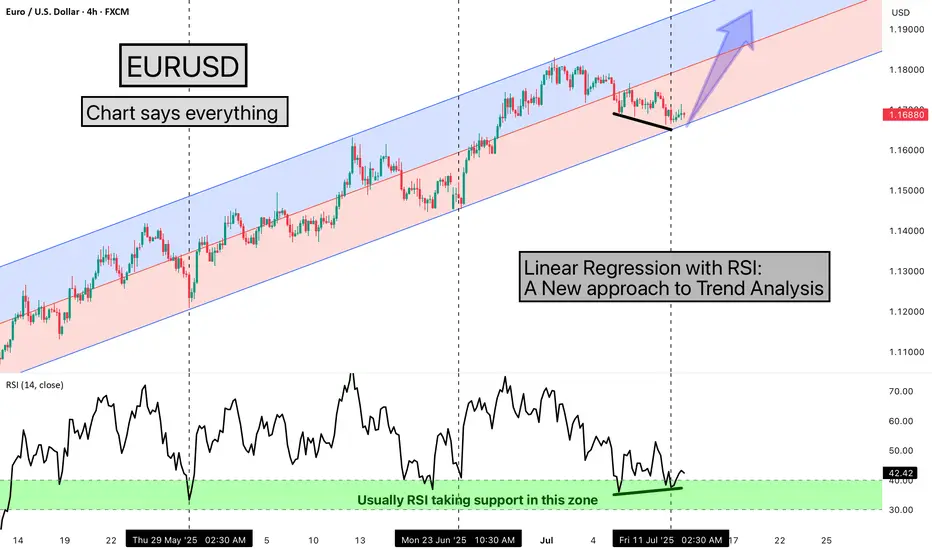
Linear Regression with RSI: A New approach to Trend AnalysisHello Friends,
Welcome to RK_Chaarts,
Today we are going to learn one Method of analysing the chart, here we are using EURUSD chart, and the method we're using is very simple & interesting, We are using the Linear Regression Trend Channel & Relative Strength Index (RSI), What happens in this method, is that we identify a particular zone where the price is making a one-sided move, like if the price is trending upwards, making higher highs and higher lows. We then apply a regression channel to i
Swiggy: a probable long trade➡️Entered this with a stop loss of 374
➡️21 ema support
➡️Consumption theme has been picking up and I am hopeful that this scrip would be a beneficiary of the theme
➡️supply zone may act as a demand zone
➡️the volume on negative days have been meagre in comparison to the volume on positive days
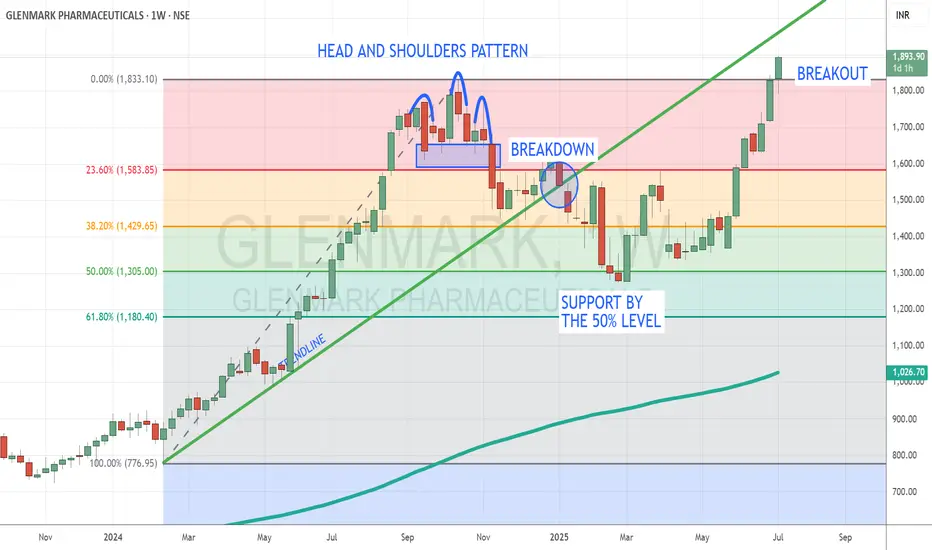
Glenmark Pharma Recovers Strongly, Approaches Resistance After MTopic Statement:
Glenmark Pharma has staged a strong bullish recovery after a severe correction earlier this year, now testing key resistance levels.
Key Points:
* The price took heavy support at the 50% Fibonacci retracement level, forming a strong base for the rebound
* The stock is breaking out above its previous high, where a head and shoulders pattern had earlier signaled weakness
* Price has overextended above the 200-day EMA, suggesting it may face resistance and potential selling pressu
Havells India Shows Early Bullish Signs After Strong Support at Topic Statement:
Havells India has corrected but is showing early bullish signals, supported by key technical levels and poised for a breakout from its short-term downtrend.
Key Points:
* The price corrected to the 38.2% Fibonacci retracement level, where it received strong support
* It touched the 200-day EMA, which acted as a deflection point, preventing further downside
* Currently moving in a short-term downtrending channel, the stock is likely to resume strong bullish momentum once it brea
Double bottom breakout and retest : LindeIndiaAfter High of 9500 levels
Linde India corrected till 5500 levels
Nr 5500 we can see there is double bottom formation.
After breakout of neckline at 6500 it retested this neckline and is now ready for next bout of rally.
We can also see that 6500 level is also 20week SMA acting as support.
Tentative target and stoploss levels are marked on the chart.
Looks bullish on coming daysRedington , broken its tight consolidation with good volume and 8.4% move. It looks positive for coming days. Stock could give 10-20% in very short duration.
200% + RVOL shows buyers interest.
Weekly if we see, this stock came out of channel structure and giving good upmove with volume push.
Stay connected for commentary for coming days
Disclaimer:
The information provided herein is for educational and informational purposes only and should not be construed as investment advice. The
Nestle India Climbs Strongly Within Bullish Channel, Eyes PotentTopic Statement:
Nestle India is moving steadily upward in a strong bullish channel, setting up for a potential breakout as it approaches previous highs.
Key Points:
* The stock is trading in an up-trending channel, making it ideal for channel-based trading strategies
* It recently retraced to the 23.6% level and is now recovering, maintaining overall strength
* A previous double top suggests that a rise to those highs could trigger a breakout if resistance is cleared
* The price consistently r
Swing/Positional Setup: Sector-wise Analysis – Cash/Options Segm✅ Swing and Positional Trade Setup
Sector-wise Analysis – Cash / Futures & Options Segment:-
Over the past 18+ years, I have developed a trading setup that revolves around sectoral analysis. My trades are taken in cash, futures, and options, based on which sector and which stock is showing strength.
Below, I’ve shared the complete sector-wise stock list. This will help you skip the most time-consuming part—stock selection—so you can focus purely on execution and discipline.
🔍 Stock Selection C
TCS Eyes Rebound as Strong Support and Results AlignTopic Statement:
TCS is currently oversold, with upcoming quarterly results potentially driving a rebound from strong technical support levels.
Key Points:
* The stock retraced to the 50% Fibonacci level at 3060, aligning with the psychological barrier around 3000 that acted as strong support
* Price is now stuck at the 38.2% retracement level at 3421, indicating a key resistance zone to watch
* Trading below the 200-day EMA suggests the stock is oversold, offering a rare and attractive investm
CG Power Rebounds After First Major Correction Supported by StroTopic Statement:
CG Power has made its first significant correction and is now set on a recovery path in line with the broader market rally.
Key Points:
* The stock respected a major trendline, receiving strong support during its recent correction
* It found repeated and substantial support at the 50% Fibonacci retracement level, reinforcing its base
* The correction was signaled by a head and shoulders pattern clearly marked on the chart, leading to the recent pullback before the recovery bega
Bajaj Auto: Wave 4 Triangle Nearing CompletionAfter completing a complex W-X-Y-X-Z correction earlier this year, Bajaj Auto appears to have started a fresh impulsive rally. The move from 7,089 to 9,004 looks like a 5-wave structure in progress, with the chart now suggesting Wave 4 is unfolding as a contracting triangle.
Wave E of the triangle seems close to completion near the lower boundary.
SMA100 is aligned with this support zone, potentially offering additional footing for price.
The Fibonacci retracement zone (Wave 1–3) lies betwe
PepsiCo (PEP): A Potential Shift from Downtrend
Following a prolonged corrective phase that commenced in March 2025, PepsiCo's price action is exhibiting noteworthy signs of a potential bullish reversal. A significant breakout from a multi-week consolidation range on the daily timeframe suggests a possible shift from distribution to accumulation. This hypothesis is supported by strengthening momentum indicators and the reclamation of a key moving average, warranting a closer look at key technical levels.
Detailed Technical Analysis:
Tata Motors Holds at Key Support, Oversold Levels Hint at PotentTopic Statement:
Tata Motors, heavily beaten down and still oversold, is clinging to crucial support that could define its next move.
Key Points:
* The stock has repeatedly taken support at the 61.8% Fibonacci retracement level, where it currently trades even today
* Price is hovering just above the 180-day EMA, suggesting a delicate balance between support and further downside risk
* A move up is possible from this oversold level, but if support breaks, the price could slide further toward the
Wipro Trades in a Tight Wedge After Support-Led ReversalTopic Statement:
Wipro, a lagging IT stock, has shown signs of reversal after strong support at the 50% retracement level, with a wedge pattern hinting at a decisive breakout ahead.
Key Points:
* The stock retraced to the 50% Fibonacci level at 225, where it found strong support and reversed
* Price had dipped below the 180-day EMA during the correction, further reinforcing the significance of the support zone
* A wedge pattern is now forming, and a breakout on either side could define the next
BPCL Gains Momentum After Key Support, Faces Resistance AheadTopic Statement:
BPCL has made a strong upward move in the recent rally, though key resistance levels and chart patterns suggest caution.
Key Points:
* A head and shoulders candlestick pattern is visible, indicating potential reversal signals to watch
* The stock took heavy support at the 50% Fibonacci retracement level, where it also briefly dipped below the 180-day EMA
* Price is currently facing resistance at the 23.6% Fibonacci level near 317, which may act as a short-term cap on further ga
BEL Extends Strong Bull Run Amid Geopolitical TailwindsTopic Statement:
BEL has surged into a powerful uptrend, fueled by geopolitical tensions and a breakout from its previous downtrend.
Key Points:
* The stock recently broke out of a downtrending channel and is now moving within a strong bullish uptrending channel
* It is rising sharply at a 45-degree angle, reflecting intense buying momentum
* The price has significantly overextended above the 180-day EMA, indicating an overbought condition
* The uptrend remains intact as long as the price holds